Equilibria and kinetics of natural gas adsorption on multi-walled carbon nanotube material
Maedeh
Delavar
,
Ali
Asghar Ghoreyshi
*,
Mohsen
Jahanshahi
,
Soodabeh
Khalili
and
Nima
Nabian
Chemical Engineering Department, Babol University of Technology, Babol, Iran. E-mail: aa_ghoreyshi@nit.ac.ir; Fax: +98-111-3220342
First published on 10th April 2012
Abstract
In this study the equilibrium uptake of methane as the main constituent of natural gas (NG) by the multi-walled carbon nanotubes (MWCNTs) as well as the kinetic of adsorption was investigated at the temperature range 283–318 K and pressure up to 50 bar. The experimental apparatus consisting of a dual adsorption vessel was set up for the measurement of equilibrium adsorption of methane on the adsorbent using a volumetric technique (pressure decay). The average pore diameter, specific surface area and total pore volume of the MWCNT adsorbent were 4.6 nm, 294 m2 g−1 and 0.62 cm3 g−1, respectively. The results indicated that an optimal methane storage capacity up to 34 wt% was achieved at a temperature of 283 K and pressure of 50 bar. Several model isotherms such as Langmuir, Freundlich and Sips were examined to fit the equilibrium uptake data. The best fit was obtained with the Sips model based on the values of the regression correlation coefficient. The kinetics of methane adsorption on MWCNT was also investigated and the results revealed fast sorption kinetics for methane adsorption on MWCNTs. Gas adsorption kinetic data were analyzed in terms of the pseudo-first-order kinetic model and intra-particle diffusion model and the model parameters were recovered through a nonlinear fit to the experimental data. Isosteric heat of adsorption was evaluated based on the Clausius–Clapeyron equation at different temperatures. Small values of isosteric heat of adsorption confirmed the physical nature of the adsorption mechanism. The high capacity for natural gas storage also emphasized that MWCNT can be a good candidate as a porous media for natural gas storage compared to a conventional adsorbent such as activated carbon. However, lower temperatures and higher pressures are required to improve the NG storage capacity on the MWCNT adsorbent.
Introduction
Natural gas is an attractive alternative to other conventional fuels due to low price, being naturally abundant and producing less toxic gas emission.1,2 Different technologies are known for on-board natural gas storage: liquefied natural gas (LNG), compressed natural gas (CNG), and adsorbed natural gas (ANG). High costs, associated with the design and manufacture of liquid methane containers in the case of LNG, and difficulties related to high operating pressure, in the case of CNG,3 have meant that the ANG process has become a promising candidate for methane storage and handling. However, to develop this technology, appropriate adsorbents with superior characteristics and high storage capacities are required for development.Many types of porous media have been developed such as molecular sieves, zeolites, activated carbon, etc. to adsorb and store gases.4,5 Among solid adsorbents, carbonaceous materials such as activated carbon and graphitic nanofibers have been evaluated for methane adsorption. Some interesting properties of these materials such as high surface area, large pore volume and low density render them as suitable materials for high gas adsorption.6,7
Activated carbons with diversified microporous structures constitute an important category of potential adsorbents for natural gas storage. Granular activated carbon prepared by impregnation of oil palm shell by ZnCl2 was used by Arami-Niya et al.8 for methane adsorption. The maximum methane adsorption reported in this study, was 12 cm3 STP/g (0.5 mmol g−1) at a pressure of 800 mmHg which increased by 100% under further physical activation with CO2. However, their results cannot be compared with the results of the present study because their experiments have been carried out at relatively low pressures near to atmospheric pressure. Monge et al.9 investigated the adsorption of methane on a series of microporous activated carbon (AC), activated carbon fibers (ACFs) and superactivated carbon (SAC) at 298 K and 4 Mpa (40 bar). They have reported a maximum storage capacity of 13 mmol.g−1 with SAC due to its higher micropore volume. Adsorption of methane on porous metal carboxylates was compared with other adsorbents such as activated carbon and zeolite.10 The results of this study revealed that the metal carboxylates demonstrated one of the highest adsorption capacities for methane with a maximum of 282 cm3 STP/g (12.6 mmol g−1) at 50 bar and 298 K. The results of this study suggest that porous adsorbents for methane adsorption should have high porosity rather than high specific adsorption sites or structures.
Since the discovery of carbon nanotubes (CNTs) in 1991,11 much research has been carried out to examine the adsorption properties of this new kind of material because of its unique properties such as uniform porosity, high specific surface area, low mass density.12 The internal and external adsorption sites of the curved nanotubes increase surface area and therefore influence the extent of adsorption.13 With respect to the interesting properties of CNTs, representation of appropriate gas storage properties by the ANG method is an interesting projected area. At present, investigations around gas storage on CNTs mainly focus on hydrogen storage. Little attention has been paid to other gases, such as methane and oxygen, and the majority of these attempts concentrated on SWCNTs as the adsorbent.14–16
Recently, pressure swing adsorption (PSA) processes using porous adsorbents have become promising candidates for gas adsorption in ANG technology due to low cost, high selectivity, high adsorption capacity and easy regeneration of adsorbents.17 Having knowledge of the adsorption isotherms and rate parameters of each adsorbate is the first step in the design of a PSA system. Equilibrium and kinetic parameters are also required as input information to the modeling and simulation of PSA processes. The adsorption isotherms give insight about maximum gas storage capacity attainable by a specific adsorbent, while the rate parameters refer to mass transfer resistance arising from diffusion of sorbates through the external film, macropores, and micropores of the adsorbent.18
The main objective of the present research was to assess the potential of MWCNT as an effective adsorbent for remarkable storage of methane as the main constituent of natural gas. Experimental results of methane adsorption by MWCNT at equilibrium state were described by several model isotherms. The kinetic experimental data was also analyzed in terms of different kinetic models to determine the mechanism of adsorption. Isosteric heat of adsorption was evaluated from a set of isotherms based on the Clausius-Clapeyron equation. The parameters of equilibrium and kinetic models were recovered from a nonlinear fit to the experimental data.
1. Materials and methods
1.1. Material characterization
The MWCNT used in this work were purchased from Alpha Nanotechnologies Company, Ltd (China) which was synthesized with CVD method. MWCNTs were 15–20 nm in outer diameter, about 4 nm in inner diameter and about 30 micrometers in length. The purity of MWCNTs was greater than 95%. Also the apparent density of MWCNTs was estimated to be 0.06 g.cm−3.CNTs were characterized with respect to their wall thickness (single or multi-walled), diameter and length by SEM and TEM. The physical properties were measured by the BET technique employing N2 adsorption isotherm at 77 K. N2 adsorption/desorption isotherms were measured at a relative pressure (P/P0) range 0.0001–0.99 and used to determine surface area, average pore diameter and pore volume.
1.2. Adsorption apparatus
Adsorption experiments were conducted in agreement with the volumetric (pressure decay) method; the pressure drop due to adsorption was measured in a closed system. A dual sorption vessel apparatus was fabricated and used in this study for the assessment of methane storage by MWCNTs. Fig. 1 displays the apparatus that was designed to carry out experiments. Prior to each experiment, MWCNTs were out gassed at 200 °C overnight to remove any adsorbed contaminants.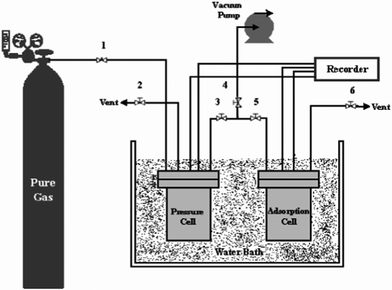 | ||
| Fig. 1 Schematic diagram of the apparatus used to measure gas storage capacity. | ||
The gas was introduced from the gas cylinder into the pressure cell using valve 1. The temperature of the pressure cell was monitored by a temperature probe located in the pressure cell. The pressure in pressure cell was measured by a pressure transducer located in the pressure cell. Before the measurement, the system was fully vacuumed to 0.1 mbar using a strong vacuum pump (Edwards, U.K., Model E2M2). The measurement of cell volume was carried out using helium gas loaded in a cell named the calibration cell. The gas was then spread in the adsorption cell through valve 3 and valve 5. The pressure of the adsorption cell was read using the pressure transducer located in the adsorption cell. Both pressure cell and adsorption cell volumes were 325 cm3. The temperature of installation was controlled by a water bath. The pressure and temperature of each cell were continuously recorded and transmitted to a computer. The maximum allowable operating pressure was 50 bar and the allowable operating temperature range was 283–343 K. The precision of the pressure transducer was 0.01 bar. The amount of MWCNTs used in one batch experiment was about 15 g.
Due to the methane adsorption, the cell pressure reduced until equilibrium conditions were reached. The amount of adsorbed gas was calculated using the material balance and the Soave–Redlich–Kwong (SRK) equation of state at equilibrium conditions.
The material balance equation for calculation of adsorbed amount is shown below:
 | (1) |
Subscript 1 refers to an initial state, while subscript 2 represents the final equilibrium state. Subscript L and A also refer to the pressure cell and adsorption cell, respectively.
2. Result and discussion
2.1. Characterization of materials
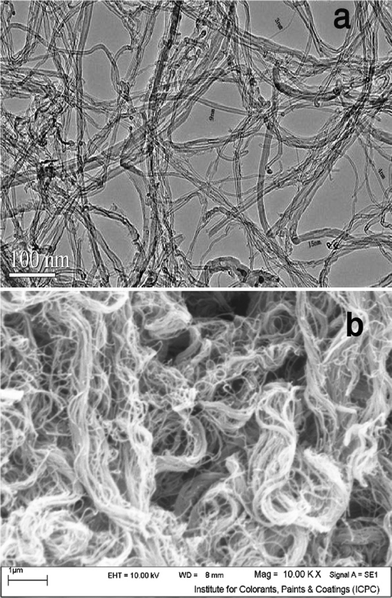
Fig. 2 (a) shows the TEM micrograph of the MWCNT adsorbent used in this study. It was clearly demonstrated that the MWCNT contained a small amount of catalyst particles (as an impurity). The caps of MWCNT were opened. In order to determine the morphology of MWCNT, SEM analysis was carried out too. Fig. 2 (b) shows a SEM image of the MWCNT adsorbent. It is obvious that via van der Waals forces, the MWCNT are held together into bundles.Fig. 3 presents the N2 adsorption–desorption isotherms of the MWCNT. The specific surface area about 294 m2 g−1, mean pore diameter 4.68 nm and total pore volume about 0.6231 cm3 g−1 was measured by Brunauer–Emmett–Teller (BET) for the kind of MWCNT.
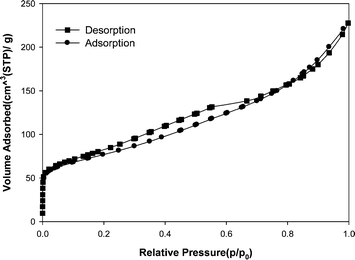 | ||
| Fig. 3 N2 adsorption–desorption plot of the MWCNT adsorbent. | ||
2.2. Adsorption experiments
The adsorption studies were carried out at different pressures between 0 to 50 bar and 3 different temperatures, i.e. 283, 298 and 318 K. At any given temperature, the amount of gas adsorbed was a function of the pressure. Results demonstrated that methane uptake increased with an increase in pressure and a decrease in temperature. Fig. 4 illustrates the variation of methane equilibrium uptake by MWCNT adsorbent versus pressure at different temperatures. High adsorption capacity of methane on the MWCNT adsorbent, compared to adsorption capacity of other adsorbents reported in the literature, is concluded from the unique surface properties of the MWCNT such as highly uniform pore size and higher total pore volume value, although the specific surface area may not be high. As it is clear from Fig. 4, the adsorption of methane on the MWCNT seems still to continue at higher pressures.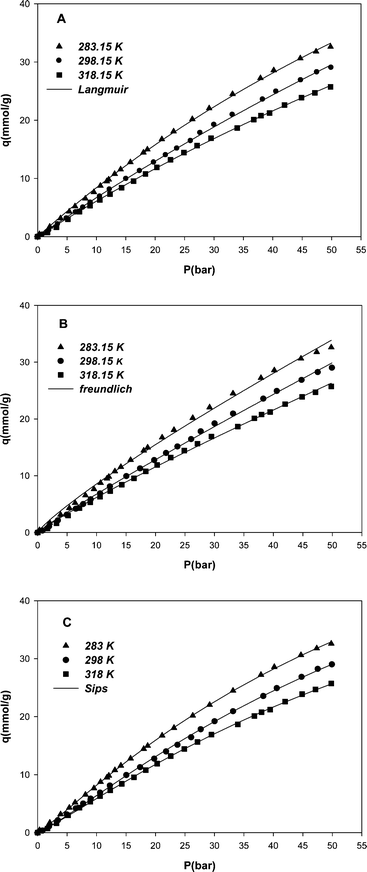 | ||
| Fig. 4 Adsorption isotherms of methane on the MWCNT adsorbent at different temperatures and pressures and nonlinear fit of experimental data with Langmuir (A), Freundlich (B) and Sips (C) models. | ||
In this study the maximum amount of methane uptake by the MWCNT adsorbent was obtained, 33 mmol g−1 at 283 K and 50 bar. The amount of methane uptake by the MWCNT may show to be high with respect to the measured pore volume, but it should be noted that the volume measured by nitrogen adsorption differs from the volume accessed by the methane molecules.
The results confirmed that by decreasing temperature to less than 283 K and increasing pressure to above 50 bar, higher amounts of methane absorption can be achieved.
2.3. Adsorption isotherm models
There are many adsorption isotherm models that describe the amount of gas adsorbed on the adsorbent as a function of its pressure at constant temperature. Some of them such as Langmuir, Frendlich and Sips are more common and practical in gas adsorption.The Langmuir isotherm is based on the three key assumptions; monolayer coverage, site equivalence and site independence. These assumptions represent ideal conditions in adsorption of a specific adsorbate on an adsorbent surface, but in the case of gas adsorption on a well-defined solid surface, may be justified as reasonable assumptions.19
The Langmuir isotherm is given in the following equation:
 | (2) |
Where qe is the amount of gas adsorbed per unit mass of MWCNT (mmol g−1); qm is the maximum amount of gas adsorbed (mmol g−1) and Kl is defined as Kl = Ka/Kb, Ka and Kb are adsorption and desorption constants, respectively.
The Freundlich isotherm is given by:
 | (3) |
The Sips or Langmuir–Freundlich isotherm is given by:
 | (4) |
Isotherm parameters were obtained through a nonlinear fit of experimental data with model isotherm equations. Table 1 shows the values of Langmuir, Freundlich and Sips isotherms parameters. By increasing the temperature, the values of Kl, KF and b parameters decreased. These results confirm that the affinity between methane and MWCNT had an inverse relationship with temperature.22 By inspecting the R-squared values (regression correlation coefficients) for three model isotherms (Table 1), the best results are obtained using the Sips model. The model predicted values are shown along with the experimental data for all models in Fig. 4 (A, B and C) for comparison.
| Langmuir | Freundlich | Sips | ||||||||
|---|---|---|---|---|---|---|---|---|---|---|
| T/K | qm | k l | R 2 | KF | n | R 2 | qm | b | n | R 2 |
| 283 | 128.9 | 0.0069 | 0.9993 | 1.188 | 1.17 | 0.9972 | 80.92 | 0.0143 | 0.88 | 0.9998 |
| 298 | 111.32 | 0.0068 | 0.9969 | 0.806 | 1.08 | 0.9986 | 77.16 | 0.0130 | 0.84 | 0.9996 |
| 318 | 102.86 | 0.0065 | 0.9985 | 0.776 | 1.11 | 0.9985 | 72.16 | 0.0119 | 0.87 | 0.9998 |
2.4. Adsorption kinetic study
Kinetic studies of adsorption are necessary to evaluate the effectiveness of an adsorption process. By this way it is possible to predict the rate-limiting step in an adsorption process and to obtain a conceptual understanding of the adsorption mechanism associated with the phenomena.19Two of the most widely used kinetic models are the pseudo-first-order kinetic equation and intra-particle diffusion model. The Lagergren pseudo-first-order kinetic model might be represented by the following equation:22
 | (5) |
Where k1 is the rate constant of pseudo-first-order adsorption, qe (mmol g−1) is the adsorption capacity (i.e. the amount of adsorption at equilibrium) and qt (mmol g−1) is the amount of gas adsorbed at time t (sec). By definite integration and applying the initial conditions qt = 0 at t = 0 and qt = qt at t = t, eqn (5) becomes:
 | (6) |
Eqn (6) is exact for a non-linear isotherm only when external mass transfer (film resistance) is the controlling step in the process. However, it was frequently used as an approximation for non-linear systems with pore or surface diffusion mechanisms. The main advantage of this approximation is in its simplified formula to describe unsteady state diffusion in porous particles. Thus, it has been developed only for no-reaction cases and cannot differ between the adsorbed and the diffusing phase, while these different steps can be generally recognized in the case of adsorption in porous particles. However, many researchers have employed the pseudo-first order kinetic equation to describe reactive adsorption at unsteady state diffusion phenomena.23,24
The main purpose of the present study is to investigate the potential of carbon nanotube material for natural gas storage. Therefore, the kinetic study was also carried out at constant base temperature (298 K) to assess the effectiveness of the adsorption process and to obtain an understanding of the adsorption mechanism. The nonlinear plots of qt versus t in Fig. 5 yielded the first-order rate constant k1 and qe values. The qe values calculated from fitting of experimental data with pseudo-first-order kinetic are shown in Table 2. The recorded data reveal a fast kinetics for the adsorption of methane on MWCNTs in which most of adsorption occurs in the early minutes of adsorption experiments and then the adsorbent is saturated by the adsorbate. By increasing pressure at a constant temperature, the first-order rate constant k1 increased. This indicates that the uptake of methane onto the MWCNT adsorbent increased at higher pressures. However, the increase in the amount of methane uptake at higher pressures increased the time required to reach equilibrium.
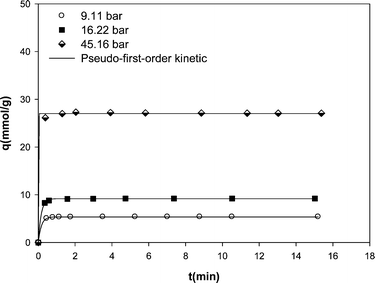 | ||
| Fig. 5 Kinetic data of methane adsorption on the MWCNT adsorbent at different pressures at 298 K along with the predicted values by pseudo-first-order model. | ||
| P/bar | qe Exp. | First-order model | ||
|---|---|---|---|---|
| qe | k 1 | R 2 | ||
| 9.11 | 5.39 | 5.37 | 6.169 | 0.9998 |
| 16.22 | 9.23 | 9.19 | 6.496 | 0.9995 |
| 45.16 | 27.09 | 27.02 | 122.845 | 0.9986 |
By eqn (6) it is not possible to identify the diffusion mechanism. Therefore, the intraparticle diffusion model was used. The intraparticle diffusion model has been used to determine the adsorption process occurring on a porous material. Intraparticle diffusion equation can be expressed as follows:25
| qt = kpt0.5 | (7) |
The plot of qt versus t0.5 for methane adsorption on the MWCNT adsorbent is shown in Fig. 6. The kinetics of methane adsorption on MWCNTs was very fast and it was not possible to record the data in the early seconds of adsorption process. Although there are no data at short times, however as shown in Fig. 6, the uptake rates exhibit double-linear region.
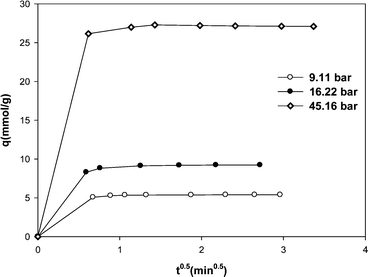 | ||
| Fig. 6 Methane adsorption onto MWCNT vs. t0.5. | ||
The uptake rate is initially very fast, and then it becomes slow. The slope of line at the early stage of adsorption gives a measure of external residence to mass transfer surrounding the particle. The second linear region with a slower slope is characterized by intra-particle diffusion. Therefore we interpret that the controlling mechanism in overall transport of methane adsorption on MWCNTs is intra-particle diffusion.
2.5. Thermodynamic studies
Heat of adsorption reflects the enthalpy change before and after adsorption, therefore, is a measure of the interaction strength between gas molecules and the surface of the adsorbent. The isosteric heat of adsorption is defined by the Clausius–Clapeyron equation:26 | (8) |
Where p (bar) is pressure at constant equilibrium uptake, R (J mol−1 K−1) is the gas constant and T (K) is temperature. The plot of ln p versus 1/T gives the isosteric heat of adsorption (Fig. 8). The calculated heat of adsorption at different constant equilibrium uptakes are shown in Table 3. As a rule of thumb, heat of adsorption of 80 kJ mol−1 or more in adsorption indicates chemisorption and smaller values are representative of physisorption.27,28 The low values obtained for the heat of adsorption confirmed that the adsorption of methane on the MWCNT adsorbent used in this study is physisorption. The negative slopes shown in Fig. 7 and their values in Table 3 also indicated that the process is exothermic.
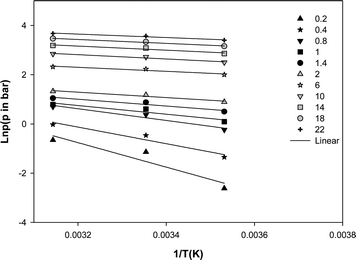 | ||
| Fig. 7 Isosteric heat of adsorption of methane on the MWCNT adsorbent (q in mmol g−1). | ||
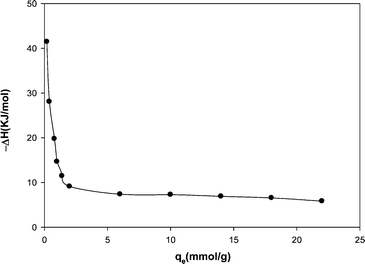 | ||
| Fig. 8 Variation of the isostric heat of adsorption with the amount of adsorption. | ||
| qe (mmol g−1) | −ΔHst (kJ mol−1) | R 2 |
|---|---|---|
| 0.2 | 41.47 | 0.934 |
| 0.4 | 28.06 | 0.943 |
| 0.8 | 19.76 | 0.951 |
| 1 | 14.65 | 0.899 |
| 1.4 | 11.47 | 0.931 |
| 2 | 9.11 | 0.949 |
| 6 | 7.37 | 0.987 |
| 10 | 7.27 | 0.957 |
| 14 | 6.90 | 0.929 |
| 18 | 6.56 | 0.984 |
| 22 | 5.83 | 0.964 |
Fig. 8 shows a decreasing trend for ΔHst with an increase in loading level of methane on the MWCNT due to weak repulsive interactions between adsorbed methane molecules.29 Basically, the isosteric heat of adsorption depends on the level of gas loading on the adsorbent surface. The isosteric heat of adsorption obtained here is lower than the reported values in the literature. Table 4 compares the isosteric heat of methane adsorption reported in the literature with that of the present study.
| Materials | Loading (mmol g−1) | −ΔHst (KJ mol−1) | Temperature (K) | Ref. |
|---|---|---|---|---|
| silicalite-I | 0.1–0.5 | 28–18 | 304,354 | 29 |
| Hβ | 0–0.4 | 16.2–15 | 273,303 | 30 |
| Naβ | 0–0.6 | 19.6–18 | 273,303 | 30 |
| Activated carbon | — | 25 | 293–323 | 31 |
| NaETS-4 | — | 29.3 | 288–318 | 32 |
| Heulandite | 0 | 19 | 298 | 33 |
| Chabazite | 0 | 15 | 298 | 33 |
| DD3R zeolite | 0–1.3 | 19 | 273–348 | 34 |
| MWCNT | 0–1.4 | 40–18 | 303–323 | 35 |
| SWCNT | 0–5 | 20–8 | 77.3 | 36 |
| MWCNT | 0.2–1.4 | 41.47–11.47 | 283–318 | This study |
| MWCNT | 2–22 | 9.1–5.8 | 283–318 | This study |
The low values obtained for isosteric heat of adsorption in the present study are due to high surface coverage. At low surface coverage, there is a strong interaction between the adsorbate and the active sites on surfaces. With an increase in surface coverage, the interaction between the adsorbate and adsorbent surface decreases due to pore filling, which leads to a decrease in the isosteric heat of adsorption.
ΔS°ads is commonly calculated from experimental data using the van't Hoff equation:
| ΔG0ads = −RTlnK0L = ΔH0ads − TΔS0ads | (9) |
Where R is the universal gas constant, T is the temperature and K0L is standard equilibrium constant for Langmuir-type adsorption.
The values of ΔS°ads, calculated by this equation, are listed in Table 5.
| ΔS0ads (J mol−1 k−1) | |||
|---|---|---|---|
| q (mmol g−1) | T = 283 K | T = 298 K | T = 318 K |
| 0.2 | −187.91 | −180.655 | −172.278 |
| 0.4 | −140.51 | −135.641 | −130.095 |
| 1 | −93.1392 | −90.6549 | −87.9381 |
| 1.4 | −81.8918 | −79.9736 | −77.9287 |
| 1.8 | −76.0014 | −74.3797 | −72.6865 |
| 2 | −73.5632 | −72.0643 | −70.5167 |
| 6 | −67.4148 | −66.2253 | −65.045 |
| 10 | −67.0615 | −65.8898 | −64.7305 |
| 14 | −65.754 | −64.6481 | −63.567 |
| 18 | −64.4819 | −63.4401 | −62.435 |
| 22 | −61.9731 | −61.0575 | −60.2022 |
From statistical mechanics, the loss of molar entropy associated with the gas phase translational degrees of freedom can be calculated using the Sackur–Tetrode equation as follows:37
 | (10) |
Where R is the ideal gas constant, m is the molecular mass, k is the Boltzmann constant, T is the temperature and h is the Planck constant. The loss of gas phase translations from the Sackur–Tetrode equation −S0g is reported in Table 6.
| T (k) | −S0g (J mol−1 K−1) |
|---|---|
| 283 | −142.34 |
| 298 | −143.41 |
| 318 | −144.76 |
The entropy analysis shows that for the coverage of higher than 1 mmol g−1 the entropy loss is much smaller than predicted by the Sackur–Tetrode equation. These experimental values of > −100 J mol−1 K−1 cannot occur with an immobile adsorbate. The new vibration with the surface will provide at most tens of J mol−1 K−1.37 This means that the adsorbed molecules must also have translational motions, otherwise the entropy loss would be closer to the Sackur–Tetrode equation (or greater than the Sackur–Tetrode equation, which is the case at 0.2 mmol g−1).
So at 0.2 and 0.4 mmol g−1 the molecules are immobile (Langmuir). But by 1 mmol g−1, the molecules being added become mobile on the surface. Indeed, with increasing coverage the adsorbates become increasingly like a two dimensional gas or liquid.
Conclusion
The capacity of a new MWCNT material as porous media for storage of natural gas was investigated in this study. The experimental isotherm of methane adsorption was determined by the measurement of equilibrium uptake of methane at pressure range 0–50 bar at different temperatures. The results obtained have shown that maximum 34 wt% of methane storage capacity was achieved at a temperature of 283 K and pressure of 50 bar. The high storage capacity of methane on the MWCNT adsorbent compared to adsorption capacity reported in literature for other adsorbents, can be attributed to the high pore volume of the used MWCNT and its uniform distribution size rather than specific surface area. The kinetics of methane adsorption on the MWCNT adsorbent was investigated using the data pertinent to the variation of uptake amount with time at different pressures at a temperature of 298 K. The results indicated very fast sorption kinetics for the methane adsorption on MWCNTs which renders it a suitable adsorbent for practical applications. The kinetic data were well interpreted in terms of pseudo-first-order kinetic model, indicating that the sorption of methane into MWCNTs is dominated by physisorption. Small values of isosteric heat of adsorption indicated the physical nature of the adsorption mechanism. The entropy analysis shows that for 0.2 and 0.4 mmol g−1, the molecules are immobile, but for 1 mmol g−1 and greater the molecules must be mobile.In conclusion, the generic results obtained from both the equilibrium and kinetic study indicated that MWCNTs are a potential material for methane storage and deserves further study.
References
- A. Blanco, J. de Oliveira, R. Lpez, J. Moreno-Piraján, L. Giraldo, G. Zgrablich and K. Sapag, Colloids Surf., A, 2010, 357, 74–83 CAS.
- S. Vela and F. Huarte-Larraaga, Carbon, 2011, 49, 4544–4553 CAS.
- N. Bagheri and J. Abedi, Chem. Eng. Res. Des., 2011, 89, 2038–2043 CAS.
- G. Zhao, B. Aziz and N. Hedin, Appl. Energy, 2010, 87, 2907–2913 CAS.
- C.-C. Huang, H.-M. Chen and C.-H. Chen, Int. J. Hydrogen Energy, 2010, 35, 2777–2780 CAS.
- R. Rakhi, K. Sethupathi and S. Ramaprabhu, Int. J. Hydrogen Energy, 2008, 33, 381–386 CAS.
- T. Ng, Y. Ren and K. Liew, Int. J. Hydrogen Energy, 2010, 35, 4543–4553 CAS.
- A. Arami-Niya, W. M. A. Wad Daud and F. S. Mjalli, J. Anal. Appl. Pyrolysis, 2010, 89, 197–203 CAS.
- J. Alcañiz-Monge, D. Lozano-Castelló, D. Cazorla-Amorós and A. Linares-Solano, Microporous Mesoporous Mater., 2009, 124, 110–116 Search PubMed.
- J. S. Lee, S. H. Jhung, J. W. Yoon, Y. K. Hwang and J. S. Chang, J. Ind. Eng. Chem., 2009, 15, 674–674 CAS.
- A. Anson, M. A. Callejas, A. M. Benito, W. K. Maser, M. Izquierdo, B. Rubio, J. Jagiello, M. Thommes, J. Parra and M. T. Martinez, Carbon, 2004, 42, 1243–1248 CAS.
- A. Leela Mohana Reddy and S. Ramaprabhu, Int. J. Hydrogen Energy, 2008, 33, 1028–1034 Search PubMed.
- M. Foroutan and A. T. Nasrabadi, Chem. Phys. Lett., 2010, 497, 213–217 CAS.
- E. Bekyarova, K. Murata, M. Yudasaka, D. Kasuya, S. Iijima, H. Tanaka, H. Kahoh and K. Kaneko, J. Phys. Chem. B, 2003, 107, 4681–4684 CAS.
- D. Cao, X. Zhang, J. Chen, W. Wang and J. Yun, J. Phys. Chem. B, 2003, 107, 13286–13292 CAS.
- K. Murata, A. Hashimoto, M. Yudasaka, D. Kasuya, K. Kaneko and S. Iijima, Adv. Mater., 2004, 16, 1520–1522 CAS.
- J. S. Lee, S. H. Jhung, J. W. Yoon, Y. K. Hwang and J. S. Chang, J. Ind. Eng. Chem., 2009, 15, 674–676 CAS.
- M. A. Sheikh, M. M. Hassan and K. F. Loughlin, Gas Sep. Purif., 1996, 10, 161–168 CAS.
- S. Sohn and D. Kim, Chemosphere, 2005, 58, 115–123 CAS.
- J. Rahchamani, H. Z. Mousavi and M. Behzad, Desalination, 2010, 267, 256–260 Search PubMed.
- S. Agnihotri, M. J. Rood and M. Rostam-Abadi, Carbon, 2005, 43, 2379–2388 CAS.
- Q. Fu, Y. Deng, H. Li, J. Liu, H. Hu, S. Chen and T. Sa, Appl. Surf. Sci., 2009, 255, 4551–4557 CAS.
- G. Skodras, I. Diamantopoulou, G. Pantoleontos and G. P. Sakellaropoulos, J. Hazard. Mater., 2008, 158, 1–13 CAS.
- Y. Ho and G. McKay, Process Biochem., 1999, 34, 451–465 CAS.
- D. Borah, S. Satokawa, S. Kato and T. Kojima, J. Hazard. Mater., 2009, 162, 1269–1277 CAS.
- L. Zhou, Y. Zhou and Y. Sun, Int. J. Hydrogen Energy, 2004, 29, 475–479 CAS.
- M. Cinke, J. Li and C. W. Bauschlicher, Chem. Phys. Lett., 2003, 376, 761–766 CAS.
- L. A. Rodrigues and M. L. C. P. da Silva, Desalination, 2010, 263, 29–35 CAS.
- V. R. Choudhary and S. Mayadevi, Zeolites, 1996, 17, 501–507 CAS.
- X. Xu, X. Zhao, L. Sun and X. Liu, J. Nat. Gas Chem., 2008, 17, 391–396 CAS.
- I. Prasetyo and D. D. Do, Chem. Eng. Sci., 1998, 53, 3459–3467 CAS.
- R. S. Pillai, S. A. Peter and R. V. Jasra, Microporous Mesoporous Mater., 2008, 113, 268–276 CAS.
- T. Grey, K. Travis, J. Gale and D. Nicholson, Microporous Mesoporous Mater., 2001, 48, 203–209 CAS.
- S. Himeno, T. Tomita, K. Suzuki and S. Yoshida, Microporous Mesoporous Mater., 2007, 98, 62–69 CAS.
- J. W. Lee, H. C. Kang, W. G. Shim, C. Kim and H. Moon, J. Chem. Eng. Data, 2006, 51, 963–967 CAS.
- M. Muris, N. Dufau, M. Bienfait, N. Dupont-Pavlovsky, Y. Grillet and J. Palmari, Langmuir, 2000, 16, 7019–7022 CAS.
- A. Savara, C. M. Schmidt, F. M. Geiger and Eric Weitz, J. Phys. Chem., 2009, 113, 2806–2815 CAS.
| This journal is © The Royal Society of Chemistry 2012 |

