Making contact: charge transfer during particle–electrode collisions
Neil V.
Rees
,
Yi-Ge
Zhou
and
Richard G.
Compton
*
Department of Chemistry, Physical & Theoretical Chemistry Laboratory, Oxford University, South Parks Road, Oxford, OX1 3QZ, United Kingdom. E-mail: richard.compton@chem.ox.ac.uk; Fax: +44 (0)1865 275410; Tel: +44 (0)1865 275413
First published on 8th December 2011
Abstract
The study of impact processes between particles and electrode surfaces is less than 20 years old, and has recently received added impetus due to the current intense interest in the chemistry of nanoparticles. In this review, we briefly appraise the historical results and recent developments in this field, and consider its potentially wide-ranging applications.
Introduction
The electrochemical study of particle impacts on electrodes has been an active research area for less than twenty years,1–4 mirroring the wider interest in nanoscience where very substantial advances have been seen over the last few years.5,6The earliest work was carried out by Heyrovský et al.,1–4 considering the voltammetry of colloidal solutions of the semiconducting oxides SnO2, TiO2, and Fe2O3. They were able to show that the voltammograms measured for a colloidal suspension of polydisperse nanoparticles (NPs) could be rationalised as a summation of the voltammetric responses of a series of homodisperse NPs (see Fig. 1). Further, using a Hg electrode, they identified catalytic proton reduction occurring on the surface of the TiO2 particles as part of the overall reduction of TiO2 particles in acidic solution.3 In ref. 4, Heyrovský et al. studied mixed Fe2O3/TiO2 NPs of different size ranges and were able to determine approximate composition: smaller NPs were more iron-rich than larger ones.
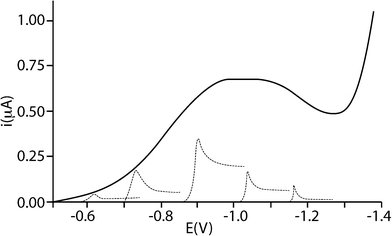 | ||
| Fig. 1 Voltammetric curve of a colloidal polydisperse solution of 10−2 M TiO2 in 2 × 10⁻² M HClO4 with a schematic indication of contributions by groups of homodisperse particles of different sizes to the total current (not to scale). Reproduced with permission from ref. 1. Copyright 1995 American Chemical Society. | ||
Subsequently, Scholz studied the collisions of liposomes, formed by mixing the lecithin molecules phosphatidylcholines with fatty acids in phosphate buffer at pH7, at a mercury electrode.7 Sharp current transients were observed as the liposomes contacted, burst and spread on the mercury surface. Integration of the areas under these current spikes enabled the number of lecithin molecules per liposome to be determined. The frequency of spikes was found to increase either side of the potential of zero charge (pzc) the of mercury electrode, with no detectable spikes at the pzc. It was concluded that these non-Faradaic spikes were caused by charge transfer and were capacitative in nature.7 The kinetics of liposome adhesion events were then explored in a subsequent study,8 and then the methodology was used to consider montmorillonite clay particles adhering onto a mercury electrode (see Fig. 2).
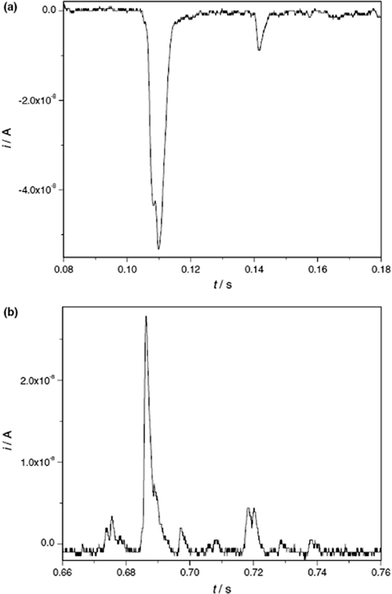 | ||
| Fig. 2 Single montmorillonite particle adhesion events at a Hg electrode in 10 mM KCL(aq) at (a) −0.02 V and (b) 0.25 V. Reproduced from ref. 7 with permission. | ||
The importance of Scholz's work in discovering that impacts could be detected directly as sharp current-time transients and that these spikes could be interpreted quantitatively to gain information about the impact process and the colliding materials, led to subsequent studies to investigate the extent that non-Faradaic signals could arise and be detected.
Departing from Scholz's experimental design of having liposomes bursting, or particles adhering to a mercury (i.e. a physically and chemically soft) surface under thermal motion, the Compton group investigated impacts of hard particles and oil droplets with Pt and Au electrodes under ultrasonically-driven motion.10–13 It was found that in all cases, current transients of microsecond duration could also be observed during the impacts. These transients were 3 orders of magnitude shorter than the 1–20 ms spikes reported by Scholz, and this was ascribed to the higher velocity of the impacting particles leading to a substantially shorter contact-time.10,11 As with Scholz, the Compton group found that the impact transients gave information about the electrode as well as the particle: first, the amount of charge passed in the transient (q) scaled with the size and conductivity of the impacting particle,12,13 but second, the sign of the current transients inverted at the potential of zero charge (pzc) of the substrate electrode, as shown in Fig. 3.12,13 The charge passed was deemed to be either transferred between the particle and the electrode, or between the (deformed) double layer and the electrode, but no conclusion could be made as to if one or both mechanisms were dominant (see Fig. 4).
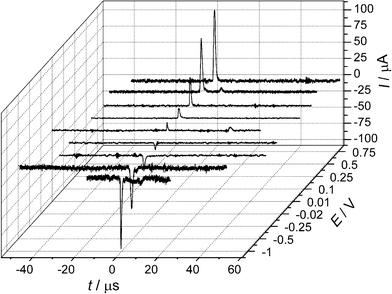 | ||
| Fig. 3 Current transients due to impacts of graphite microparticles at a polycrystalline gold electrode in 0.10 M perchloric acid showing polarity inversion at the pzc. Reproduced from ref. 12 with permission. | ||
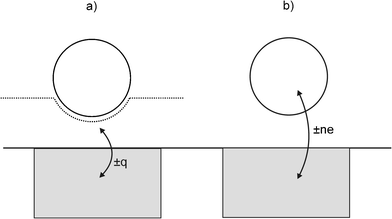 | ||
| Fig. 4 Schematic diagram showing particle collision with an electrode to illustrate: (a) non-Faradaic charge transfer occurring (see text) when an electroinactive particle rapidly deforms the double layer, and (b) Faradaic charge transfer occurring where the electrode is held at a sufficiently positive/negative potential to render the particle electroactive. | ||
However, using particles in the size range 30–300 μm made of oxidisable metals or graphite particles chemically-modified with electroactive molecules, Compton's group concluded that Faradaic charge transfer could not be observed on the timescale of these ultrasonically-driven impacts.13 This observation would later be explained in terms of the effects of contact time and particle size.
In a revisitation of his earlier work, Heyrovský published in 2006 a paper on the voltammetry of metallic nanopowder suspensions on mercury electrodes.14 In it, he described the cyclic voltammetry of suspensions of Cu, Fe, Ni, Mo, and W nanopowders and observed “elementary instantaneous flares of cathodic current” which were ascribed to the reduction of the oxide coatings on the NPs during contact with the Hg electrode (see Fig. 5). This work is the forerunner of contemporary studies as detailed next.
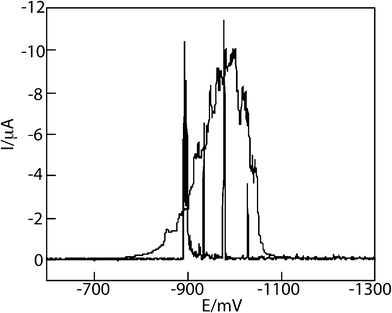 | ||
| Fig. 5 Linear DC voltammogram of 10 μg copper powder in 10 mL deaerated 0.1 M NaOH, recorded at ν = 10 mV s−1 (needle-form spikes) and at ν = 100 mV s−1 (broad peak). Curve of the blank solution merges with potential axis. Reproduced from ref. 14 with permission. | ||
Recent activity and future possibilities
Electrocatalytic (indirect) voltammetry during NP impacts
There has been substantial renewed interest in particle–electrode collisions with the observation of Faradaic charge transfer during nanoparticle (NP)–electrode impacts as a result of work published in 2007–8 by Bard et al.15,16 In an experiment that combined aspects of both the earlier work by Heyrovský and Scholz,1–4,7–9,14 they succeeded in observing single nanoparticle collisions with an electrodevia electrocatalytic amplification (see Fig. 6). To successfully use this method, the NP and electrode materials must be chosen such that the electrocatalysis occurs only on the NP and not on the electrode substrate. Using an acidified suspension of PtNPs with a carbon microelectrode target, the collisions (under thermal motion) were identified as current transients caused by the hydrogen evolution reaction occurring only at the surface of the PtNPs when contact was made with the carbon electrode.15 In ref. 16, Bard subsequently demonstrated the difference in activity of PtNPs compared to AuNPs for hydrazine oxidation.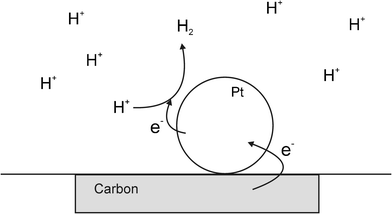 | ||
| Fig. 6 Schematic diagram showing the Bard electrocatalytic experiment, where the redox process does not proceed on the substrate electrode but does on the surface of the metal NP. | ||
In 2009, Bard extended his impact studies by first investigating the effects on the current transients by surface monolayers of thiols—thereby limiting the closest distance of approach of the NP to the electrode surface. Secondly, by demonstrating that iridium oxide (IrOx) NPs could be observed colliding with Pt microelectrodes (pre-treated with NaBH4).17 Using IrOx NPs of mean diameter 28 nm to electrocatalyse water oxidation, single current spikes were observed for each collision. The collisions were typically shorter than 1 s, in contrast to the longer duration contacts in his earlier work which were often characterised by “staircase” rather than “spike” current responses (see Fig. 7). The charge passed in the IrOx NP spikes was of the order of 10−11–10−12 C, and the collision frequency was found to be proportional to the NP concentration, and in general in the order of ca. 0.07 s−1 per pM of NP concentration.18 In ref. 19, Bard developed a stochastic model to explain the frequencies for both “staircase” and “spike” type transients. In the latter case, based on kinetic theory, the result was derived that the average collision frequency could be expressed as:
 | (1) |
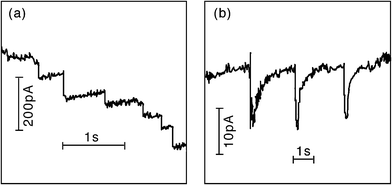 | ||
| Fig. 7 Examples of the current transients identified by Bard et al. as due to NP collisions: (a) staircase response of PtNP/Au electrode/hydrazine oxidation, and (b) spike response of IrOx NP/Pt electrode/water oxidation. Reproduced from ref. 19 with permission from the PCCP Owner Societies. | ||
Within their model, Bard et al. considered separately the two distinctive transient shapes that they have previously reported.19 The “staircase” response has been interpreted as an irreversible adsorption of the NPs with the electrode surface (or else adsorption followed by irreversible deactivation of the NP surface). “Spike” responses occur when the contact time between NP and electrode is shorter. The factors which determine which response is observed were identified as being: the nature of the electrode surface (including any pre-treatments), the nature of the NP surface including capping agents and ionic adsorption, and finally any process that may deactivate the electrocatalytic reaction occurring. Results showed that the staircase response could be successfully modelled by a diffusion-controlled movement of the NPs to the electrode surface, whereas spike impacts due to transient sticking of the NP to the surface could be described via a random walk model also assuming diffusion-control.
Direct oxidation of NPs during impacts
Very recently, the present authors have explored the direct electrochemistry of NPs that can occur during the NP collisions with electrodes, via anodic particle coulometry (APC).20–22Initial investigations considered the oxidation of AgNPs during collisions with a glassy carbon electrode (see Fig. 8 and 9): only when the electrode was potentiostatted at potentials more positive than the redox potential for the Ag/Ag+ couple were the spike transients observed.20,21 That is, the process occurring during the impact is due to:
| Ag(NP) − ne− → nAg+(aq) | (2) |
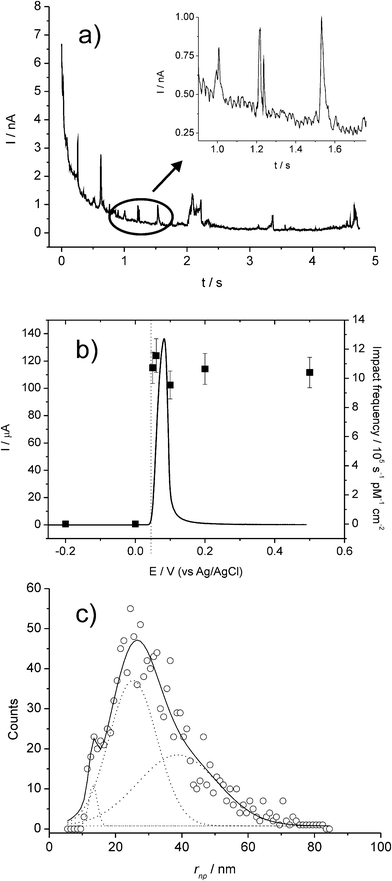 | ||
| Fig. 8 (a) Chronoamperometric profiles showing oxidative Faradaic collisions of AgNPs in citrate solution. The inset shows detailed impact spikes. (b) Overlay plot of a stripping voltammogram for a AgNP-modified GC electrode (left axis) and the impact frequency (right axis) showing the onset potential of the spikes; and (c) distribution of AgNP radii inferred from current spikes. Reproduced from ref. 20 with permission. | ||
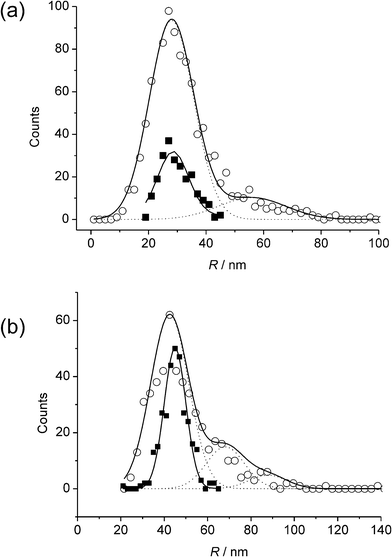 | ||
| Fig. 9 Comparison of distributions derived from APC (□) and SEM (○) analysis for AgNPs of nominal radii (a) 29 nm, and (b) 45 nm. Reproduced from ref. 21 with permission. | ||
Fig. 8 shows a typical chronoamperometric trace with multiple impact transients. In Fig. 8(b), the sharp “switch on” of the transients at the precise redox potential of the Ag|Ag+ couple provides confirmation of the Faradaic process in (2).
Further, it was found that the charge passed during the spike response was quantitatively linked to the size of the NP and therefore size distributions could be extracted from the spike transients (see Fig. 8c).
The ability to determine size distributions was shown to be useful in following the aggregation kinetics of Ag NPs suspended in acidic solutions, and key cluster sizes could be identified with those corresponding to 4, 8, and 27 NPs the most prevalent.21 It was confirmed that for a range of radii of 14–45 nm, and under the range of overpotentials studied, the oxidation of AgNPs in this size range was exhaustive and a size distribution could be obtained that agreed with independent SEM analysis, as shown in Fig. 9.21
In these studies, only spike-type responses were observed with a duration of 1–10 ms, roughly two orders of magnitude shorter in contact that those reported by Bard, but similar to those first spike observations reported by Scholz.7–9
Further, this methodology has been very recently shown to be applicable for the characterisation of AuNPs via analysis of impact spikes.22 It was demonstrated that the chloride-assisted dissolution of Au at oxidative potentials due to the complexation equilibria5,6,23–25
| Au + 4Cl− ⇄ AuCl4− + 3e− | (3) |
| AuCl4− + 2Au + 2Cl− ⇄ 3AuCl2− | (4) |
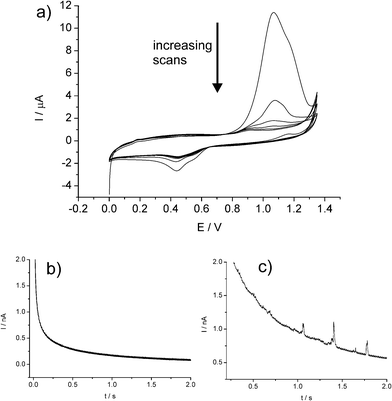 | ||
| Fig. 10 (a) Repeat CVs showing the first 6 scans of a AuNP-modified glassy carbon electrode in 0.10 M HCl. Chronoamperometric profiles showing oxidative Faradaic transients of AuNPs at potentials of (b) 0.8 V and (c) 1.1V. Reproduced from ref. 22 with permission. | ||
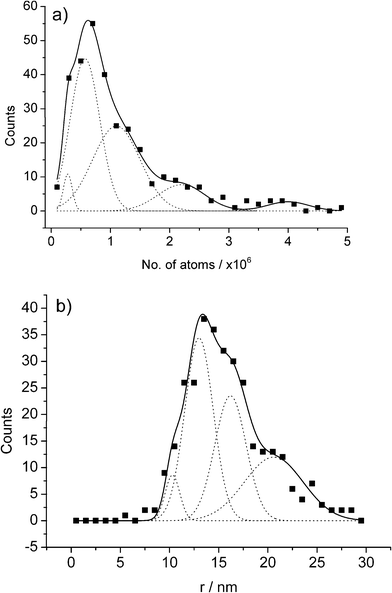 | ||
| Fig. 11 APC distributions for the AuNP impact experiments held at a potential of +1.1 V displayed in terms of (a) no. of atoms oxidised, and (b) the inferred NP size. Reproduced from ref. 22 with permission. | ||
Supporting evidence for the transient nature of the NP–electrode encounter suggested by the observation of the “spike” rather than “staircase” shape of the impact current-transients was provided when collision experiments were used to calculate sticking probabilities for the AgNP–glassy carbon impact: a value of 0.16 was determined that was essentially independent of electrode potential or NP size.27 Higher sticking coefficients would account for the “staircase” transients observed by Bard in some cases, which may differ from that of the AgNP–carbon system reported in ref. 27 by factors such as NP and substrate electrode materials, capping agents, electrolytes, etc.
Electrodeposition onto NPs during impact
In addition to these detection and sizing experiments, the Compton group have demonstrated that NP collisions may have synthetic potential, by studying the underpotential deposition (upd) of thallium and bulk electrodeposition of cadmium onto AgNPs, forming bimetallic core–shell NPs (denoted Ag@Tl and Ag@Cd respectively).28,29 For the upd of thallium, it was shown that up to a monolayer could be deposited onto AgNPs whereas for the electroplating of cadmium onto AgNPs, the average number of layers deposited was 19. In both cases, deposition occurs only during NP–electrode contact, which as before lasts approximately 1–10 ms.| Ag(NP) + mTl+(aq) + me− → Ag@Tlm | (5) |
| Ag(NP) + mCd2+(aq) + 2me− → Ag@Cdm | (6) |
These observations were possibly in contrast to those reported previously13 which found that Faradaic processes were not clearly observable when impacts were studied using micron-sized particles driven under ultrasound such that the impact transients were of microsecond duration. Cutress et al. adapted a random walk model to investigate the contact time required to electrodeposit a monolayer of metal onto an NP during collision, and found this to be on the order of 10−4 s for a 45 nm radius NP in10 mM solution of analyte (and longer for larger particles).30 This provided confirmation that the NP thermally-driven impacts were of a sufficient duration to allow experimentally-observable Faradaic process to occur, whereas the earlier ultrasound experiments were not.13 In addition, understanding of the contact time required for different degrees of charge transfer to occur should enable the finer control of electroplating processes described above,29 so that core–shell NPs could be synthesised to precise specification via impact processes.
Conclusions and future directions
The study of thermally-driven nanoparticle impact phenomena has revealed new insights into NP–surface interactions via both indirect (i.e. electrocatalytic) and direct electrochemical measurements. Identification and characterisation of metal NPs has been shown to be possible, as well as synthesis of core–shell structures.Future directions of research will inevitably involve the synthetic exploitation of some of the above phenomena, for example in controlled core–shell NP synthesis. The use of both direct APC and indirect electrocatalytic detection methods also holds promise for general NP detection and characterisation strategies which are clearly required for regulatory and environmental monitoring of NPs within industrial and environmental contexts.
The NP detection methods outlined above have wide application. For example, both metal NPs and metal oxide NPs have been shown to be detectable via direct2–4,20–22 as well as indirect15–18 Faradaic processes. Provided the interplay of factors such as (a) particle–electrode contact time, (b) size of NP, and (c) kinetics of the desired Faradaic process are favourable, the impact environment should, in principle, provide the same possibilities for experimental design and development as any other electrochemical reaction environment.
References
- M. Heyrovský and J. Jirkovský, Langmuir, 1995, 11, 4288 CrossRef.
- M. Heyrovský, J. Jirkovský and B. R. Müller, Langmuir, 1995, 11, 4293 CrossRef.
- M. Heyrovský, J. Jirkovský and M. Štruplová-Bartáčková, Langmuir, 1995, 11, 4300 CrossRef.
- M. Heyrovský, J. Jirkovský and M. Štruplová-Bartáčková, Langmuir, 1995, 11, 4309 CrossRef.
- M. Pumera, M. Aldavert, C. Mills, A. Merkoci and A. Alegret, Electrochim. Acta, 2005, 50, 3702 CrossRef CAS.
- A. Bonanni, M. Pumera and Y. Miyahara, Phys. Chem. Chem. Phys., 2011, 13, 4980 RSC.
- D. Hellberg, F. Scholz, F. Schauer and W. Weitschies, Electrochem. Commun., 2002, 4, 305 CrossRef CAS.
- F. Scholz, D. Hellberg, F. Harnisch, A. Hummel and U. Hasse, Electrochem. Commun., 2004, 6, 929 CrossRef CAS.
- D. Hellberg, F. Scholz, F. Schubert, M. Lovric, D. Omanovic, V. A. Hernandez and R. Thede, J. Phys. Chem. B, 2005, 109, 14715 CrossRef CAS.
- C. E. Banks, N. V. Rees and R. G. Compton, J. Electroanal. Chem., 2002, 535, 41 CrossRef CAS.
- C. E. Banks, N. V. Rees and R. G. Compton, J. Phys. Chem. B, 2002, 106, 5810 CrossRef CAS.
- N. V. Rees, C. E. Banks and R. G. Compton, J. Phys. Chem. B, 2004, 108, 18391 CrossRef CAS.
- A. D. Clegg, N. V. Rees, C. E. Banks and R. G. Compton, ChemPhysChem, 2006, 7, 807 CrossRef CAS.
- A. V. Korshunov and M. Heyrovský, Electroanalysis, 2006, 18, 423 CrossRef CAS.
- A. J. Bard and X. Y. Xiao, J. Am. Chem. Soc., 2007, 129, 9610 CrossRef.
- A. J. Bard, X. Y. Xiao, F. R. F. Fan and J. P. Zhou, J. Am. Chem. Soc., 2008, 130, 16669 CrossRef.
- A. J. Bard, X. Y. Xiao, S. L. Pan, J. S. Jang and F. R. F. Fan, J. Phys. Chem. C, 2009, 113, 14978 Search PubMed.
- S. J. Kwon, F. R. F. Fan and A. J. Bard, J. Am. Chem. Soc., 2010, 132, 13165 CrossRef CAS.
- S. J. Kwon, H. Zhou, F.-R. F. Fan, V. Vorobyev, B. Zhang and A. J. Bard, Phys. Chem. Chem. Phys., 2011, 13, 5394 RSC.
- Y. G. Zhou, N. V. Rees and R. G. Compton, Angew. Chem., Int. Ed., 2011, 50, 4219 CrossRef CAS.
- N. V. Rees, Y. G. Zhou and R. G. Compton, ChemPhysChem, 2011, 12, 1645 CrossRef CAS.
- Y. G. Zhou, N. V. Rees, J. Pillay, R. Tshikhudo, S. Vilakazi and R. G. Compton, Chem. Commun., 2012 10.1039/c1cc16407d.
- A. Kolics, A. E. Thomas and A. Wieckowski, J. Chem. Soc., Faraday Trans., 1996, 92, 3727 RSC.
- M. A. Dias, G. H. Kelsall and N. J. Welham, J. Electroanal. Chem., 1993, 361, 25 CrossRef.
- B. S. Brook, M. I. Pozina and E. I. Rozenfel'd, Zh. Analit. Khim., 1979, 34, 1095 Search PubMed.
- M. Giovanni and M. Pumera, Electrochem. Commun., 2011, 13, 203 CrossRef CAS.
- Y. G. Zhou, N. V. Rees and R. G. Compton, Chem. Phys. Lett., 2011, 514, 291 CrossRef CAS.
- Y. G. Zhou, N. V. Rees and R. G. Compton, ChemPhysChem, 2011, 12, 2085 CrossRef CAS.
- Y. G. Zhou, N. V. Rees and R. G. Compton, Chem. Phys. Lett., 2011, 511, 183 CrossRef CAS.
- I. J. Cutress, N. V. Rees, Y. G. Zhou and R. G. Compton, Chem. Phys. Lett., 2011, 514, 58 CrossRef CAS.
| This journal is © The Royal Society of Chemistry 2012 |
