The near infrared absorption properties of W18O49†
Chongshen
Guo
*,
Shu
Yin
,
Qiang
Dong
and
Tsugio
Sato
Institute of Multidisciplinary Research for Advanced Materials, Tohoku University, 2-1-1 Katahira, Aoba-ku, Sendai, 980-8577, Japan. E-mail: bigguop@mail.tagen.tohoku.ac.jp; Fax: +81 222175598
First published on 5th March 2012
Abstract
The urchin-like W18O49 nanoparticles showed high transparency in the visible region, strong absorption of near-infrared light and instantaneous conversion of the absorbed photo-energy to local heat.
In the past decades, tungsten suboxides (WO3−x) nanomaterials have been intensively investigated because they possess distinctive physical and chemical properties, which allow them to be effective candidates in various applications, such as field-emission performance,1,2 photocatalysts,3 gas sensors,4 electrochromic devices,5,6etc. Among them, W18O49 is one of the most investigated due to its unusual defect structures and promising properties. Furthermore, monoclinic W18O49 with the largest oxygen deficiency in the WO2.625–WO3 range is reported as the only oxide that can be isolated in a pure form, which is not the case for the other tungsten suboxides (WO3−x).7 In the recent years, there has been a strong desire to shield the near-infrared (NIR: wavelength of 780 to 2500 nm) radiation (heat rays) by employing a transparent coating on the windows of automobiles, buildings, etc., in order to reduce the energy consumption for air conditioning and thereby decrease the emission of carbon dioxide. For this application, the most active and important element is the absorber, which should provide excellent absorption of NIR rays as well as high visible light transparency.8 In previous works, we found that tungsten bronze compounds consisting of mixed valence tungsten ions, such as W6+ and W5+, showed excellent NIR shielding properties when dispersed as nanoparticles.8 Since W18O49 also consists of mixed valence tungsten ions, it is expected to show NIR shielding ability.
In this work, the W18O49 hollow urchins were synthesized by solvothermal reaction. Typically, 0.264 g W(CO)6 was dispersed in 50 ml absolute ethanol, and then the mixture was transferred into a 100 ml Teflon-lined autoclave, heated at 200 °C for 24 h, and cooled to room temperature naturally. To promote the diffusion of reaction species, the autoclave was rotated at 125 rpm during the reaction.
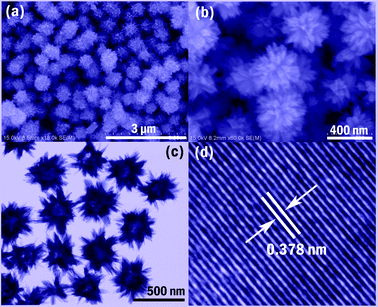
Fig. 1(a) and (b) show typical SEM images of an as-prepared sample at different magnifications. It can be seen that the blue powder of W18O49 consists of numerous homogenous nanospheres with diameter 300–400 nm (see Fig. 1a). Fig. 1b shows that the surfaces of these particles are covered with many nanorods, while the whole particle exhibits an urchin-like morphology. From the TEM image shown in Fig. 1c, the product is seen to possess hollow inner spaces from which the nanorods grow out. A HR-TEM image performed on a selected area of a W18O49 nanosphere is shown in Fig. 1d, and the interplanar spacing determined to be 0.378 nm agrees well with that of the (0 1 0) plane of a monoclinic W18O49 crystal, indicating that the growth direction is along the (0 1 0) plane.
The XRD spectra of the sample (see Fig. 2a) shows that the reflection peaks can be indexed well to the phase of monoclinic W18O49. However, since the tungsten-related oxides have tens of crystal structure types which show similar XRD profiles, XRD results are not enough to prove that the sample is the pure phase of monoclinic W18O49. The Raman technique was considered to be a powerful tool for distinguishing the different phases of tungsten oxides, especially for tungsten suboxides.9 Although some reduced WO3−x phases are also Raman active, they exhibit a quite different Raman signal from that of W18O49.9 A representative Raman spectra of a sample is shown in Fig. 2b. The low wavenumber region of the Raman spectra includes three main peaks at 106, 131, and 259 cm−1, respectively. The bands at 106 and 137 cm−1 belong to the W–O–W bending modes, while 259 cm−1 belongs to O–W–O bending modes in the crystal structures of W18O49. The Raman band in the high wavenumber region includes peaks at 702 and 803 cm−1, which can be attributed to the W–O stretching modes.10 Overall characteristics of the Raman spectra agree well with reported ones.9,10 Together with XRD and HRTEM results, we can conclude that the prepared sample possesses a pure phase of W18O49.
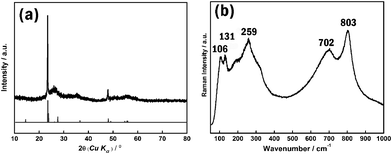 | ||
| Fig. 2 (a) XRD and (b) Raman spectra of as-synthesized W18O49. | ||
The elemental valence of the as-synthesized W18O49 nanocrystal was examined by X-ray photoelectron spectroscopy (XPS). A complex energy distribution of W4f photoelectrons was obtained as shown in Fig. 3. The W4f core-level spectrum could be fitted to three spin-orbit doublets, associated with three different oxidation states of W atoms. The main peaks, having a W4f5/2 at 37.8 eV and a W4f7/2 at 35.7 eV, are attributed to the W atoms in the 6+ oxidation state. The second doublet with a lower binding energy at 34.6 eV and 36.7 eV results from the emission of W4f5/2 and W4f7/2 core levels from the atoms in the oxidation state of 5+. Furthermore, the third doublet observed at 33.7 eV and 335.8 eV corresponds to the W4+ oxidation state. These three oxidation states were typically found in W18O49 nanomaterials reported previously.11,12 We also performed the XPS measurement after sputtering treatment, which provides more chemical information on the inner part of the sample. By this way, the atomic ratio of O/W was determined as 2.7, which also matches the chemical composition of W18O49 and further confirms that the sample is a pure phase of W18O49.
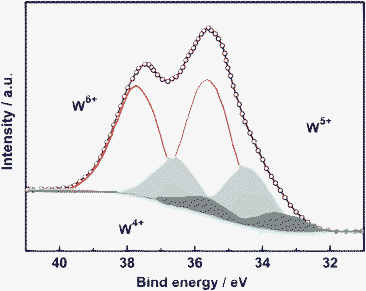 | ||
| Fig. 3 Deconvoluted XPS spectra of W4f core-level with peaks corresponding to W6+, W5+ and W4+ oxidation states. | ||
For the optical test, the samples were coated on quartz glass using an applicator after mixing the as-obtained powder with a Vis-NIR light transparent binder (Collodion–ethanol mixture). Fig. 4 shows the transmittance and reflectance spectra of films coated by different samples. Tungsten trioxide (WO3) possesses a wide band gap of 2.62–3.0 eV, being transparent in the visible and NIR light range (Fig. 4a). In contrast, the bulk W18O49 shows nearly the same transparency for both near infrared and visible light, indicating there is no selective shielding performance of NIR light (Fig. 4b). In addition, when the urchin-like W18O49 particles were used, the best optical properties as a solar filter were obtained, i.e., it achieved high transmittance (about 65%) in the visible region as well as nearly 85% of NIR light shielding ability. On the other hand, the value of 100-T (%) should be the sum of absorption A (%) and reflectance R (%) of light, where T (%) is transmittance. It can be seen that the reflectance light on urchin-like W18O49 nanoparticles (dashed line) is quite limited in the whole wavelength range, indicating that the shielding of NIR light by W18O49 is mainly caused by the absorption of light.
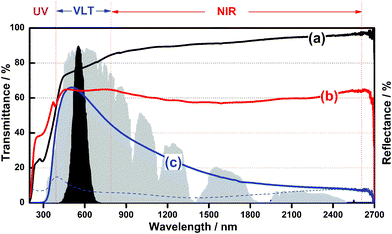 | ||
| Fig. 4 Transmittance spectra of (a) WO3, (b) bulk W18O49, (c) W18O49 of this work; dashed line shows the corresponding reflectance spectra of W18O49 nanospheres .The black and gray areas indicate the normalized value of the luminous efficiency function and energy wavelength distribution of the solar spectrum at sea level. | ||
Until now, several theories were proposed to give explanations on the mechanism of NIR absorption by the tungsten oxides. Among them, intervalence charge transfer (IVCT)13 and small polaron absorption14 theories are the most widely accepted models. In both cases, the NIR shielding is thought to be closely related to the free electrons and oxygen deficiencies inducing small polarons. In the case of disordered films consisting of amorphous or small nanocrystals of tungsten oxides, where the excess electrons are localized and lattice distortions are present, small polarons are formed when excess electrons polarize their surrounding lattice, and localization of the wavelength function takes place essentially at the lattice site. A small overlap occurs between wave functions corresponding to adjacent sites. The absorption of near-infrared light results from polaron transfer by hopping between two neighboring non-equivalent W sites, denoted as A and B, as follows:
| hν + W5+(A) + W6+(B) → W6+(A) + W5+(B) + Ephonon |
Of course, the absorption band on the basis of small polaron transitions also includes polaron hopping between the W5+ and W4+ states.15
Since the W18O49 hollow-urchins exhibit strong absorption of NIR light, it is expected to convert the absorbed radiation to local heat directly. To investigate the photo-thermal conversion properties of W18O49 nanocrystals, a powder sample of W18O49 was put on paper, and then irradiated by a 50 W halogen lamp for 10 seconds. The temperature distribution was recorded by thermographic analysis. Fig. 5 (inset) shows an initial image of the powder on the paper. The measurement was performed at an ambient temperature of 21 °C. Within only 10 seconds, the temperature of the powder increased from 21 to 32.5 °C, whereas the temperature of the paper around the sample did not change very much (Fig. 5), indicating the quick conversion of absorbed NIR light energy to local heat energy on the W18O49 material.
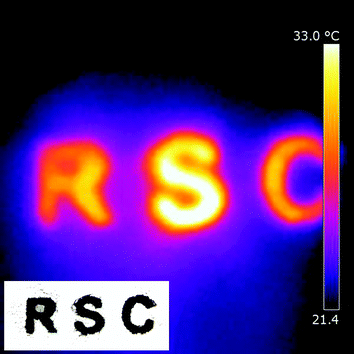 | ||
| Fig. 5 Thermographic image of a W18O49 sample on paper. The sample was irradiated by a 50 W halogen lamp for 10 seconds. Inset shows the initial shape of W18O49 powder on the paper. | ||
In summary, the urchin-like W18O49 has been synthesized by a solvothermal method. Our experimental results clearly emphasize that the as-prepared W18O49 material can selectively absorb near infrared light, while transmitting visible light. Also, W18O49 exhibits an instantaneous conversion of the absorbed photo-energy to local heat.
Acknowledgements
This research was supported in part by the Management Expenses Grants for National Universities Corporations from the Ministry of Education, Culture, Sports and Science for Technology of Japan (MEXT), and by the Adaptable and Seamless Technology transfer Program through target-driven R&D, JST, and Grant-in-Aid for Science Research (No. 23241025).References
- Y. Li, Y. Bando and D. Goldberg, Adv. Mater., 2003, 15, 294 Search PubMed.
- F. Liu, F. Y. Mo, S. Y. Jin, L. Li, Z. S. Chen, R. Sun, J. Chen, S. Z. Deng and N. S. Xu, Nanoscale, 2011, 3, 1850 RSC.
- F. Kojin, M. Mori, T. Morishita and M. Inagaki, Chem. Lett., 2006, 35, 388 CrossRef CAS.
- O. Y. Khyzhun and Y. M. Solonin, Powder Metall. Met. Ceram., 2000, 39, 287 CrossRef CAS.
- J. Thangala, Z. Chen, A. Chin, C. Z. Ning and M. K. Sunkara, Cryst. Growth Des., 2009, 9, 3177 CAS.
- K. Hong, M. Xie, R. Hu and H. Wu, Appl. Phys. Lett., 2007, 90, 173121 CrossRef.
- M. Remškar, J. Kovac, M. Viršek, M. Mrak, A. Jesih and A. Seabaugh, Adv. Funct. Mater., 2007, 17, 1974 CrossRef.
- (a) C. S. Guo, S. Yin, P. L. Zhang, M. Yan, K. Adachi, T. Chonan and T. Sato, J. Mater. Chem., 2010, 20, 8227 RSC; (b) C. S. Guo, S. Yin, K. Adachi, T. Chonan and T. Sato, Mater. Sci. Eng., 2011, 18, 032014 Search PubMed; (c) C. S. Guo, S. Yin, M. Yan and T. Sato, J. Mater. Chem., 2011, 21, 5099 RSC; (d) C. S. Guo, S. Yin and T. Sato, Nanosci. Nanotechnol. Lett., 2011, 3, 413 CrossRef CAS; (e) C. S. Guo, S. Yin, L. J. Huang and T. Sato, ACS Appl. Mater. Interfaces, 2011, 3, 2794 CrossRef CAS; (f) C. S. Guo, S. Yin, L. J. Huang, L. Yang and T. Sato, Chem. Commun., 2011, 47, 8853 RSC; (g) C. S. Guo, S. Yin, Y. F. Huang, Q. Dong and T. Sato, Langmuir, 2011, 27, 12172 CrossRef CAS.
- D. Y. Lu, J. Mater. Res., 2008, 23, 402 CrossRef CAS.
- D. Y. Lu, J. Chen, J. Zhou, S. Z. Deng, N. S. Xu and J. B. Xu, J. Raman Spectrosc., 2007, 38, 176 CrossRef CAS.
- S. Jeon and K. J. Yong, Nanotechnology, 2007, 18, 1 CrossRef.
- G. Leftheriotis, S. Passacantando, P. Yianoulis and A. Siokou, Thin Solid Films, 2001, 384, 298 CrossRef CAS.
- B. W. Faughnan, R. S. Crandall and P. M. Heyman, RCA ReV., 1975, 36, 177 CAS.
- D. Emin, Phys. Today, 1982, 35, 34 CrossRef CAS.
- S. H. Lee, H. M. Cheong, C. E. Tracy, A. Mascarenhas, A. W. Czanderna and S. K. Deb, Appl. Phys. Lett., 1999, 75, 1541 CrossRef CAS.
Footnote |
| † Electronic supplementary information (ESI) available: Detailed information about the characterization. See DOI: 10.1039/c2ra01366e |
| This journal is © The Royal Society of Chemistry 2012 |

