A comparative study on in vitro enzymatic degradation of poly(glycerol sebacate) and poly(xylitol sebacate)
Qizhi
Chen
*,
Xueyuan
Yang
and
Yuan
Li
Department of Materials Engineering, Monash University, Clayton, Victoria, 3800, Australia
First published on 20th March 2012
Abstract
Poly(glycerol sebacate) (PGS) is a soft elastomer suitable for tissue engineering of soft types. However, the rapid degradation kinetics of this polyester has become one of the major drawbacks in the application of tissue engineering. In this work, a comparative study on in vitro enzymatic degradation of PGS- and poly(xylitol sebacate) (PXS)-based materials has been conducted, using a recently established in vitro experimental protocol. This protocol, which can simulate and predict in vivo enzymatic degradation kinetics of polymer implants, was further refined in this work. The comparative study was conducted in tissue culture medium and a buffer solution of pH optima, under static and cyclic mechanical loading conditions. It was found that in vitro enzymatic degradation rates of the PXS-based materials were significantly slower than those of PGS in both the tissue culture medium and buffered solution of pH optima (pH 8). The in vitro enzymatic degradation of PGS-based biomaterials tested was about 0.1–0.4 mm month−1 in tissue culture medium, while the rates were in the range of 0.05–0.2 mm month−1 for PXS-based materials. Enzymatic degradation was enhanced in relation to mechanical deformation, whereas PXS-based materials were influenced little. Hence, PXS, which is as soft as PGS but degrades significantly slower than PGS, is a better option for applications in tissue engineering of soft types.
Introduction
Poly(polyol sebacate) (PPS) is a family of crosslinked polyester elastomers, recently developed for medical applications by Langer's group at MIT1,2 and subsequently further explored by a few other research groups.3–11 Polyol and sebacic acid are both endogenous monomers found in human metabolites.12–14 Hence, it is not a surprise that PPSs generally have little toxicity to the host body.15 PPSs, which contain hydrolysable bonds (e.g., ester bonds), can be degraded by hydrolysis, a reaction that can be catalyzed by biological enzymes. In an in vitro study,16 poly(glycerol sebacate) (PGS) was reported to degrade up to 11–23% (in terms of weight loss) after 60 days agitation in phosphate buffer solution (PBS) at 37 °C. Similar degradation kinetics were also reported by Liang et al., who found that the weight loss of PGS and PGS–Bioglass® composites was around 10–25% after 60 days incubation in a standard tissue culture medium.9 However, the above in vitro degradation rates of PGS-based materials are inconsistent with the degradation kinetics of PGS in vivo. Wang et al. report that PGS is completely resorbed after 60 days implantation in rats.15 This comparatively faster degradation rate of PGS in vivo was also reported by Stuckey et al., who used PGS sheets as a pericardial heart patch.17 They found that the PGS patch was completely resorbed in 6 weeks. These examples of in vivo degradation indicate that aqueous enzymatic action, combined with dynamic tissue movements and vascular perfusion, might enhance the enzymatic breakdown of ester bonds in PGS and thus facilitate the hydrolytic weakening of this material in vivo. In brief, PGS is a rapidly degrading polymer. The rapid degradation is believed to limit its application as a scaffold material in engineering tissues that have a healing rate of several months or years (e.g., cardiac muscle). Whether the rapid degradation also occurs with other members of PPSs, such as poly(xylitol sebacate) (PXS), is still an open question.18Although enzymes are generally designed for highly specific interactions with particular biological substrates, some appear capable of recognizing and acting on synthetic substrates such as polyesters and polyurethanes. Smith et al.19 found that enzymes are capable of altering polymer structure, and those containing ester groups can be degraded by hydrolysis, a reaction that can be catalyzed by biological enzymes. The role of locally produced enzymes in the biodegradation of polymeric materials has been investigated for a number of clinically approved materials: e.g., poly(lactic acid),20–22 poly(glycolic acid),23 polyglactin 910,24 polystyrene,25 polypropylene,26 poly(methylmethacrylate), poly(ethyleneterephthalate and Nylon®,21 and poly(ether urethanes).27,28
In general, two classes of enzymes are primarily involved in the in vivo degradation of polyester implants. The first group is hydrolases, including phosphatases, esterases, and aminopeptidases, named after the side groups they cleave. These enzymes are predominantly lysosomal in origin, secreted mainly by macrophages and lymphoblast giant cells, white blood cells that infiltrate healing tissues. The second class of enzymes is represented by the oxidoreductases, which cause further hydrolytic breakdown, mainly acting on hydroxyl groups.29 While the effects of these enzymes on polymeric biomaterials remain controversial, the enzymatic effect of esterase on the degradation of polyester polymers has been consistently reported in vitro.21,28,29In vivo, esterase has also been reported to be the primary enzyme responsible for the degradation of polymeric implants.30–32 Hence, esterase was the choice of enzyme in this work.
Most recently, the research group of the present authors has established an in vitro enzymatic degradation protocol that is able to simulate and quantitatively capture the features of in vivo degradation of PGS-based materials.33 In their previous study, PGS and PGS–Bioglass® composites were subject to enzymatic degradation in tissue culture medium or a buffer solution at the pH optima, in the presence of defined concentrations of an esterase. The in vitro enzymatic degradation rate of PGS-based biomaterials crosslinked at 125 °C for 2 days was approximately 0.6–0.9 mm month−1 in tissue culture medium, which falls within the range of in vivo degradation rates (0.2–1.5 mm month−1) of PGS crosslinked in similar conditions. This protocol will be further refined in the present work for better cost-effectiveness. The primary object of this work is to comparatively investigate the in vitro enzymatic degradation of PGS- and PXS-based biomaterials in the presence of esterase, using a modified protocol, exploring possible slow degradation kinetics in this soft elastomer family of PPSs.
Results and discussions
Crosslink density of PPS-based materials
At low strains, Young's modulus E is linearly proportional to strand density of chemically crosslinked elastomers (i.e., E = 3νRT, where R is the universal gas constant, T is absolute temperature, and ν is the strand density).34 Hence, Young's modulus at low strains can be used to indicate the level of crosslink density (Fig. 1a and c). Strand density was also directly measured using the swelling technique (Fig. 1b and d). The data of Young's modulus and strand density consistently showed that the number of crosslinks in the PGS increased relatively rapidly during the first 4 days heat treatment at 125 °C (Fig. 1a and b), which was followed by a nearly saturated plateau afterwards. A similar crosslink profile was also observed in PXS when treated for crosslinking at 130 °C (Fig. 1c and d), but at a relatively slower kinetics. In PXS, the saturated value of strand density was reached after treatment at 130 °C for 9 days. In both PGS and PXS, the saturated value of strand density was ∼230 mol m−3. It is interesting to note that the Young's moduli of PGS and PXS are virtually the same, with a maximal value of ∼2 MPa. However, the stretchability of PXS is better than PGS. The strain at rupture was ∼150% with PXS, whereas ∼60% with PGS. Since the aim of this work was to compare enzymatic degradation behaviours of PGS and PXS due to their chemical nature, rather than the crosslink density in the network, it is essential to conduct the experiment with PGS and PXS that have similar crosslink densities if identical densities are not possible. Hence, the PGS- and PXS-based materials used in this work were both fully crosslinked, and were treated at 125 °C for 7 days and 130 °C for 12 days, respectively—a duration longer than required in order to be on the safe side.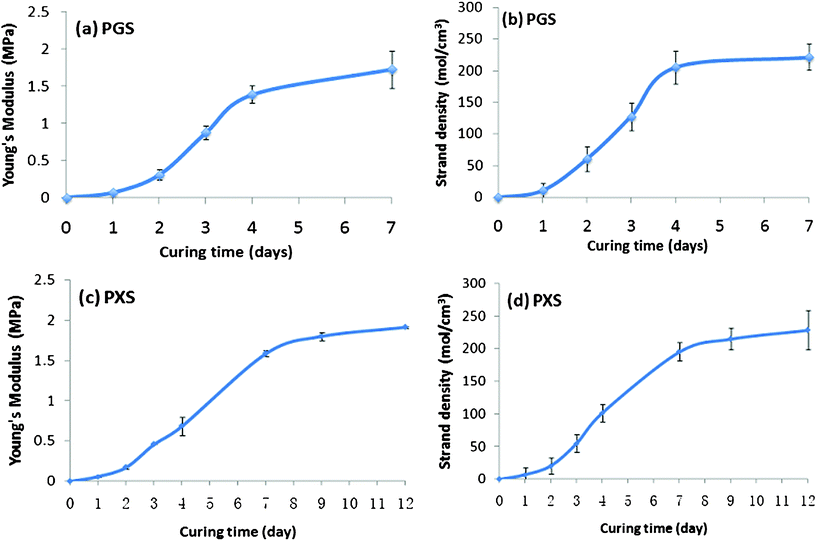 | ||
| Fig. 1 Young’s modulus and strand density of (a)–(b) PGS and (c)–(d) PXS versus curing time. | ||
Modification of enzyme concentration
In the authors' previous work,33 the concentration of 0.625 unit esterase per mg polymer was used in the enzymatic degradation experiments. However, SEM examination has revealed the non-dissolved esterase crystals on the surface PGS polymer samples (Fig. 2a). Since non-dissolved enzyme crystals do not participate the enzymatic activity, Fig. 2a indicated that 0.625 units mg−1 concentration was unnecessarily higher than the required saturated concentration. It must be noted that the cost of esterase is high, and it is necessary to reduce the cost. To find the saturated concentration, we have examined a series of enzyme concentrations in the range of 0.10–0.625 units esterase per mg. It was found that the concentration could be reduced to about half (i.e., 0.3 units esterase per mg), while tiny esterase crystals were still visible on the polymer surface 2 days after addition (Fig. 2b), which indicated the saturated concentration of the enzyme.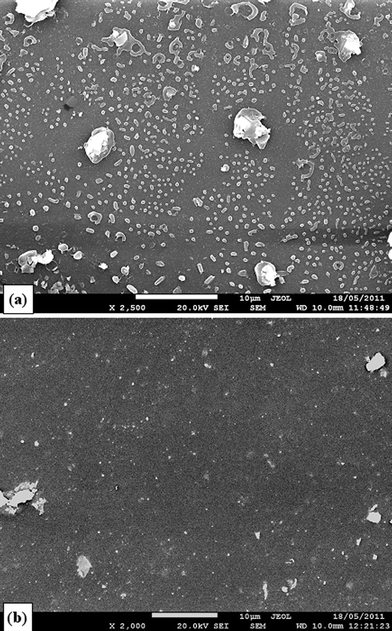 | ||
| Fig. 2 SEM images of crystalline esterase, 2 days after being added in tissue culture medium. The concentration of esterase is (a) 0.625 and (b) 0.3 units esterase per mg polymer, which are equivalent to 3 or 1.5 units esterase per mm2, respectively, in the present work. | ||
Furthermore, enzyme-mediated degradation is primarily surface rather than bulk degradation. Hence, we believe that the concentration of enzyme per unit area sample should be used as an indicator of enzyme concentration in this work. The disc samples used in this work were 11 mm in diameter (equivalent to an area of 95 mm2), ∼0.5 mm in thickness, and weighted ∼0.5 g. Hence, 0.3 units esterase per mg is equivalent to ∼1.5 units esterase per mm2.
The enzyme degradation data has proved that the above newly designed enzyme concentration (∼1.5 units esterase per mm2) works as efficiently as the high concentration used in our previous work (Fig. 3). There were no significant differences (p > 0.05) for any pair of data in Fig. 3. Hence, the concentration of 0.3 units esterase per mg polymer (or 1.5 units esterase per mm2 in the case where samples have a vastly different thickness or do not fully cover the tissue culture wells under the dynamic culture conditions) was used in subsequent experiments.
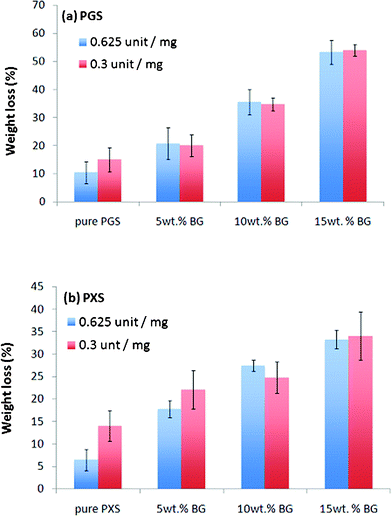 | ||
| Fig. 3 Weight loss of (a) PGS- and (b) PXS-based materials during soaking with addition of esterase being either 0.625 or 0.3 units per mg, which are equivalent to 3 or 1.5 units esterase per mm2, respectively, in the present work. | ||
Comparison of enzymatic degradation in the culture medium and buffer solution
A comparison of Fig. 4a with 4b, and Fig. 5a with 5b, reveals three degradation kinetics of the PPS materials in these two solutions, which are described as follows: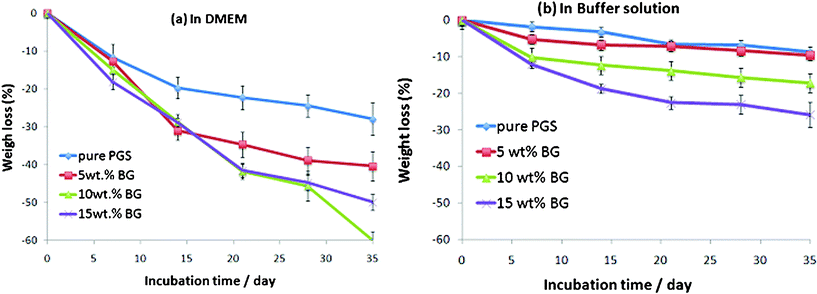 | ||
| Fig. 4 Percentage weight change of PGS and PGS/5-15 wt% Bioglass® composites after incubation at 37°C in the (a) tissue culture medium DMEM, and (b) buffer solution with the addition of esterase (0.3 units enzyme per mg biomaterial) for up to 35 days. The materials were pre-polymerised at 125 °C for 24 h and treated for cross-linking at 125 °C for 7 days. | ||
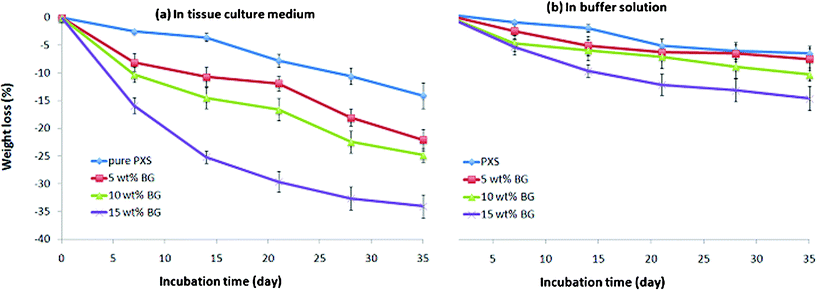 | ||
| Fig. 5 Percentage weight change of PXS and PXS/5-15 wt% Bioglass® composites after incubation at 37 °C in the (a) tissue culture medium DMEM, and (b) buffer solution with the addition of esterase (0.3 units enzyme per mg biomaterial) for up to 35 days. The materials were pre-polymerised at 150 °C for 8 hr and treated for cross-linking at 130 °C for 12 days. | ||
(a) The degradation rates of the tested materials are collectively faster in the culture medium (Fig. 4a and 5a) than in the buffered solution (Fig. 4b and 5b).
(b) The degradation rate of pure PPS polymers was generally slower than their PPS–Bioglass® composites in both the culture medium and buffer solution with esterase.
(c) For the composites, the weight loss percentage of specimens increased with increased amounts of Bioglass® in the buffer solution. However, the same trend could not be drawn from the culture medium groups.
The above results are in agreement with previous work.33
Comparison of enzymatic degradation of PGS- with PXS-based materials
Compared with PGS-based materials, the PXS-based materials degraded significantly slower in both tissue culture medium and buffer solution (Fig. 6). After incubation for 35 days, the weight loss percentages of PXS-based materials were approximately half of those of PGS and its composites. The degradation of PPS is a hydrolysis process, which is the reverse process of polymerisation. Hence, the interpretation of the degradation kinetics is directly associated with the polymerisation (including crosslinking) kinetics of the system, as discussed below. | ||
| Fig. 6 Percentage weight change of (a) PGS and PGS/5-15 wt% Bioglass® composites and (b) PXS and PXS/5-15 wt% Bioglass® composites after incubation at 37 °C in the tissue culture medium DMEM and buffer solution with the addition of esterase (0.3 units enzyme per mg biomaterial) for 35 days. | ||
The polymerisation of sebacic acid and polyol monomers primarily starts with the reaction of carboxylic groups of sebacic acid with primary (at the two ends) –OH groups of polyol (Fig. 7a). The crosslink between polymer chains is predominantly caused by the reaction of carboxylic groups of sebacic acid with secondary or tertiary (at the middle positions) –OH groups of polyol, as illustrated in Fig. 7b and c. The primary –OH groups react faster than the secondary ones at 120–150 °C, such that the pre-polymerisation process is dominated by the formation of PPS polymer chains. The crosslinking process, which involves the secondary –OH groups, becomes prominent when there is a severe lack of primary –OH groups in the reactant microenvironment.
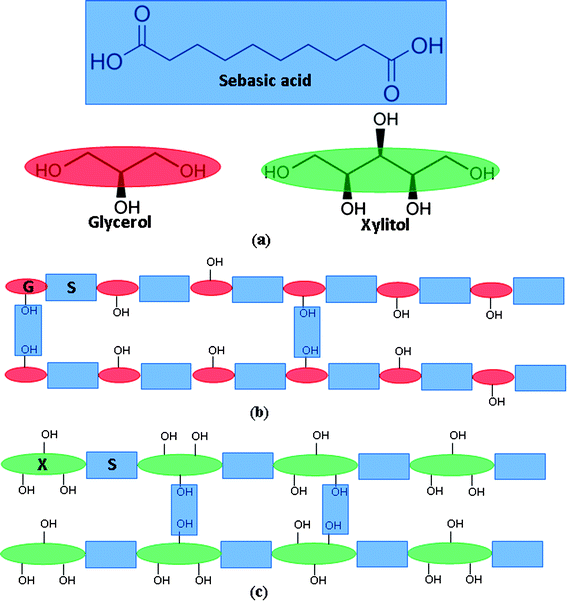 | ||
| Fig. 7 (a) Monomers of sebacic acid, glycerol, and xylitol. Schematic illustrations of (b) PGS and (c) PXS network. | ||
The crosslinking kinetics of PPS are influenced by the motion of monomers and the diffusion of water molecules in the polymer network. Xylitol, with 5 –OH groups, has a poor ability to diffuse compared to glycerol, with 3 –OH groups, which is one of the major reasons for the slow polymerisation kinetics of PXS. In addition, the number of –OH groups, which form barriers to the diffusion of water, is three times higher in the PXS network than in the PGS network. This is another primary reason for the slow crosslinking kinetics of PXS system, as slow removing of condensed-out water molecules from the reactant regions will retard further esterification reactions.
During the hydrolysis process, the reaction rate is influenced by the availability of water around each ester bond. Hence, the diffusion rate of water molecules in the polyester network directly determined the hydrolysis reaction in it. Compared with PGS (Fig. 7b), the higher number of –OH groups in the PXS network forms a larger number of barriers to the diffusion of water molecules (Fig. 7c). As a result, the hydrolysis reaction of PXS is slower than that of PGS. The above interpretation remains to be proved.
Degradation manner: surface layer-by-layer
The reduction in thickness of specimens was measured and found to be in similar percentages to their weight loss (Fig. 8) for both materials systems and in the both media. The reduction rates of pure PGS and PXS in thickness, for example, were about 0.1 and 0.05 mm month−1 (i.e. 20 and 10%) in tissue culture medium, which was consistent with the percentage of weight loss of these two polymers (Fig. 4a and 5a). This indicates that the enzymatic degradation was primarily surface layer-by-layer. | ||
| Fig. 8 Percentage thickness change of PGS- and PXS-based materials after incubation at 37 °C in (a) the tissue culture medium DMEM and (b) buffer solution with the addition of esterase (0.3 units enzyme per mg biomaterial) for 35 days. | ||
The reduction rates of PGS-based biomaterials tested was about 0.1–0.4 mm month−1 in tissue culture medium (Fig. 4a), while the rates were in the range of 0.05–0.2 mm month−1 for PXS-based materials (Fig. 5a). These rates are significantly lower than those of PGS crosslink treated at 125 °C for 2 days,33 which indicates the considerable influence of crosslink density of a polymer network on the degradation kinetics of the polymer.
The layer-by-layer mechanism is also supported by Fig. 9, which demonstrates peeling-off films of degradation products on the surface of samples that were not manually wiped carefully. Since enzymatic complexes may have limited diffusion into a crosslinked polymer network, it is not surprising that enzyme-assisted degradation of PPSs occurs predominantly through surface erosion. This has been indicated by steady and linear mass loss, similarity between percent size reduction and the percent weight loss,33 and preservation of implant geometry.35 Hence, the degradation rate of a bulk material could be influenced by the surface area per mass of the medical device. Pores were observed in the polymers, they could have an effect on the surface area of PPS polymers and thus degradation rates. This influence was likely similar in the PGS and PXS sheets which were formed under similar casting conditions.
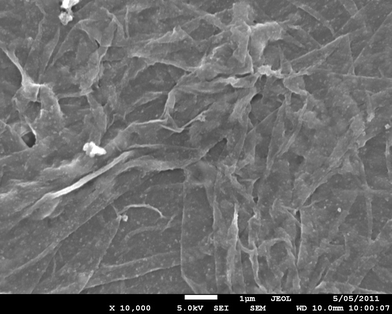 | ||
| Fig. 9 SEM image showing the peeling-off films as the degradation product of PGS. | ||
Enzymatic degradation of PPS-based polymers under cyclic loading
Soft tissues such as heart muscle, tendons, and ligaments typically work under cyclic mechanical conditions. Hence, it is necessary to assess the degradation rate of an implant in a mechanically cyclic environment. This forms the primary objective of the research work described in this study. Fig. 10 illustrates the percentage weight loss of the PGS- and PXS-based materials. It was unexpectedly found that the mass loss of PXS remained at the same level as those at the static tissue culture condition (Fig. 6), whereas the degradation of the same PGS was accelerated by the cyclic loading compared to the degrading profile at the mechanical loading-free condition (Fig. 6), which is in agreement with previous work.33 | ||
| Fig. 10 Percentage weight loss of PGS- and PXS-based materials after incubation at 37 °C in (a) the tissue culture medium DMEM and (b) buffer solution with the addition of esterase (0.3 units enzyme per mg biomaterial) for 35 days under dynamic culture condition. | ||
SEM examination on the surface of the two groups of materials revealed more cracks on PGS (Fig. 11a) than on PXS (Fig. 11b) samples. It is possible that the better stretchability of PXS results in less damage during mechanical loading, and the better mechanical integrity might be responsible for the nearly unchanged degradation kinetics. We concede that this question remains open, and further work is needed in order to understand the phenomenon.
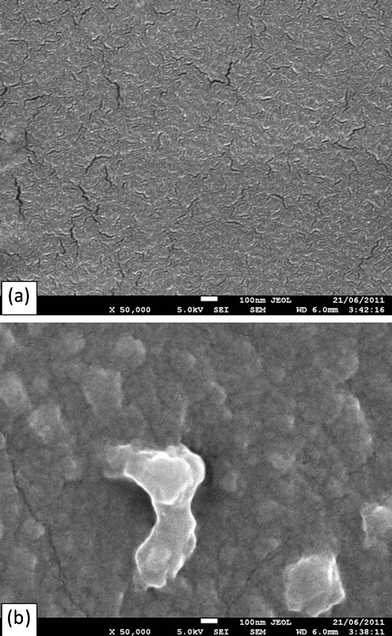 | ||
| Fig. 11 SEM image showing microcracks on the surface of (a) PGS and (b) PXS samples, after incubation for 35 days under dynamic culture conditions. | ||
Change in pH value in culture medium and buffer solution
The pH of the medium has a great influence on both the enzymes’ activity and the hydrolytic degradation rate of polymers. Hence, it is essential to monitor the pH values of the medium during the enzymatic degradation. These results are illustrated in Fig. 12. The pH values in the esterase-containing solution soaking the biomaterials remained close to the biomaterial-free buffer solution (pH = 8) throughout the degradation test, varying within 0.5 pH units (Fig. 12a and b). In contrast, the acidification of the esterase-containing culture medium incubated with the biomaterials was observed. In the tissue culture medium soaked with the PGS- and PXS-based materials, the maximal drop of pH values was 2.7 (Fig. 12a) or 2.2 (Fig. 12b) , respectively, at day 2.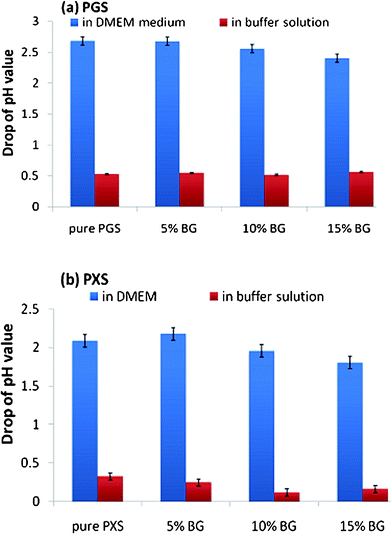 | ||
| Fig. 12 Decrease in pH values in DMEM tissue culture medium and buffer solution after soaking with (a) PGS- and (b) PXS-based material specimens for 2 days. | ||
Experimental
Raw materials
The raw materials of PGS and PXS, glycerol (purity 99%), xylitol (purity 98%) and the diacid sebacic acid (purity 99%), were purchased from Sigma-Aldrich. The filler particles, 45S5 Bioglass®, were purchased from Novabone® Product (LLC-Alachua, Fl 32615 USA). The composition of 45S5 Bioglass® is 45 wt.% SiO2, 24.5 wt.% CaO, 24.5 wt.% Na2O and 6 wt.% P2O5.36 The distribution of particle size of the alkali powder was determined using laser diffraction analysis and analysed by Zeta Plus Particle sizing software Ver. 4.04 (Brookhaven Instruments Corp). The average size of the particles was determined to be 3.1 ± 0.4 μm.Fabrication of PPSs and PPS–Bioglass® composites
The synthetic procedures for PPSs and their composites have been reported previously.9 In brief, the crosslinked PGS and composites were prepared in two stages (Table 1). Initially, a PPS prepolymer was synthesized by polycondensation of 1![[thin space (1/6-em)]](https://www.rsc.org/images/entities/char_2009.gif) :
:![[thin space (1/6-em)]](https://www.rsc.org/images/entities/char_2009.gif) 1 molar ratio of the polyol and the diacid sebacic acid, under nitrogen gas—at this stage, the reaction was incomplete and the prepolymer was still ungelled and could be dissolved in tetrahydrofuran (THF). Four percentages of 45S5 Bioglass® (0, 5, 10 and 15 wt.%) were added to a 50 wt.% solution of the PPS prepolymer in THF solution and magnetically stirred thoroughly. The THF solution/slurry was then cast onto glass slides and the THF evaporated at ambient conditions to produce ∼0.5 mm thick sheets of PPS prepolymer. Finally, the cast sheet was further polymerized for additional days under vacuum to maximize the crosslink density of the final material.
1 molar ratio of the polyol and the diacid sebacic acid, under nitrogen gas—at this stage, the reaction was incomplete and the prepolymer was still ungelled and could be dissolved in tetrahydrofuran (THF). Four percentages of 45S5 Bioglass® (0, 5, 10 and 15 wt.%) were added to a 50 wt.% solution of the PPS prepolymer in THF solution and magnetically stirred thoroughly. The THF solution/slurry was then cast onto glass slides and the THF evaporated at ambient conditions to produce ∼0.5 mm thick sheets of PPS prepolymer. Finally, the cast sheet was further polymerized for additional days under vacuum to maximize the crosslink density of the final material.
| PPS | Pre-polymerisation | Crosslink treatment |
|---|---|---|
| PGS | 125 °C/24 h, N2 gas purge | 125 °C/7 days, vacuum |
| PXS | 150 °C/8 h, N2 gas purge | 130 °C/12 days, vacuum |
Enzymatic degradation of PPS-based biomaterials at static culture conditions
The experiment was conducted using 48-well tissue culture plates. Discs (diameter of 11 mm) of PPS polymer and PPS–Bioglass® composites were punched out of sheet materials to fully cover each well of the tissue culture plates, then weighed (giving a mass m0d) and sterilised with 70% alcohol for 15 min, followed by drying in a tissue culture hood overnight. Tensile testing showed no significant changes in mechanical properties in the above sterilized samples. Each specimen was then soaked in a well filled with either 0.3 ml buffer solution or 0.3 ml culture medium, with the addition of esterase at a designed concentration of esterase. These culture plates were placed in a tissue culture incubator at 37 °C. The buffer solution and culture medium were changed every second day, while the esterase was added every day. After incubation for 7, 14, 21, 28, and 35 days, specimens were removed, wiped carefully by hand to remove degradation debris, washed with water, and thoroughly dried under vacuum at room temperature until no further change in weight was detected (giving a mass mtd); the percentage of weight change was calculated by eqn (1). The thickness of each specimen was also measured. Each experiment was conducted with five specimens.

| (1) |
Enzymatic degradation of PPS-based biomaterials under cyclic culture conditions
The dimensions of specimens were ∼40 mm (length) × 2.5 mm (width) × 0.5 mm (thickness), having ∼100 mm2 of surface area and weighing ∼100 mg. The rectangular specimens of freshly made PPS-based materials were sterilised with 70% alcohol for 15 min followed by drying in a tissue culture hood overnight. Each specimen was then placed in one well of the UniFlex™ tissue culture plate, and fixed tightly by a self-made stainless steel ring11,37 such that it can be stretched synchronously with the culture membrane (the silicone bottom of Flexcell™ culture plate) by the Flexcell™ system. Each well of the culture plates were filled with 5 ml buffer solution with the addition of esterase at a designed concentration of esterase (1.5 units esterase per mm2 of polymer, see Section 3.2.1). The above culture plates were placed on an Artangle™ Loading Station™ and incubated in a 37 °C environment shaker, with the esterase being added every day and the buffer solution being changed every second day. During the 35 days of incubation, specimens were continuously stretched by the Flexcell (FX-4000T™) with a maximum of 10% elongation and at a frequency of 1 Hz, to simulate pulsatile motion induced by heart beats. The elongation of ∼15% was used to simulate muscular tissue, which is the typical tensile strain of heart muscle. Each specimen was removed from the Flexcell™ every 7 days, gently washed with water, and dried in a vacuum oven at room temperature to constant weight. The percentage of weight loss was calculated by eqn (1).pH measurement of specimens immersed in culture medium and buffer solution with esterase
Samples of the buffer solution and the culture medium (containing degradation products from the specimens and enzyme in the latter case), which had been tested as described in Section 2.4.1 were collected at day 2, after which the medium was changed for pH measurement to provide an indication of the degradation products, as has been described previously.8,9 Each sample's pH was measured by insertion of a pH glass electrode (Hanna® Instruments, HI 1230B) attached to a pH meter (Hanna® Instruments, HI 98185) into the solutions, allowing the electrode to stabilize under incubation conditions for each reading. This data was recorded as the difference in pH of the medium with the biomaterials sample compared with the medium alone: pHbiomat − pHbiomat-free.Mechanical tensile testing
Tensile tests were conducted with an Instron Microtester 5848. Testing strips of 12 × 3.5 × t mm3 (t = ca. 0.5 mm) were cut from PPS-based sheet materials. Tests were performed using a cross-head speed of 10 mm min−1 and a loading cell of 100 N. The samples were stretched until rupture.Crosslink density measurement of PPS matrix
Swelling measurements at ambient temperature in THF, which aimed to quantify the crosslink density in the polymers, were made according to previously published methods.38 Briefly, dried and pre-weighed samples were swollen in the THF, the swollen specimens removed from the THF each day and gently dabbed with filter paper to remove surface solvent, followed by weighing in a sealed vial to determine the extent of swelling. When no further weight gain was observed (typically after 3 days of swelling in THF) the specimens were considered to be fully swollen and the mass of the equilibrium swollen network (meq) was determined. The specimens were dried in a vacuum oven at room temperature for one week and weighed again to determine the mass of the dried network (md). The weight swelling percentage was calculated as: | (2) |
The volume fraction of polymer at equilibrium swelling (υ2) was calculated as:
 | (3) |
The Flory–Rehner expression for an affinely-deforming network with trifunctional crosslinking junctions (in this case, the glycerol unit with all three alcohol groups reacted) was used to calculate the network strand density (ν) of the swollen materials:34
 | (4) |
Statistics
All experiments were undertaken with five samples per experimental group, and the data is shown as mean ± standard error (SE). One-way analysis of variance (ANOVA) with Tukey's post-hoc test was performed to analyse the statistical difference, and significance levels were set at a p-value of less than 0.05.Conclusions
We have conducted a comparative investigation on the in vitro enzymatic degradation of PGS- and PXS-based materials, under static and cyclic flexing conditions. We have found that (1) the degradation rates of the PGS- and PXS-based materials are faster in culture medium than in the buffered solution of pH optima, (2) enzymatic degradation of PGS-based biomaterials is faster than PXS-based materials, and (3) mechanical deformation enhances the enzymatic degradation of PGS, but has no significant influence on the PXS-based materials system. Hence, it is concluded that, compared with PGS, PXS is a better candidate for applications in soft tissue engineering, having half the degradation rate of PGS, while having a better mechanical flexibility than PGS.References
- Y. D. Wang, G. A. Ameer, B. J. Sheppard and R. Langer, Nat. Biotechnol., 2002, 20, 602–606 CrossRef CAS.
- C. J. Bettinger, Macromol. Biosci., 2011, 11, 467–482 CrossRef CAS.
- I. S. Tobias, H. Lee, G. C. Engelmayr, D. Macaya, C. J. Bettinger and M. J. Cima, J. Controlled Release, 2010, 146, 356–362 CrossRef CAS.
- C. Fidkowski, M. R. Kaazempur-Mofrad, J. Borenstein, J. P. Vacanti, R. Langer and Y. D. Wang, Tissue Eng., 2005, 11, 302–309 CrossRef CAS.
- C. A. Sundback, J. Y. Shyu, Y. D. Wang, W. C. Faquin, R. S. Langer, J. P. Vacanti and T. A. Hadlock, Biomaterials, 2005, 26, 5454–5464 CrossRef CAS.
- D. Motlagh, J. Yang, K. Y. Lui, A. R. Webb and G. A. Ameer, Biomaterials, 2006, 27, 4315–4324 CrossRef CAS.
- C. L. E. Nijst, J. P. Bruggeman, J. M. Karp, L. Ferreira, A. Zumbuehl, C. J. Bettinger and R. Langer, Biomacromolecules, 2007, 8, 3067–3073 CrossRef CAS.
- Q. Z. Chen, L. Y. Jin, W. D. Cook, D. Mohn, E. L. Lagerqvist, D. A. Elliott, J. M. Haynes, N. Boyd, W. J. Stark, C. W. Pouton, E. G. Stanley and A. G. Elefanty, Soft Matter, 2010, 6, 4715–4726 RSC.
- S. L. Liang, W. D. Cook, G. A. Thouas and Q. Z. Chen, Biomaterials, 2010, 31, 8516–8529 CrossRef CAS.
- Q. Z. Chen, S. L. Liang, J. Wang and G. P. Simon, J. Mech. Behav. Biomed. Mater., 2011, 4, 1805–1818 CrossRef CAS.
- Q. Z. Chen, S. L. Liang and G. A. Thouas, Soft Matter, 2011, 7, 6484–6492 RSC.
- K. C. Ellwood, Am J Clin Nutr, 1995, 62, 1169S–1174S CAS.
- S. S. Natah, K. R. Hussien, J. A. Tuominen and V. A. Koivisto, Am J Clin Nutr, 1997, 65, 947–950 CAS.
- L. Sestoft, Acta Anaesthesiol. Scand., 1985, 29, 19–29 CrossRef.
- Y. D. Wang, Y. M. Kim and R. Langer, J. Biomed. Mater. Res., 2003, 66A, 192–197 CrossRef CAS.
- Y. Wang, G. A. Ameer, B. J. Sheppard and R. Langer, Nat. Biotechnol., 2002, 20, 602–606 CrossRef CAS.
- D. J. Stuckey, H. Ishii, Q. Z. Chen, A. R. Boccaccini, U. Hansen, C. A. Carr, J. A. Roether, H. Jawad, D. J. Tyler, N. N. Ali, K. Clarke and S. E. Harding, Tissue Eng. A, 2010, 16, 3395–3402 CrossRef CAS.
- I. Pomerantseva, N. Krebs, A. Hart, C. M. Neville, A. Y. Huang and C. A. Sundback, J. Biomed. Mater. Res., Part A, 2009, 91A, 1038–1047 CrossRef CAS.
- R. Smith, C. Oliver and D. F. Williams, J. Biomed. Mater. Res., 1987, 21, 991–1003 CrossRef CAS.
- G. E. Visscher, R. L. Robison, H. V. Maulding, J. W. Fong, J. E. Pearson and G. J. Argentieri, J. Biomed. Mater. Res., 1986, 20, 667–676 CrossRef CAS.
- R. Smith, C. Oliver and D. F. Williams, J. Biomed. Mater. Res., 1987, 21, 991–1003 CrossRef CAS.
- D. F. Williams, Eng. Med., 1981, 10, 5–7 CrossRef.
- D. F. Williams and E. Mort, Journal of Bioengineering, 1977, 1, 231–238 CAS.
- T. N. Salthouse and B. F. Matlaga, Surgery Gynecology & Obstetrics, 1976, 142, 544–550 CAS.
- B. S. Oppenheimer, E. T. Oppenheimer, I. Danishefsky, A. P. Stout and F. R. Eirich, Cancer Research, 1955, 15, 333–340 CAS.
- T. C. Liebert, R. P. Chartoff, S. L. Cosgrove and R. S. McCuskey, J. Biomed. Mater. Res., 1976, 10, 939–951 CrossRef CAS.
- J. P. Santerre, D. G. Duguay, R. S. Labow and J. L. Brash in Proteins at interfaces II—fundamentals and applications, ed. T. A. Horbett and J. L. Brash, American Chemical Society, 1995, vol. 602, pp. 352–370 Search PubMed.
- R. Smith, D. F. Williams and C. Oliver, J. Biomed. Mater. Res., 1987, 21, 1149–1165 CrossRef CAS.
- J. M. Schakenraad, M. J. Hardonk, J. Feijen, I. Molenaar and P. Nieuwenhuis, J. Biomed. Mater. Res., 1990, 24, 529–545 CrossRef CAS.
- G. Scott, Degradable polymers: principles and applications, Kluwer Academic Publishers, The Netherlands, 2002 Search PubMed.
- S. H. Hamid, M. B. Amin and A. G. Maadhah, Handbook of polymer degradation, Marcel Dekker, New York, 1992 Search PubMed.
- M. I. Shtilman, Polymeric biomaterials part I polymer implants, VSP BV, The Netherlands, 2003 Search PubMed.
- S.-L. Liang, X.-Y. Yang, X.-Y. Fang, W. D. Cook, G. A. Thouas and Q.-Z. Chen, Biomaterials, 2011, 32, 8486–8496 CrossRef CAS.
- P. J. Flory, Principles of polymer chemistry, Cornell University Press, New York, 1953 Search PubMed.
- Y. Wang, Y. M. Kim and R. Langer, J. Biomed. Mater. Res., 2003, 66A, 192–197 CrossRef CAS.
- A. Stamboulis, L. L. Hench and A. R. Boccaccini, J. Mater. Sci.: Mater. Med., 2002, 13, 843–848 CrossRef CAS.
- Q. Z. Chen, H. Ishii, G. A. Thouas, A. R. Lyon, J. S. Wright, J. J. Blaker, W. Chrzanowski, A. R. Boccaccini, N. N. Ali, J. C. Knowles and S. E. Harding, Biomaterials, 2010, 31, 3885–3893 CrossRef CAS.
- Q.-Z. Chen, A. Bismarck, U. Hansen, S. Junaid, M. Q. Tran, S. E. Harding, N. N. Ali and A. R. Boccaccini, Biomaterials, 2008, 29, 47–57 CrossRef CAS.
| This journal is © The Royal Society of Chemistry 2012 |
