Facile approach to the synthesis of carbon nanodots and their peroxidase mimetic function in azo dyes degradation†
Afsaneh
Safavi
*a,
Fatemeh
Sedaghati
a,
Hamidreza
Shahbaazi
b and
Elaheh
Farjami
a
aDepartment of Chemistry, College of Sciences, Shiraz University, Shiraz, 714541, Iran. E-mail: safavi@ chem.susc.ac.ir; Fax: +98-711-2286008; Tel: 98-711-6137351
bChemistry Department, University of Calgary 2500 Uni. Dr NW, Calgary AB T2N1N4 Canada. E-mail: Hamidreza.shahbaazi@ucalgary.ca
First published on 14th June 2012
Abstract
Carbon nanodots (CDs) were successfully prepared via a one-pot synthesis using microwave-assisted ionic liquid (MAIL) method. Moreover, a novel function of CDs as peroxidase mimetic compounds for azo dyes degradation was introduced.
Fluorescent semiconductor quantum dots (QDs) have created much excitement for their applications in a wide range of biological and chemical studies.1 However, the known toxicity and potential environmental hazard of these materials may severely limit their application. The appearance of photoluminescent (PL) carbon-based nanomaterials has allowed exciting strategies in the search for benign nanoparticles. Carbon nanodots (CDs) are discrete nanoparticles of nearly spherical geometry with semiconductor-like properties. Due to their chemical inertness and biocompatibility, these particles are preferred, over QDs, in biological labeling, biomedicine, optoelectronic devices and sensors.2–6 Based on their reported properties, researchers have been motivated to investigate both the fundamentals and applications of CDs. Recently, helpful reviews were presented on current approaches to the synthesis, functionalization and applications of CDs.7,8
Thermal carbonization of suitable molecular precursors is an attractive approach for the production of CDs.9,10 High-speed synthesis using microwaves (MW) has gained considerable attention in recent years due to the efficient heating of materials using the “MW dielectric heating” effects. Fluorescent CDs have been produced directly via microwave pyrolysis routes with or without using surface passivating reagents.11–14 Recently, Liu and coworkers offered a clean, cheap and suitable route to produce CDs. They used glycerol as the necessary source of carbon and 4,7,10-trioxa-1,13-tridecanediamine (TTDDA) as the surface passivating agent. The authors made an effort to enhance the PL-properties of CDs, and by using a surface passivating reagent, a quantum yield (QY) of about 12.02% was obtained.15 However, synthesis and inherent properties of CDs is still the center of attention. So, producing fluorescent CDs with a high QY and narrow size distribution for practical applications is an interesting challenge causing intensive research efforts.
On the other hand, room temperature ionic liquids (ILs) have found many potential applications such as their role as solvents for ‘green’ organic synthesis due to their non-flammability and non-volatility. Moreover, large positive ions with high polarizability in ILs cause the economic conversion of MW energy into thermal energy.16 As a part of our continuing interest in different applications of ILs17–23 herein, we have developed a new microwave-assisted method for the synthesis of CDs, using IL as the precursor. We have demonstrated that the microwave-assisted IL (MAIL) method is a fast and simple route for the production of a narrow size distribution of CDs with highly intense blue PL without using any surface passivating agent. The novel application of the synthesized CDs as a peroxidase mimetic compound for azo dyes degradation is also explored. In this study, a desired amount (about 50 mg) of IL was placed in a test tube and heated in a microwave oven (power of 450 W) for ∼2 min. Gradually, the IL changed from colorless to yellow, and finally, to dark brown, which signifies the production of CDs (Fig. S1 in the ESI†). It is worth noting that IL acts not only as an excellent medium for absorbing microwaves, but also as a carbon source. Water immiscible ILs are a superior choice for use as primary materials, since they can be separated simply from water-soluble CDs. For this purpose, a water immiscible IL, N-octylpyridinum hexafluorophosphate (OPPF6, m.p. = 65 °C) was chosen, which provided a superior synthetic medium for CDs synthesis in this report. It is well-known that [PF6−] and [BF4−] anions are prone to thermal decomposition producing F− ions.24 Thermal degradation of OPPF6 would produce in situ F− ions during the synthesis of CDs. Therefore, it is expected that an etching process occurs in the solution that results in the formation of nanocrystals with a reduced number of electronic defect sites.25 As shown by the FTIR spectra (Fig. S2a in the ESI†) by analogy to previous work on NaPF626 the broad peak at 835 cm−1 and the peaks at 770, 686 and 559 cm−1 are attributed to PF6− in OPPF6. Clearly, after applying the MW, a significant decrease in the intensity of these peaks was observed (Fig. S2b in the ESI†). This is believed to be the result of thermal decomposition of OPPF6. In addition, similar to other reports,11,13,27 the broad peak centered at 3425 cm−1, and the bands in the range 1000–1300 cm−1, which involve the C–OH stretching and –OH bending vibrations, evidence the existence of large numbers of residual hydroxyl groups. These functional groups enhance the hydrophilicity and stability of the carbon dots in aqueous media. The X-ray photoelectron spectroscopy (XPS) result was also recorded and it is shown that the CDs contain mainly carbon and oxygen (Fig. S3 in the ESI†).
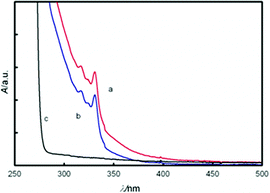
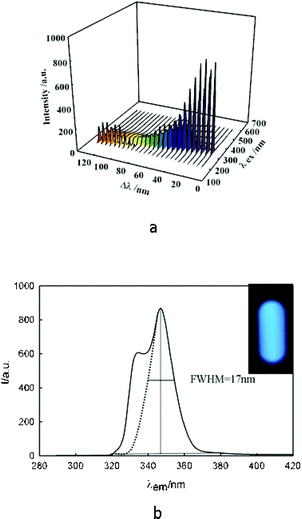
The UV-Vis absorption spectra of CDs (Fig. 1) revealed multi resolved transitions that are due to the effect of quantum confinement.28 Synchronous fluorescence data provide a three-dimensional image (Fig. 2a and Fig. S4 in the ESI†) of their response that exhibits intense and narrow near-band-edge or shallow-trap emissions.29 That the emission is so narrow and the Stokes shift is so small (Δλ = 20 nm) suggests that the surface of these CDs is relatively flat and regular.30 This confirms the previous suggestion that removal of defects occurs during MW preparation of CDs in the presence of F− ions.
 | ||
| Fig. 1 Uv-Vis spectra of CDs solution following, filtration via (a) 0.2 μm filter membrane; (b) 0.02 μm filter membrane; (c) blank (IL) solution. | ||
 | ||
| Fig. 2 (a) 3D synchronous PL responses of CDs solution; (b) synchronous PL of CDs solution in Δλ = 20 nm. Inset shows PL photo of a CD solution illuminated by a UV lamp. | ||
It is obvious that the narrower the distribution of the size of the CDs, the smaller the PL spectrum width.31 The resulting CDs display a PL peak with a full width at half maximum height (FWHM) value as small as 17 nm, indicating the production of highly monodisperse nanodots. This value is smaller than the previously reported FWHM for CDs15,32 (Fig. 2b). It should be noted that the PL of the blank solution, OPPF6 dispersed in water, showed very weak intensity. Therefore, it can be concluded that the observed bright PL emission is due to the CDs. The inset in Fig. 2b is the PL photo of a CDs solution illuminated by a UV lamp. The bright blue PL of CDs is very intense and can easily be detected with the naked eye. Moreover, the PL intensity of the as-synthesized CDs was stable at pH range 4–9 (Fig. S5 in the ESI†). The typical PL lifetime was also measured (Fig. S6 in the ESI). The PL decay of the CDs could be deconvoluted using a mono-exponential decay function to yield a lifetime of 6.7 ns. The QY, against quinine sulfate, was measured to be 27% (Fig. S7 in the ESI†). This value is higher than many of the previously reported QYs for CDs.7,15
The optical band gap energy of the CDs was also calculated by plotting (αhν)2versus hν (Fig. S8 in the ESI). From this analysis, by extrapolating a straight line at the linear part of the curve, the optical band gap energy of the CDs was calculated as 3.7 eV. Neither of the two bulk carbon allotropes, graphite and diamond, gives strong luminescence, given that the former is a conductor and the latter is an insulator having an indirect band gap of 5.5 eV.32 Therefore, the synthesized CDs by a band gap of 3.7 eV exhibits a trend similar to QD semiconductors and gives a strong luminescence.33
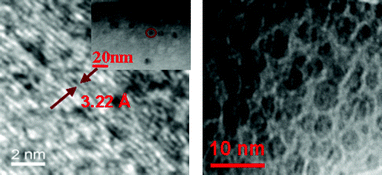
High-resolution transmission electron microscopy (HRTEM) allowed the acquisition of images of single dots as shown in Fig. 3, which revealed the synthesis of CDs with an average size of ∼6 nm. These images offer more detailed structural information on the CDs and reveal that the CDs are structurally crystalline, with the periodic fringe spacing of 3.22 Å analogous to the 002 facet of graphite.34–36 Although attempts to obtain Raman spectra were unsuccessful due to the fluorescence of CDs,4,10 however, the broad diffraction peak corresponding to graphite 002 was observed in the X-ray diffraction (XRD) spectrum (Fig. S9 in the ESI†). The spacing distance is around 0.32 nm, which agrees with the HRTEM results. Also, the size of CDs was estimated to be about 6.7 nm by Debye Scherrer equation,32,37 which is very close to that observed by TEM.
 | ||
| Fig. 3 HRTEM images of CDs; the left image shows the enlargement of the CD highlighted with a circle in the inset. | ||
Furthermore, we highlight the peroxidase mimetic behavior of CDs for azo dyes degradation.
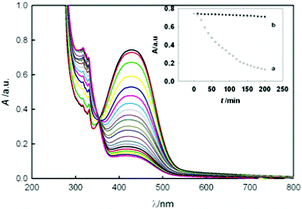
In an exploratory experiment to demonstrate the intrinsic enzyme mimetic activity of CDs, degradation of methyl red (MR) and methyl orange (MO), as models for azo dyes, was examined in the presence of H2O2. A sample containing 10.0 mg L−1 of MR was placed in a quartz cell. The reaction was initiated by adding a known dose of H2O2 to the solution held at a constant temperature. The MR in this reaction was quantified by the measurement of the decay of absorbance at λmax = 425 nm as a function of time. The results revealed a slow absorbance change when H2O2 was mixed with MR in the absence of the catalyst (rate constant of 2.2 × 10⁻⁴ min−1 and degradation efficiency of 4.5%). As shown in Fig. 4, when CDs were present in the solution, a significant degradation of the dye was observed indicating the peroxidase mimetic function of CDs. The value of the rate constant and the degradation efficiency of the dye after 200 min were 9.5 × 10⁻³ min−1 and 83%, respectively, suggesting very good catalytic activity of CDs. The images of solutions after degradation are shown in Fig. S10 in the ESI.† Moreover, degradation of the dyes in the absence of the oxidant and in the presence of CDs in sun light was studied (Fig. S11 in the ESI†).
 | ||
| Fig. 4 Change in the absorbance spectrum of MR with time, during the reaction of MR with H2O2 in the presence of CDs (pH = 10). Inset shows comparison of absorbance decay with time, in the (a) presence and (b) absence of CDs. | ||
The insignificant change in the absorbance specifies the important function of oxidant in the degradation of dyes and the peroxidase mimetic behavior of CDs. Previous reports suggested that different forms of carbon materials such as graphite, carbon nanotubes, fluorescent carbon dots and graphene oxide show oxidation catalytic activity.38–40
This effect could be explained by the formation of an activated transition complex [C⋯H2O2], which transfers electron density from the π-system of the CDs to the peroxide molecule during the decomposition of H2O2 process.40,41 As an additional evidence, we utilized MO as another model of azo dyes. The findings in MO degradation confirm the catalytic properties of CDs (Fig. S12 in the ESI†).
Conclusions
In summary, we have introduced a new MAIL method for the fast and simple synthesis of small size CDs with narrow size distribution. The quantum yield of the prepared CDs was characterized to be 27%, which is quite high for CDs.7 Furthermore, a new application of CDs has been introduced, which makes use of the effective catalytic activity of CDs on the degradation reaction of azo dyes by H2O2. This peroxidase mimetic property marks the beginning of prospects for CDs applications in versatile areas of biosensors, immunohistochemistry and environmental science.Acknowledgements
The authors wish to express their gratitude to Shiraz University Research Council for the support of this work. They are also grateful to Mr. Arcot R. Lokanathana (iNANO center, Aarhus University, Denmark) for his help with XPS experiment and for informative comments. The authors also thank Miss. Zahra Mohammadpour for her kind assistance throughout this work.References
- S.-T. Yang, X. Wang, H. Wang, F. Lu, P. G. Luo, L. Cao, M. J. Meziani, J.-H. Liu, Y. Liu, M. Chen, Y. Huang and Y.-P. Sun, J. Phys. Chem. C, 2009, 113, 18110 CAS.
- R. Liu, D. Wu, S. Liu, K. Koynov, W. Knoll and Q. Li, Angew. Chem., Int. Ed., 2009, 48, 4598 CrossRef CAS.
- S.-T. Yang, L. Cao, P. G. Luo, F. Lu, X. Wang, H. Wang, M. J. Meziani, Y. Liu, G. Qi and Y.-P. Sun, J. Am. Chem. Soc., 2009, 131, 11308 CrossRef CAS.
- F. Wang, M. Kreiter, B. He, S. Pang and C.-yan Liu, Chem. Commun., 2010, 46, 3309 RSC.
- H. M. R. Gonçalves, A. J. Duarte and J. C. G. Esteves da Silva, Biosens. Bioelectron., 2010, 26, 1302 CrossRef.
- J. Geys, A. Nemmar, E. Verbeken, E. Smolders, M. Ratoi, M. F. Hoylaerts, B. Nemery and P. H. M. Hoet, Environ. Health Perspect., 2008, 116, 1607 CrossRef CAS.
- S. N. Baker and G. A. Baker, Angew. Chem., Int. Ed., 2010, 49, 6726 CrossRef CAS.
- J. C. G. Esteves da Silva and H. M. R. Gonçalves, TrAC, Trends Anal. Chem., 2011, 30, 1327 CrossRef CAS.
- A. B. Bourlinos, A. Stassinopoulos, D. Anglos, R. Zboril, M. Karakassides and E. P. Giannelis, Small, 2008, 4, 455 CrossRef CAS.
- A. B. Bourlinos, A. Stassinopoulos, D. Anglos, R. Zboril, V. Georgakilas and E. P. Giannelis, Chem. Mater., 2008, 20, 4539 CrossRef CAS.
- H. Zhu, X. Wang, Y. Li, Z. Wang, F. Yang and X. Yang, Chem. Commun., 2009, 5118 RSC.
- C. O. Kappe, Angew. Chem., Int. Ed., 2004, 43, 6250 CrossRef CAS.
- X. Wang, K. Qu, B. Xu, J. Ren and X. Qu, J. Mater. Chem., 2011, 21, 2445 RSC.
- S. Chandra, S. H. Pathan, S. Mitra, B. H. Modha, A. Goswami and P. Pramanik, RSC Adv., 2012, 2, 3602 RSC.
- C. Liu, P. Zhang, F. Tian, W. Li, F. Li and W. Liu, J. Mater. Chem., 2011, 21, 13163 RSC.
- Z. Li, Z. Liu, J. Zhang, B. Han, J. Du, G. Yanan and J. Tao, J. Phys. Chem. B, 2005, 109, 14445 CrossRef CAS.
- A. Safavi and S. Zeinali, Colloids Surf., A, 2010, 362, 121 CrossRef CAS.
- A. Safavi, N. Maleki and F. Farjami, Colloids Surf., A, 2010, 355, 61 CrossRef CAS.
- A. Safavi, N. Maleki, E. Farjami and F. A. Mahyari, Anal. Chem., 2009, 81, 7538 CrossRef CAS.
- A. Safavi, N. Maleki, N. Iranpoor, H. Firouzabadi, A. R. Banazadeh, R. Azadi and F. Sedaghati, Chem. Commun., 2008, 6155 RSC.
- N. Maleki, A. Safavi, F. Sedaghati and F. Tajabadi, Anal. Biochem., 2007, 369, 149 CrossRef CAS.
- N. Maleki, A. Safavi and F. Tajabadi, Anal. Chem., 2006, 78, 3820 CrossRef CAS.
- A. Safavi, M. Tohidi, F. A. Mahyari and H. Shahbaazi, J. Mater. Chem., 2012, 22, 3825 RSC.
- J. Heredia-Moya and K. Kirk, J. Fluorine Chem., 2007, 128, 674 CrossRef CAS.
- D. D. Lovingood and G. F. Strouse, Nano Lett., 2008, 8, 3394 CrossRef CAS.
- A. M. Heyns, Spectrochim. Acta, Part A, 1977, 33, 315 CrossRef.
- H. Peng and J. Travas-Sejdic, J. Chem. Mater, 2009, 21, 5563 CrossRef CAS.
- C. B. Murray, D. J. Norris and M. G. Bawendi, J. Am. Chem. Soc., 1993, 115, 8706 CrossRef CAS.
- L. Brus, J. Phys. Chem., 1986, 90, 2555 CrossRef CAS.
- C. F. Landes, M. Braun and M. A. El-sayed, J. Phys. Chem. B, 2001, 105, 10554 CrossRef CAS.
- T. Uematsu, H. Kitajima, T. Kohma, T. Torimoto, Y. Tachibana and S. Kuwabata, Nanotechnology, 2009, 20, 215302 CrossRef CAS.
- J. Zhou, C. Booker, R. Li, X. Zhou, T. K. Sham, X. Sun and Z. A. Ding, J. Am. Chem. Soc., 2007, 129, 744 CrossRef CAS.
- X. Wang, L. Cao, S.-T. Yang, F. Lu, M. J. Meziani, L. Tian, K. W. Sun, M. A. Bloodgood and Y.-P. Sun, Angew. Chem., 2010, 122, 5438 CrossRef.
- Q.-L. Zhao, Z.-L. Zhang, B.-H. Huang, J. Peng, M. Zhang and D.-W. Pang, Chem. Commun., 2008, 5116 RSC.
- J. Lu, J.-xiang Yang, J. Wang, A. Lim, S. Wang and K. P. Loh, ACS Nano, 2009, 3, 2367 CrossRef CAS.
- H. Li, X. He, Z. Kang, H. Huang, Y. Liu, J. Liu, S. Lian, C. H. A. Tsang, X. Yang and S.-tong Lee, Angew. Chem., Int. Ed., 2010, 49, 4430 CrossRef CAS.
- S. Liu, J. Tian, L. Wang, Y. Luo and X. Sun, RSC Adv., 2012, 2, 411 RSC.
- V. P. Santos, M. F. R. Pereira, P. C. C. Faria and J. J. M. Órfão, J. Hazard. Mater., 2009, 162, 736 CrossRef CAS.
- Y. Song, K. Qu, C. Zhao, J. Ren and X. Qu, Adv. Mater., 2010, 22, 2206 CrossRef CAS.
- X. Wang, K. Qu, B. Xu, J. Ren and X. Qu, Nano Res., 2011, 3, 908 CrossRef.
- V. F. Lapko, I. P. Gerasimyuk, V. S. Kuts' and Y. A. Tarasenko, Russ. J. Phys. Chem. A, 2010, 84, 934 CrossRef CAS.
Footnote |
| † Electronic Supplementary Information (ESI) available: Additional experimental details and characterization results. See DOI: 10.1039/c2ra20355c/ |
| This journal is © The Royal Society of Chemistry 2012 |
