Significantly increased cycling performance of novel “self-matrix” NiSnO3 anode in lithium ion battery application†
Xifei
Li
* and
Chunlei
Wang
*
Department of Mechanical and Materials Engineering, Florida International University Miami, FL 33174, USA. E-mail: wangc@fiu.edu; xfli2011@hotmail.com
First published on 28th May 2012
Abstract
A novel nickel tin oxide (NiSnO3) was reported to be used as an anode for lithium ion batteries. It was found that NiSnO3 shows higher cycling performance than the mixture of NiO and SnO2 with the same elemental composition, and the reversible capacity retention is 57% and 32% after 100 charge/discharge cycles, respectively. The NiSnO3 anode can be electrochemically decomposed into NiO, Sn and Li2O in the first discharge process. NiO and Sn can significantly function as “self-matrices” for each other besides the formed Li2O matrix. The massive matrices effectively buffer the large volume change and prevent the aggregation of the nanosized particle upon cycling, resulting in the improved cycling performance without sacrificing the specific energy capacity.
The increasing demand for transportation and portable electronic power has generated significant interest in developing next-generation lithium ion batteries.1,2 Graphite, with theoretical capacity of 372 mAh g−1 corresponding to reversible intercalation of lithium up to LiC6, is the most used commercially available anode for lithium ion batteries. But its limited capacity cannot meet the urgent need of high energy density and high power density in applications such as low- or zero-emission hybrid electric vehicle and plug-in hybrid electric vehicles.3,4 In comparison with graphite, some metal oxide materials, such as SnO25–9 and NiO,10–14 can store larger amounts of lithium with higher specific energy capacity. However, the high lithium intake of the SnO2 anode (maximum intake of 4.4 Li per Sn atom) causes a large volume change upon cycling, which creates cracks and pulverization and ultimately results in poor cycle performance.5–9,15 The reaction of the NiO anode with Li+ results in the formation of Ni and Li2O accompanied with the large volume expansion/constriction. 13–17 The poor cycle performance of NiO is also due to the severe aggregation of nanosized particles during the charge and discharge processes.10–13 Based on the large capacity fade, the composite formation of SnO2 or NiO particles dispersed in electrochemically active/inactive matrices has gained considerable attention in improving cycle performance,5,7–9,12,13,16,18,19 for example, SnO2/carbon,5,7 SnO2/graphene,8,9 NiO/C,12 NiO/Ni,11,14etc. The significant feature in the composites is that the matrices can buffer the large volume change and prevent nanosized particle aggregation and to some degree improves the cycling performance of the anodes. The larger the amount of matrices, the better the cycle performance of the oxide anode material.20,21 However, most matrices have no or low electrochemical activity. As a result, the composites have low specific capacities and the improvement of cycle performance is based on sacrificing the energy capacity of the anodes.
Herein, for the first time, we report nickel tin oxide (NiSnO3, marked NSO), different from the mixture of NiO and SnO2 (marked NAS) with the same elemental composition, as a potential anode material for lithium ion batteries. During the charge/discharge processes, the resultant Sn and NiO can act as “self-matrices” to buffer the large volume change and prevent the nanosized particle aggregation. More importantly, NiO and Sn as “self-matrices” do not sacrifice the specific capacity of the NSO anode due to their high electrochemical activity.
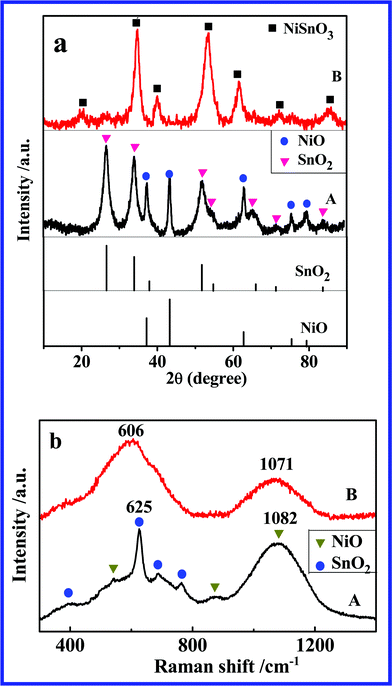
Fig. 1a presents the XRD patterns of NAS and NSO, respectively. In the XRD spectrum of NAS, all diffraction peaks match well with NiO phase (JCPDS no. 44-1159) and SnO2 phase (JCPDS no. 41-1445), and no evidence of the third phase formation can be observed, indicating that the mixture of NiO and SnO2 was successfully synthesized by a polymerized complex method. In Fig. 1a (B), the diffraction peaks are totally different from those of NiO and SnO2. They are also different from JCPDS 28-711 which is the only one card for NSO phase in JCPDS database. The Raman spectra of NSO and NAS are shown in Fig. 1b. The spectrum of NAS shows seven main Raman peaks (three peaks for NiO and four peaks for SnO2) further indicating the formation of a mixture of NiO and SnO2. Two peaks located at 606 and 1071 cm−1 are observed in the spectrum of NSO, attributed to the vibrations of the Sn–O band and Ni–O band, respectively. In comparison to NiO and SnO2, the Raman peaks of NSO shift toward low frequency (red shift) due to the different chemical environment in the NSO structure.
 | ||
| Fig. 1 (a) XRD patterns and (b) Raman spectra of (A) NAS and (B) NSO. | ||
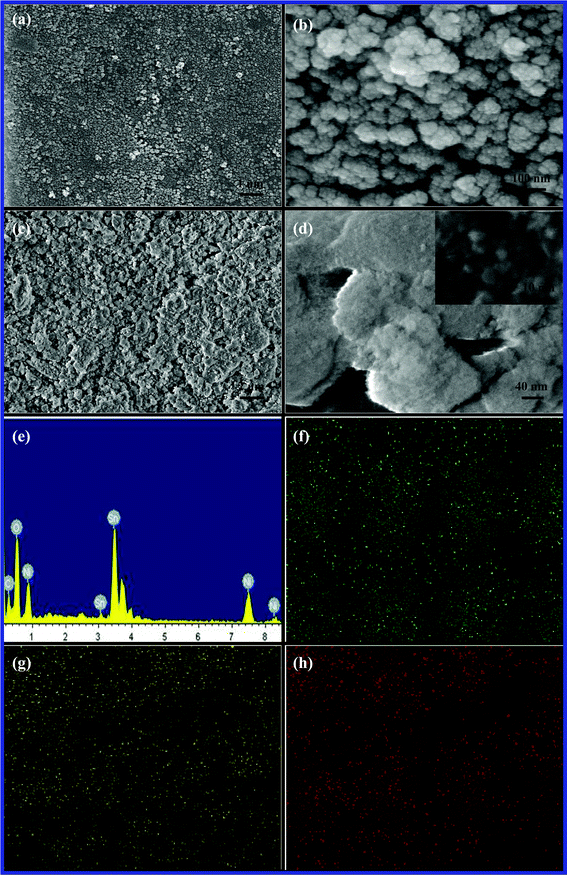
The morphology comparison of NAS and NSO particles is evaluated by SEM illustrated in Fig. 2. As it can be seen in Fig. 2a, the NAS powders heating at 600 °C show agglomerate nature, but present homogeneous morphology with spherical shape in a size range of 70∼120 nm. It is essential that nanosized NAS particles inherently aggregate due to high surface free energy. In the high magnification in Fig. 2b, an NAS particle is composed of many smaller particles with a size range of 10~20 nm. However, NSO shows irregular flake shapes in Fig. 2c and 2d. A closer examination of the NSO shown in the inset of Fig. 2d confirms that the NSO agglomerate includes nanosized particles with a size range of around 6~20 nm. Energy-dispersive X-ray analysis (EDX) was performed to exam the chemical composition and the purity of the NSO material. EDX result confirms the element existence of Ni, Sn, and O in the NSO (see Fig. 2e). It was found that the ratio (at.%) of Ni, Sn, and O is 6![[thin space (1/6-em)]](https://www.rsc.org/images/entities/char_2009.gif) :
:![[thin space (1/6-em)]](https://www.rsc.org/images/entities/char_2009.gif) 6
6![[thin space (1/6-em)]](https://www.rsc.org/images/entities/char_2009.gif) :
:![[thin space (1/6-em)]](https://www.rsc.org/images/entities/char_2009.gif) 43, which is close to the stoichiometric ratio in the nickel tin oxide. Fig. 2f, 2g, and 2h illustrate the element mapping of Ni, Sn and O, and clearly show their homogeneous distribution in the NSO material.
43, which is close to the stoichiometric ratio in the nickel tin oxide. Fig. 2f, 2g, and 2h illustrate the element mapping of Ni, Sn and O, and clearly show their homogeneous distribution in the NSO material.
 | ||
| Fig. 2 Representative SEM images of (a, b) NAS and (c, d) NSO, (e) EDX and EDX mapping for (f) Ni, (g) Sn, and (h) O of NSO material. | ||
According to previous studies of similar Sn based oxide anodes,22–27 in the first cycle, the reaction entails a lithium-driven conversion process, that is, NSO is decomposed into NiO, Sn and Li2O in the first discharge (eqn (1)). And then, both obtained Sn and NiO can react with lithium via alloying/de-alloying and conversion reaction (eqn (3) and eqn (2)), respectively.
| NiSnO3 + 4Li+ + 4e− → NiO + Sn + 2Li2O | (1) |
| NiO + 2Li+ + 2e− ↔ Ni + Li2O | (2) |
| Sn + xLi+ + xe− ↔ LixSn | (3) |
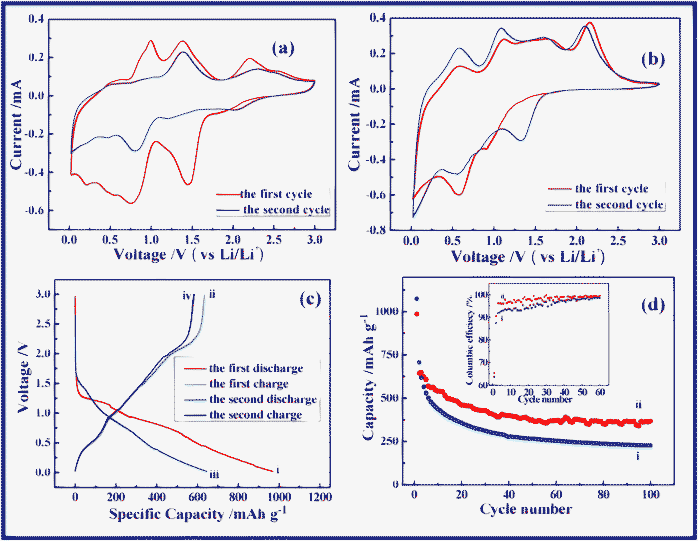
CR-2032-type coin cells were assembled to evaluate the electrochemical performance of anodes with lithium. Fig. 3a and 3b show the CV curves of NAS and NSO electrodes cycled between 0.02 and 3.0 V at a sweep rate of 0.1 mV s−1. During the electrochemical reaction of NAS with lithium, an obvious peak centered at 1.4 V was observed in the first cathodic scan, but disappears in the second scan. This peak results from the formation of the solid electrolyte interphase (SEI) on the NiO anode and the SnO2 anode. Another reduction peak was found at 0.8 V from the reduction reaction of NiO and SnO2 with lithium. Other reduction peaks corresponds to the alloying process of Sn with lithium. In the anodic process, the de-alloying of LixSn is related to two peaks at 0.9 V and 1.3 V.28 Another peak located at 2.2 V corresponds to the reaction where Ni is re-oxidized to NiO (Ni + Li2O ⇌ NiO + 2Li+ + 2e−).11,13,29 The CV curve of NSO shows the different cathodic scan. In the first cathodic scan there is a peak positioned at 0.9 V, but it disappears in the second scan. This reduction peak can be assigned to the reaction of NSO with lithium to form NiO, Sn and Li2O. Another reduction peak is observed at 0.6 V, resulting from NiO reaction with lithium. The third peak close to 0 V is due to Sn alloying with lithium.30
 | ||
| Fig. 3 Cyclic voltammograms of (a) NAS and (b) NSO anodes in a voltage window of 0.02~3.0 V at a scan rate of 0.1 mV s−1. (c) Voltage versus capacity profiles of NSO anode in the first two cycles in the voltage window 0.02~3.0 V at a current density of 100 mA g−1: (i) the first discharge, (ii) the first charge, (iii) the second discharge, and (iv) the second charge. (d) The comparison of capacity versus cycle number plots for (i) NAS and (ii) NSO anodes at a current density of 100 mA g−1 at room temperature. The inset is the coulombic efficiency for (i) NAS and (ii) NSO anodes. | ||
In the voltage-capacity profiles of NSO in Fig. 3c, in the first discharge, the voltage rapidly drops to 1.3 V followed by a plateau, and then gradually decreases to 0.02 V. The charge profile shows a different characteristic. At the beginning of charge process, a slope plateau located at 0.5 V is observed due to the de-alloying of LixSn. And then, the voltage gradually increases up to 2.0 V. Subsequently, another plateau at 2.2 V results from the Ni re-oxidization.11,13,27 As shown in Fig. 3c, the discharge and charge capacities delivered are around 969 and 634 mAh g−1 in the first cycle, respectively, while in the second cycle they decrease down to 646 and 584 mAh g−1. As can be seen, eqn (1) is irreversible, leading to the irreversible capacity in the first charge/discharge processes. In addition, the SEI formation on anodes also results in some irreversible capacity.31–33
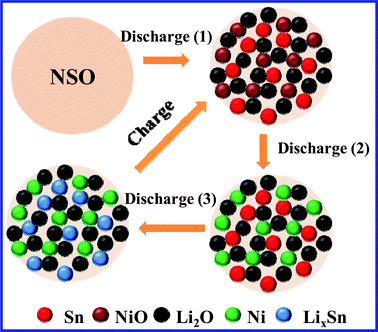
Fig. 3d compares the different cycling behavior of NAS and NSO as anodes for lithium ion batteries at a current density of 100 mA g−1 in a voltage range of 0.02~3.0 V. As can be seen, in the second cycle NAS shows a slightly higher reversible capacity than NSO. The reversible capacity of NAS rapidly fades with a capacity retention of only 32% after 100 cycles (compared with 708 mAh g−1 in the second cycle). However, NSO can deliver a higher reversible capacity of 369 mAh g−1 in the 100th cycle, and a higher capacity retention of 57% is maintained. It is obvious that the proposed novel anode, NSO, shows better cycling performance in comparison with the traditional anodes with a similar composition, the mixture of NiO and SnO2. In this novel anode system, as illustrated in Scheme 1, in the first discharge process the NSO anode can be electrochemically decomposed into NiO, Sn and Li2O (Discharge (1)).20–25In situ formation of Sn, NiO and Li2O results in their uniform mixing together in the anode system. But the NiO anode and Sn anode have totally different working voltages. NiO is first reduced to Ni particles (Discharge (2)). After that, Sn particles react with lithium to form LixSn (Discharge (3)). Clearly, the formed inactive Li2O can act as the matrix. More importantly, when NiO reacts with lithium, Sn can act as a “matrix”. NiO can also function as a “matrix” during the LixSn alloying formation. Obviously, during the continuous charge/discharge processes, Sn and NiO can act as “self-matrices”. A large amount of matrices can effectively buffer the obviously large volume change34–39 and suppress the aggregation of nanoscale particles upon cycling.40–43 In particular, NiO and Sn as “self-matrices” do not sacrifice the specific capacity of NSO anode due to their high electrochemical activity and good electric conductivity from dispersed metal Ni and Sn particles. As a result, NSO can improve cycling performance without sacrificing the specific energy capacity.
 | ||
| Scheme 1 Discharge/charge mechanism of NSO anode as “self-matrices” in a lithium ion battery. | ||
The inset in Fig. 3d compares coulombic efficiency of NAS and NSO anodes. In the first cycle, both show similar coulombic efficiencies. The first cycles of both electrodes exhibit high irreversible capacities (Cirre), which could be attributed to the electrolyte reduction and the formation of the SEI layer on the surface of the anodes. Obviously, in the subsequent cycles, the coulombic efficiency of NSO is much higher than that of NAS. When the cells were charged and discharged, the NAS anode suffered from serious volume change, which could result in the cracking/pealing of the formed SEI and continuous growth of the SEI films.44,45 As a result, upon cycling thicker and thicker SEI films were formed on NAS. However, the proposed novel NSO anode can be beneficial to buffering the volume change due to the nature of self-matrices. Therefore, the NSO anode shows higher coulombic efficiency than the NAS anode. On the other hand, the SEI films have the nature of electrical insulation, which increases the electrode pulverization. The thicker and continuously growing SEI films can cause the longer lithium ion diffusion distance through the SEI. Inevitably, these can result in obvious capacity fading in the NAS anode during the charge/discharge processes.46
It is worth noting that the obtained cycling performance of NSO in this research is not good enough, partly resulting from the inhomogeneous morphology of commercial NSO, but its performance is still higher than NAS with homogeneous morphology and crystallinity, showing the obvious advantage of NSO as anodes for lithium ion batteries. Future work will be done to synthesize NSO with homogeneous morphology to further improve cycling performance.
In summary, we have reported a novel NiSnO3 anode material showing better cycling performance than the traditional anodes with similar composition. In the first discharge, under a Li-driven electrochemical force, the in situ formation of Sn, NiO and Li2O results in their uniform mixing together. The inactive Li2O matrix buffers the large volume change during cycle. Sn and NiO can act as counter “matrix” for each other. This special and massive “self-matrices” impels the improvement of cycle performance without sacrificing high specific capacity. Furthermore, a lot of space exists to further enhance the specific capacity and cycle performance of NSO by tailoring the particle size as well as morphology by employing solution based synthesis routes. The proposed anode may also be extended to other types of transition metals with a similar “self-matrix” anode configuration. During charge/discharge, the formation of an intrinsic massive “self-matrix” has been demonstrated to be a favourable option to improve the electrochemical performance of lithium ion battery anodes with high energy capacity. We believe that the proposed “self-matrix” anodes are very promising in high performance lithium ion battery applications.
Acknowledgements
Authors would like to acknowledge American Chemical Society (Petroleum Research Fund, 49301-0N110), and the Advanced Materials Engineering Research Institute (AMERI) facility at Florida International University.References
- A. S. Arico, P. Bruce, B. Scrosati, J. M. Tarascon and W. Schalkwijk, Nat. Mater., 2005, 4, 366–377 CrossRef CAS.
- M. K. Song, S. Park, F. M. Alamgir, J. Cho and M. L. Liu, Mater. Sci. Eng., R, 2011, 72, 203–252 CrossRef.
- C. M. Park and H. J. Sohn, Electrochim. Acta, 2009, 54, 6367–6373 CrossRef CAS.
- R. Marom, S. F. Amalraj, N. Leifer, D. Jacob and D. Aurbach, J. Mater. Chem., 2011, 21, 9938–9954 RSC.
- Y. Zhao, J. X. Li, Y. H. Ding and L. H. Guan, RSC Adv., 2012, 2, 2003–2009 RSC.
- S. J. Han, B. C. Jang, T. Kim, S. M. Oh and T. Hyeon, Adv. Funct. Mater., 2005, 15, 1845–1850 CrossRef CAS.
- X. W. Lou, C. M. Li and L. A. Archer, Adv. Mater., 2009, 21, 2536–2539 CrossRef CAS.
- X. F. Li, X. B. Meng, J. Liu, D. S. Geng, Y. Zhang, M. Banis, Y. L. Li, R. Y. Li, X. L. Sun, M. Cai and M. Verbrugge, Adv. Funct. Mater., 2012, 22, 1647–1654 CrossRef CAS.
- S. J. Ding, D. Y. Luan, F. Y. Chiang Boey, J. S. Chen and X. W. Lou, Chem. Commun., 2011, 47, 7155–7157 RSC.
- P. Poizot, S. Laruelle, S. Grugeon, L. Dupont and J. M. Tarascon, Nature, 2000, 407, 496–499 CrossRef CAS.
- L. Q. Tao, J. T. Zai, K. X. Wang, Y. H. Wan, H. J. Zhang, C. Yu, Y. L. Xiao and X. F. Qian, RSC Adv., 2012, 2, 3410–3415 RSC.
- X. H. Huang, J. P. Tu, B. Zhang, C. Q. Zhang, Y. Li, Y. F. Yuan and H. M. Wu, J. Power Sources, 2006, 161, 541–544 CrossRef CAS.
- Y. NuLi, P. Zhang, Z. Guo, D. Wexler, H. Liu, J. Yang and J. Wang, J. Nanosci. Nanotechnol., 2009, 9, 1951–1955 CrossRef CAS.
- X. F. Li, A. Dhanabalan and C. L. Wang, J. Power Sources, 2011, 196, 9625–9630 CrossRef CAS.
- S. D. Seo, G. H. Lee, A. H. Lim, K. M. Min, J. C. Kim, H. W. Shim, K. S. Park and D. W. Kim, RSC Adv., 2012, 2, 3315–3320 RSC.
- X. H. Huang, J. P. Tu, X. H. Xia, X. L. Wang, J. Y. Xiang, L. Zhang and Y. Zhou, J. Power Sources, 2009, 188, 588–591 CrossRef CAS.
- X. F. Li, A. Dhanabalan, K. Bechtold and C. L. Wang, Electrochem. Commun., 2010, 12, 1222–1225 CrossRef CAS.
- M. Holzapfel, H. Buqa, W. Scheifele, P. Novak and F. M. Petrat, Chem. Commun., 2005, 1566–1568 RSC.
- Y. Idota, T. Kubota, A. Matsufuji, Y. Maekawa and T. Miyasaka, Science, 1997, 276, 1395–1397 CrossRef CAS.
- K. D. Kepler, J. T. Vaughey and M. M. Thackeray, J. Power Sources, 1999, 81–82, 383–387 CrossRef CAS.
- J. Niu and J. Lee, Electrochem. Solid-State Lett., 2002, 5, A107–A110 CrossRef CAS.
- I. A. Courtney and J. R. Dahn, J. Electrochem. Soc., 1997, 144, 2045–2052 CrossRef CAS.
- P. A. Connor and J. T. Irvine, Electrochim. Acta, 2002, 47, 2885–2892 CrossRef CAS.
- D. Zhang, S. Zhang, Y. Jin, T. Yi, S. Xie and C. Chen, J. Alloys Compd., 2006, 415, 229–233 CrossRef CAS.
- A. Rong, X. Gao, G. Li, T. Yan, H. Zhu, J. Qu and D. Song, J. Phys. Chem. B, 2006, 110, 14754–14760 CrossRef CAS.
- N. Sharma, K. M. Shaju, G. V. Subba Rao and B. V. R. Chowdari, Electrochem. Commun., 2002, 4, 947–952 CrossRef CAS.
- M. Mouyane, M. Womes, J. C. Jumas, J. Olivier-Fourcade and P. E. Lippens, J. Solid State Chem., 2011, 184, 2877–2886 CrossRef CAS.
- M. F. Hassan, M. M. Rahman, Z. P. Guo, Z. X. Chen and H. K. Liu, J. Mater. Chem., 2010, 20, 9707–9712 RSC.
- B. Varghese, M. V. Reddy, Y. W. Zhu, C. S. Lit, T. C. Hoong, G. V. Subba Rao, B. V. R. Chowdari, A. T. S. Wee, C. T. Lim and C. H. Sow, Chem. Mater., 2008, 20, 3360–3367 CrossRef CAS.
- Y. Yu, L. Gu, C. L. Wang, A. Dhanabalan, P. A. van Aken and J. Maier, Angew. Chem., Int. Ed., 2009, 48, 6485–6489 CrossRef CAS.
- J. Lee, R. Zhang and Z. Liu, J. Power Sources, 2000, 90, 70–75 CrossRef CAS.
- R. Dedryvere, S. Laruelle, S. Grugeon, P. Poizot, D. Gonbeau and J. M. Tarascon, Chem. Mater., 2004, 16, 1056–1061 CrossRef CAS.
- S. Grugeon, S. Laruelle, L. Dupont and J. M. Tarascon, Solid State Sci., 2003, 5, 895–904 CrossRef CAS.
- Y. Wang, J. Y. Lee and T. C. Deivaraj, J. Electrochem. Soc., 2004, 151, A1804–A1809 CrossRef CAS.
- P. Wu, N. Du, H. Zhang, J. X. Yu, Y. Qi and D. R. Yang, Nanoscale, 2011, 3, 746–750 RSC.
- G. F. Ortiz, I. Hanzu, P. Knauth, P. Lavela, J. L. Tirado and T. Djenizian, Electrochem. Solid-State Lett., 2009, 12, A186–A189 CrossRef CAS.
- M. M. Rahman, S. L. Chou, C. Zhong, J. Z. Wang, D. Wexler and H. K. Liu, Solid State Ionics, 2010, 180, 1646–1651 CrossRef CAS.
- Z. J. Du and S. C. Zhang, J. Phys. Chem. C, 2011, 115, 23603–23609 CAS.
- X. F. Li, A. Dhanabalan and C. L. Wang, Adv. Energy Mater., 2012, 2, 238–244 CrossRef CAS.
- W. Lv, F. Sun, D. M. Tang, H. T. Fang, C. Liu, Q. H. Yang and H. M. Cheng, J. Mater. Chem., 2011, 21, 9014–9019 RSC.
- W. W. Zhou, J. X. Zhu, C. W. Cheng, J. P. Liu, H. P. Yang, C. X. Cong, C. Guan, X. T. Jia, H. J. Fan, Q. Y. Yan, C. M. Li and T. Yu, Energy Environ. Sci., 2011, 4, 4954–4961 CAS.
- X. H. Huang, J. P. Tu, C. Q. Zhang and J. Y. Xiang, Electrochem. Commun., 2007, 9, 1180–1184 CrossRef CAS.
- J. K. Shon, H. Kim, S. S. Kong, S. H. Hwang, T. H. Han, J. M. Kim, C. Pak, S. Doo and H. Chang, J. Mater. Chem., 2009, 19, 6727–6732 RSC.
- M. Winter, W. K. Appel, B. Evers, T. Hodal, K. C. Moller, I. Schneider, M. Wachtler, M. R. Wagner, G. H. Wrodnigg and J. O. Besenhard, Monatsh. Chem., 2001, 132, 473–486 CrossRef CAS.
- H. Wu, G. Zheng, N. Liu, T. J. Carney, Y. Yang and Y. Cui, Nano Lett., 2012, 12, 904–909 CrossRef CAS.
- H. Wu, G. Chan, J. W. Choi, I. Ryu, Y. Yao, M. T. McDowell, S. W. Lee, A. Jackson, Y. Yang, L. Hu and Y. Cui, Nat. Nanotechnol., 2012, 7, 310–315 CrossRef CAS.
Footnote |
| † Electronic Supplementary Information (ESI) available. See DOI: 10.1039/c2ra20527k/ |
| This journal is © The Royal Society of Chemistry 2012 |
