Facile polymer-assisted synthesis of LiNi0.5Mn1.5O4 with a hierarchical micro–nano structure and high rate capability†
Xiaolong
Zhang
,
Fangyi
Cheng
,
Kai
Zhang
,
Yanliang
Liang
,
Siqi
Yang
,
Jing
Liang
and
Jun
Chen
*
Key Laboratory of Advanced Energy Materials Chemistry (Ministry of Education), College of Chemistry, Nankai University, Tianjin, 300071, China. E-mail: chenabc@nankai.edu.cn; Fax: 86-22-23509571; Tel: 86-22-23506808
First published on 26th April 2012
Abstract
We report the facile preparation of spinel type LiNi0.5Mn1.5O4 with hierarchical micro–nano structures (LNMO-HMs) and their application as cathode materials for rechargeable lithium-ion batteries. The LNMO-HMs, which were synthesized through a poly(ethylene glycol) (PEG)-assisted co-precipitation route, have a particle size of 5–10 μm, which are composed of nano-particles with a size of about 200 nm. The effect of PEG on the phase purity and morphology of the LNMO products was studied. It was found that as the molecular weight of PEG increased, the lithium nickel oxide impurity decreased at first and then increased slightly. The average size of the nano-particles also showed a similar trend of first a decrease and then an increase, while the secondary micro-particles were enlarged with longer PEG chains. Raman mapping technology proved that the P4332 phase and the Fd3m phase LNMO coexist in the as-prepared samples, but the latter is the mainstay. When applied as cathode materials for lithium-ion batteries, PEG4000-assisted LNMO-HMs showed a remarkably high rate capability and cycling stability. The deliverable discharge capacity exceeded 120 mAh g−1 at 40 C current rate and the capacity retention approached 89% after 150 cycles at 5 C current rate, showing the potential in the application of high rate discharge.
Introduction
Lithium-ion batteries offer the highest energy density and output voltage among the present rechargeable batteries.1–3 Having gained success in powering portable electronic devices, there are emerging interests for Li-ion batteries to power the next generation of electric vehicles (EVs), hybrid EVs (HEVs) and plug-in HEVs (PHEVs).4–6 However, current commercial lithium-ion batteries commonly based on layered cobalt oxide cathode (positive electrode) materials can hardly fulfil this ambitious goal due to safety, cost, performance, and environmental compatibility limitations. Alternative cheaper, safer, and greener cathode materials with high energy and power densities are needed.7,8 Spinel type LiMn2O4 is one of the most promising candidates because of its intrinsic advantages of low cost, high resource abundance, good safety, and environmental friendliness.9,10 However, LiMn2O4 cathodes suffer from capacity fade in the 4 V region, which mainly results from Mn dissolution via a disproportionation reaction of Mn(III) and structural transformation induced by Jahn–Teller distortion.11,12 An approach to suppress the J–T distortion of LiMn2O4 is partial substitution of Mn with other metal elements.13,14 Among all the metal-substituted LiMn2O4, LiNi0.5Mn1.5O4 (LNMO) has attracted extensive interest, because of its high discharge potential (∼4.7 V vs. Li/Li+), large reversible capacity (∼130 mAh g−1), good rate capability and high practical specific energy (∼610 Wh Kg−1).15–17As the phase, shape, size, and structure of electrode materials are of fundamental importance to the electrochemical properties,18 intensive efforts have been focused on the synthesis route to obtain high-purity LNMO with optimized micro structures that enable improved charge–discharge performance.19–27 Generally, the preparation routes of LiNi0.5Mn1.5O4 can be classified into solid state methods,19,20 sol–gel procedures21,22 and co-precipitation techniques.23,24 Other methods include polymer-assisted synthesis,25,26 hydrothermal preparation,27 and so on.28 However, an impurity phase of Li1−xNixO, which is unfavorable to the cycling performance, can usually be observed in the products synthesized through most of the reported methods.19,21,25,28,29 Therefore, it is of great importance and interest to develop an effective route to prepare spinel LNMO with a high phase purity as well as a controllable morphology.
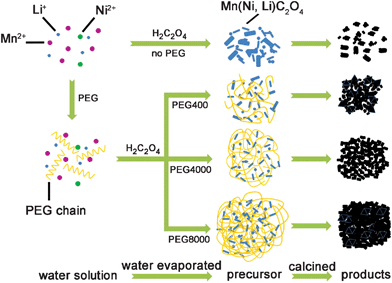
Herein, we report a facile preparation of LNMO by combining the co-precipitation and polymer-assisted method. The co-precipitation method involves simple procedures without the use of complicated facilities. In addition, precursor precipitation is generated simultaneously and uniformly dispersed throughout the solution, thus enabling the mixing of reactants at molecular level. Meanwhile, the employed polymer in the synthesis can act as structure-directing agent and soft template that not only assists the formation of nano-sized particles but also enhances the thorough mixing of reactants. We show that the phase purity and morphology of synthesized LNMO can be controlled by adjusting the molecular weight of PEG. Also, the obtained LNMO product possesses micro–nano hierarchical structure, which is considered to be the most desirable in terms of electrode performance due to the high tap density of secondary particles at macroscopic level and small size of primary particles at microscopic level.30–34 The electrode properties of the prepared LNMO nano–micro hierarchical structures and the effects of morphology and extra pressure during electrode fabrication have been investigated. The electrochemical results demonstrate that the PEG-assisted hierarchical LNMO microstructures exhibit a remarkably high rate capability and good cyclability, indicating their huge potential as cathode materials to construct advanced rechargeable lithium-ion batteries.
Experimental
Preparation
LNMO-HM was synthesized by a PEG-assisted co-precipitation method. In a typical synthesis route, analytical reagent grade LiCH3COO·2H2O, Ni(CH3COO)2·4H2O, and Mn(CH3COO)2·4H2O in molar ratio of 1.03![[thin space (1/6-em)]](https://www.rsc.org/images/entities/char_2009.gif) :0.5:1.5 and in quantities corresponding to 0.5 g of the target LNMO were dissolved in 10 mL of water. The solution was heated to 50 °C and then 2 mL of liquid PEG (PEG400, PEG4000, and PEG8000, where 400, 4000, and 8000 denote the nominal molecular weight) was added. Under constant magnetic stirring, 0.86 g of H2C2O4·2H2O was added to the solution to get a green suspension. Then, the water in the suspension was evaporated at 95 °C to afford a green viscous precursor. The green viscous precursor was dried at ambient temperature under vacuum and further calcined at 800 °C under air atmosphere for 12 h to obtain the final products. A comparative sample was also prepared following similar procedures except that no additive PEG was used.
:0.5:1.5 and in quantities corresponding to 0.5 g of the target LNMO were dissolved in 10 mL of water. The solution was heated to 50 °C and then 2 mL of liquid PEG (PEG400, PEG4000, and PEG8000, where 400, 4000, and 8000 denote the nominal molecular weight) was added. Under constant magnetic stirring, 0.86 g of H2C2O4·2H2O was added to the solution to get a green suspension. Then, the water in the suspension was evaporated at 95 °C to afford a green viscous precursor. The green viscous precursor was dried at ambient temperature under vacuum and further calcined at 800 °C under air atmosphere for 12 h to obtain the final products. A comparative sample was also prepared following similar procedures except that no additive PEG was used.
Materials characterization
Structural analysis was carried out by powder X-ray diffraction (XRD) using a Rigaku D/max-2500 X-ray generator operating in transmission mode with a Cu source. Raman spectra were collected using a confocal Raman microscope (DXR, Thermo-Fisher Scientific) at 532 nm excitation. Scanning electron microscopy (SEM) images were collected on FEI NanoSEM-430. Thermogravimetric analysis (TGA) was performed on a NETZSCH TG 209 with an air flow of 10 mL min−1 and a heating rate of 10 °C min−1. Surface area analysis was carried out by measuring the N2 adsorption–desorption isotherms at 77 K on a BELSORP-mini instrument. To measure the tap density, a certain amount of the LNMO product was placed in a small measuring cylinder and tapped for at least 10 min by hand. The measured volume of the tapped powder and its mass were used to calculate the tap density of LNMO.Electrochemical investigation
Electrochemical tests were performed with CR2032 coin-type cells. The cathodes were fabricated by blending the as-prepared LNMO samples, acetylene black, and polyvinylidene fluoride (PVDF) in N-methyl-2-pyrrolidone, with a weight ratio of 75:20:5. The obtained slurry was pasted onto aluminum foil, dried at 40 °C for 2 h in air and 100 °C for 8 h in vacuum. The dried electrodes were treated with different load pressure (0–40 MPa) to test the effect of mechanical pressure on the electrochemical performance. Lithium metal was used as the anode and reference electrode. The electrolyte was 1.0 M LiPF6 in ethylene carbonatedimethyl carbonate (EC-DMC, in 1:1 volume ratio) solution. The cathode and anode were assembled into coin cells in an argon-filled glove box (Mikrouna Universal 2440/750). The assembled cells were cycled between 3.5–4.95 V at different rates using a LAND-CT2001A battery-testing instrument. The cyclic voltammograms (CVs) and impedance measurements were carried out at room temperature on Parstat 263A and 2273 potentiostat/galvanostat worksation (Princeton Applied Research & AMETEK Company). Electrochemical impedance spectra (EIS) were collected with an AC voltage of 5 mV amplitude in the frequency range from 100 kHz to 10 mHz. Before EIS tests, the assembled cells were first charge–discharged at 1 C rate for 5 cycles to stabilize the cells.
Results and discussion
Structural and morphological characterization
Powder XRD patterns of the four products prepared without the use of PEG and with PEG400, PEG4000, and PEG8000 are shown in Fig. 1. All the samples display the typical profile of the spinel phase (Joint Committee on Powder Diffraction Standards, JCPDS card No. 80-2162). However, there was a visible small peak at 2θ = 44° that could not be indexed in the spinel structure but was assigned to Li1−xNixO,17,35 which is a common concomitant impurity phase in LNMO products. Compared to the sample prepared without PEG (Fig. 1A), the Li1−xNixO peak was obviously declined in the LNMO-PEG400 sample (Fig. 1B). The impurity peak in the LNMO-PEG4000 sample (Fig. 1C) was almost completely diminished; however, in the LNMO-PEG8000 sample (Fig. 1D), the intensity of this impurity peak increased slightly. Thus, the XRD results suggest that PEG plays an important role in improving the phase purity of the LNMO products. In this work, the highest phase purity of LNMO was obtained with the assistance of PEG 4000.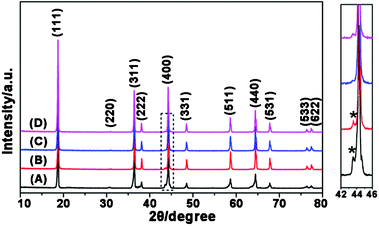 | ||
| Fig. 1 XRD patterns of the LNMO samples prepared without PEG (A), with PEG400 (B), with PEG4000 (C), and with PEG8000 (D). The dashed rectangle region is enlarged and shown on the right, with the strongest Li1−xNixO impurity peaks being marked by*. | ||
Normally, the spinel structure of LNMO can be simply described as a cubic close packing of oxygen atoms with Mn and Ni occupying half of the octahedral sites and Li residing in an eighth of the tetrahedral sites. In detail, Mn and Ni ions can be disordered or ordered in the octahedral sites, corresponding to the Fd3m (F phase) and P4332 (P phase) space group, respectively.36 The cation ordering in LNMO (F phase and P phase) shows poor contrast in XRD patterns, however, previous studies have proved Raman scattering to be a useful tool in distinguishing these two phases.37 In this study, Raman mapping technology was used to detect the coexistence of F and P phases in the LNMO-PEG4000 sample (Fig. 2a). The mapping image results from 100 Raman spectra collected within a selected area of 10 × 10 μm2, and the intensity of red, green, and blue color corresponds to the band intensity at 635 cm−1, which is the strongest Raman peak of LNMO. Two representative Raman spectra in the mapping (point 1 and 2) corresponding to the F phase and P phase were found and are shown in Fig. 2b. The stronger Raman signal, the sharpness of the Raman bands and the peak split around 595 cm−1 due to the lowered symmetry caused by cation ordering are the fingerprints of P phase LNMO.38,39 All the spectra in the red area of the mapping were typical of P phase LNMO, while those in the green and blue area were typical of an F phase LNMO. Accordingly, the Raman mapping image generally presents the distribution of the two phases in the sample. Statistically, about 95 points out of the 100 selected points were assigned to F phase LNMO. The above analysis indicated that the P phase and F phase coexist in the as-prepared sample, but the latter is the mainstay.
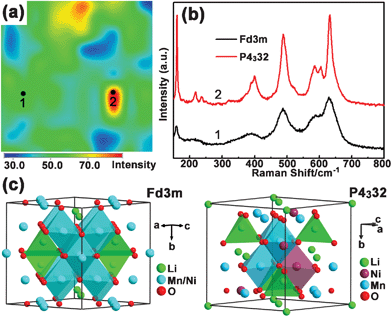 | ||
| Fig. 2 (a) Raman mapping of LNMO-PEG4000 within a selected area of 10 × 10 μm2. The image results from Raman spectra collected at 1 μm resolution. All the spectra in the red area of the mapping were typical of an P4332 phase LNMO, while those in the green and blue area were typical of an Fd3m phase LNMO. (b) Two representative Raman spectra of the marked two points (1 and 2) in (a) corresponding to the Fd3m and P4332 phase, respectively. (c) Crystal structure of cation disordered (Fd3m) and ordered (P4332) spinel LNMO. | ||
Fig. 3 shows the typical field-emission SEM images of the four LNMO samples. All the LNMO samples prepared with the aid of PEG adopt a hierarchical micro–nano structure composed of octahedral or pseudo-polyhedral particles. In comparison, the sample prepared without PEG (Fig. 3a,b) presents in the form of irregular particles typically with micrometer size. Obviously, the presence of PEG is the key of generating the hierarchical micro-structure. The average sizes of the secondary micro-structures in LNMO-PEG400 (Fig. 3c), LNMO-PEG4000 (Fig. 3e), and LNMO-PEG8000 (Fig. 3g) are 2–3, 5–6, and 7–8 μm, respectively; the size distributions of the corresponding primary particles are 200–1000 nm (Fig. 3d), 200–300 nm (Fig. 3f), 200–800 nm (Fig. 3h), respectively. When PEG with a larger molecular weight was used, the secondary micro-structures grow larger and tighter. However, the relation between the size of the primary particles and the molecular weight of the employed PEG shows different trends. LNMO-PEG4000 has a much smaller particle size with a more uniform size distribution than that of both LNMO-PEG400 and LNMO-PEG8000. N2 adsorption–desorption analysis (Fig. 4) displays that the BET specific surface areas of LNMO-noPEG, LNMO-PEG400, LNMO-PEG4000, and LNMO-PEG8000 were 1.9, 2.9, 4.0, and 2.4 m2 g−1, respectively. Meanwhile, tap density measurements show that the tap densities of the four LNMO samples were 1.0, 0.97, 1.4, 1.7 g cm−3, respectively. The higher tap density of the two well hierarchical structured LNMO samples (LNMO-PEG4000 and LNMO-PEG8000) makes them have a higher volumetric energy density.
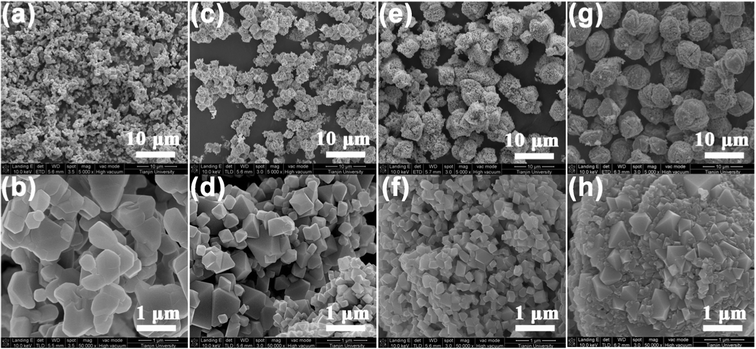 | ||
| Fig. 3 SEM images of LNMO samples prepared without PEG (a, b), and with PEG400 (c, d), PEG4000 (e, f) and PEG8000 (g, h). | ||
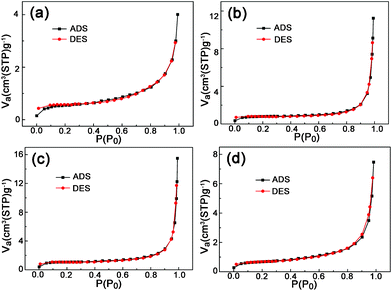 | ||
| Fig. 4 Adsorption–desorption isotherms of the LNMO sample prepared without PEG (a), with PEG400 (b), with PEG4000 (c), and with PEG8000 (d). | ||
As an organic surfactant, PEG can act a structure-directing agent or “soft template” and is widely used to prepare nanotsructured materials with peculiar morphologies.40 In the present work, the presence of PEG leads to a hierarchical microstructure of the products. The growth mechanism of the hierarchical microstructure is described in Fig. 5. PEG adopts a uniform and ordered chain structure in water solution, with functional groups that have strong interactions with metal ions. When H2C2O4 is added to the solution, the formation of the acetate precipitation proceeds through two separate steps, a short nucleation step followed by a particle growth step. The existence of PEG chains confined the growth of the acetate nano-particles. When water is evaporated, the solid residue and PEG chains self-assemble into the embryo hierarchical structure. PEG acted as soft template and dispersion medium during the above process, which also allowed the sufficient mixing of the precipitations.41 PEG combusted during the calcination process, thus allowing the formation of the final hierarchical products. The experiment results show that PEG with a longer molecular chain is more likely to form larger and tighter hierarchical structures. However, the viscosity of PEG also increases with the chain length, which would hamper the full mixing of the acetate reactants in the precursor. Consequently, PEG with molecular weight higher than 4000 results in slightly increased impurity phase and larger particle size distribution of the obtained LNMO product.
 | ||
| Fig. 5 Schematic illustration of the proposed formation mechanism of LNMO hierarchical micro–nano structure. | ||
Controlled experiments (see supplementary information Fig. S1–S2†) and extensive SEM observations (Fig. 6) were carried out to understand the above-proposed mechanism. TG analysis (Fig. S1†) shows that the weight loss of LNMO-PEG4000 precursor occurred mainly between 200 and 360 °C. SEM images of the pristine precursor (Fig. 6a) show the embryo of the hierarchical microstructure. Fig. 6b–6d clearly presents the morphology evolution of the precursor during the heating process. Phase transfer over the heating process was also detected by XRD. The results are shown in supplementary information Fig. S2a–d.† These experimental results and analyses support the proposed growth mechanism of hierarchical microstructured LNMO that is illustrated in Fig. 5.
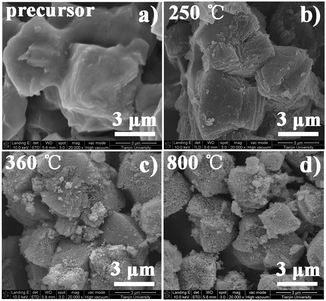 | ||
| Fig. 6 Morphology evolution during the heating process of LNMO-PEG4000 precursor. | ||
Electrochemical investigation
The cell fabricating processes have influence on the electrochemical performance.20 Before systematically investigating the electrochemical performance of the as-prepared LNMO samples, a comparative study to understand the impact of different load pressure (0, 2.5, 5, 10, 20, 30, and 40 MPa) on the electrodes was conducted. The results show that the electrodes treated under 40 MPa exhibited the best rate capability (detailed information is shown in supplementary information Fig. S3†).LNMO samples prepared without PEG and with PEG400, PEG4000, and PEG8000 were fabricated into coin cells and electrochemically investigated. Fig. 7a shows the typical galvanostatic charge–discharge profiles of the four samples tested at a potential range of 3.5–4.95 V and at a current rate of 1 C (1 C = 147 mA g−1). All the samples exhibit two distinguishable discharge pseudoplateaus at 4.64 V and 4.59 V, and a small sloping plateau centered at 4.0 V. The former two higher plateaus are ascribed to the Ni2+/4+ redox couple, while the later is associated with Mn3+/4+ redox couple, as reported previously.42 All the samples presented typical charge–discharge curves of F phase LNMO, which is in accordance with the results of Raman mapping. The initial discharge capacities of LNMO-noPEG, LNMO-PEG400, LNMO-PEG4000, and LNMO-PEG8000 are 115, 130, 140, and 109 mAh g−1, respectively. After 50 charge–discharge cycles the capacity retention of the four samples are 92%, 94%, 94%, and 98%, respectively (Fig. 7b). The three PEG-assisted LNMO samples show better capacity retention as compared to the sample prepared in the absence of PEG, which can be interpreted by the fact that the impurity Li1−xNixO phase tends to react with the electrolyte and thus causes capacity fading.29 Among the PEG-assisted samples, LNMO-PEG4000 delivers the highest capacity because of the small particle size and relatively porous structure, which offers shorter Li+ diffusion distance and more interface contact areas between electrolyte and active mass. On the other hand, it should be noted that although the purity of LNMO-PEG4000 is higher than that of LNMO-PEG8000, the later shows better capacity retention than the former. The improved cyclability of LNMO-PEG8000 is possibly due to the lower specific surface areas that mitigate side reactions between the electrolyte and the active materials.
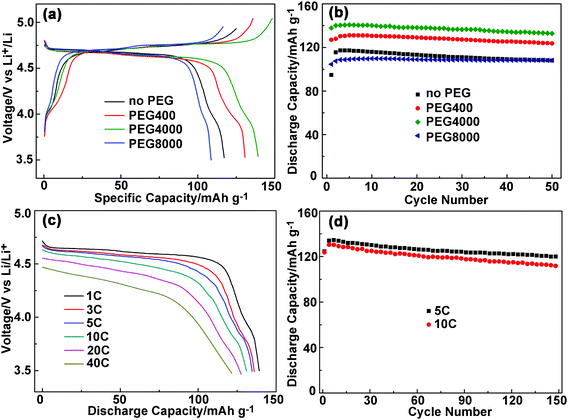 | ||
| Fig. 7 Typical charge–discharge curves (a) and cycling tests (b) of the LNMO samples prepared without and with PEG. Rate capability (c) and high rate cycling performance (d) of LNMO-PEG4000. All the samples were cycled between 3.5 and 4.95 V at 1 C rate (1 C = 147 mA g−1). | ||
To evaluate the high rate capability, the LNMO-PEG4000 sample was cycled at different discharge rates (1, 3, 5, 10, 20, 40 C) and constant charge rate of 1 C. As shown in Fig. 7c, the average potential and the discharge capacity decrease gradually with increasing current rate. This is reasonable since generally a cell operates close to equilibrium condition at low rates, whereas the electrode overpotential and internal ohmic (IR) drop increase at high rates. At 40 C rate, the sample delivers a discharge capacity of 120 mAh g−1. Then, cycle tests were also carried out on LNMO-PEG4000 sample at 5 C and 10 C (Fig. 7d). After repeated discharge–charge up to 150 cycles, the capacities preserved 120 and 112 mAh g−1 with corresponding capacity retention of 89% and 86%, respectively. The rate capability and cyclability of LNMO in this study are comparable among the best reported results with different morphologies.10,20,22,25 For example, the attained capacity of micro-sized LNMO reported by Ceder and coworkers was around 110 mAh g−1 at a discharge rate of 40 C and an end voltage of 3.0 V,20 while our LNMO hierarchical micro-nanostructures delivered a slightly higher 40 C capacity between 4.8 and 3.5 V, giving a higher discharge plateau voltage.
To gain further insight into the electrochemical characteristics, a series of voltammetry measurements of the LNMO-PEG4000 electrode were conducted. In the full range view of a typical cyclic voltammogram (CV) profile (Fig. 8a), a couple of redox peaks at around 4 V and two couples of well separated, strong redox peaks at 4.6–4.8 V can be observed. The two strong redox couples indicate a two-stage Li+ extraction–insertion from/into the spinel framework. The attribution of these redox reactions remains debatable.43–46Fig. 8b shows the CVs of LNMO-PEG4000 recorded at different potential sweeping rates. As the scanning rate (v) is increased, the peak current (ip) increases and the potential separation is widened within each redox couple. Assuming that the intercalation reaction is controlled by the solid-state diffusion of Li+, the dependence of ip on v1/2 can be applied to determine the diffusion coefficient of Li+ (DLi) on the basis of the following equation:
| ip = 2.69 × 10⁵n3/2ADLi1/2v1/2C0Li | (1) |
where n is the number of electrons per reaction species, A is the total surface area of the electrode (1.13 cm2 in this case), and C0Li is the bulk concentration of Li+ in the electrode (given as 0.02378 mol cm−3).47–49 The calculated Dpc1 and Dpc2 (as indicated in Fig. 8b) were 4.2 × 10⁻¹¹ and 2.9 × 10⁻¹¹ cm2 s−1, respectively. The DLi values from our results are 1–2 orders of magnitude higher than those reported previously.50,51 Kumduraci et al. reported that disordered (Fd3m) LNMO presents 1 order of magnitude larger DLi than ordered LNMO (P4332).50 As the Raman scattering has proved that the sample we prepared mainly contains Fd3m phase LNMO, it is reasonable that the present sample would exhibit a relatively large DLi. The large lithium diffusion coefficient indicates that the present LNMO sample intrinsically has very fast lithium diffusion pathways, which may be attributed to the disordering of Ni and Mn ions in the Fd3m phase.
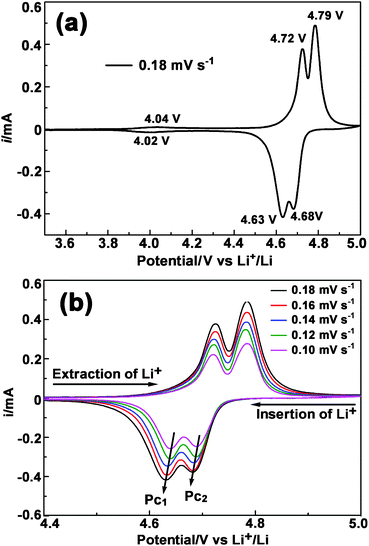 | ||
| Fig. 8 Cyclic voltammograms (CVs) of LNMO-PEG4000 (a, b): (a) shows a full range CV curve scanned at 0.18 mV s-1 and (b) displays CVs at different scan rates in the voltage range of 4.4–5.0 V. | ||
Conclusions
In conclusion, spinel type LNMO with a porous hierarchical micro–nano structure was synthesized through a facile PEG-assisted co-precipitation route and was applied as a cathode material for rechargeable lithium-ion batteries. By using PEG with different molecular weights, the impurity phase in LNMO could be effectively eliminated and the morphology of the final product was controllable. Raman analysis demonstrated that the as-prepared LNMO existed mainly in the form of an Fd3m phase. The synthesized materials showed a remarkably high rate capability and considerable cycle stability. The deliverable discharge capacity exceeded 120 mAh g−1 at 40 C current rate and the capacity retention approached 89% up to 150 cycles at 5 C rate. The present study should shed light on the facile preparation of hierarchical micro–nano structures and their application in developing high-power electrode materials.Acknowledgements
This work was supported by the Programs of National 973 (2011CB935900), MOE Innovation Team (IRT0927), 111 Project (B12015), and Tianjin High-Tech (10SYSYJC27600).References
- M. Armand and J. M. Tarascon, Nature, 2008, 451, 652–657 CrossRef CAS.
- G. Jeong, Y. U. Kim, H. Kim, Y. J. Kim and H. J. Sohn, Energy Environ. Sci., 2011, 4, 1986–2002 CAS.
- F.-F. Cao, Y. G. Guo and L. J. Wan, Energy Environ. Sci., 2011, 4, 1634–1642 CAS.
- A. S. Arico, P. Bruce, B. Scrosati, J. M. Tarascon and W. van Schalkwijk, Nat. Mater., 2005, 4, 366–377 CrossRef CAS.
- O. K. Park, Y. Cho, S. Lee, H.-C. Yoo, H. K. Song and J. Cho, Energy Environ. Sci., 2011, 4, 1621–1633 CAS.
- J. Chen and F. Cheng, Acc. Chem. Res., 2009, 42, 713–723 CrossRef CAS.
- M. R. Palacin, Chem. Soc. Rev., 2009, 38, 2565–2575 RSC.
- F. Cheng, J. Liang, Z. Tao and J. Chen, Adv. Mater., 2011, 23, 1695–1715 CrossRef CAS.
- M. M. Thackeray, W. I. F. David, P. G. Bruce and J. B. Goodenough, Mater. Res. Bull., 1983, 18, 461–472 CrossRef CAS.
- P. G. Bruce, B. Scrosati and J. M. Tarascon, Angew. Chem., Int. Ed., 2008, 47, 2930–2946 CrossRef CAS.
- M. M. Thackeray, Prog. Solid State Chem., 1997, 25, 1–71 CrossRef CAS.
- F. Cheng, H. Wang, Z. Zhu, Y. Wang, T. Zhang, Z. Tao and J. Chen, Energy Environ. Sci., 2011, 4, 3668–3675 CAS.
- K. Amine, H. Tukamoto, H. Yasuda and Y. Fujita, J. Electrochem. Soc., 1996, 143, 1607–1613 CrossRef CAS.
- R. Bittihn, R. Herr and D. Hoge, J. Power Sources, 1993, 43, 223–231 CrossRef CAS.
- J. M. Amarilla, R. M. Rojas and J. M. Rojo, J. Power Sources, 2011, 196, 5951–5959 CrossRef CAS.
- T. Ohzuku, S. Takeda and M. Iwanaga, J. Power Sources, 1999, 81–82, 90–94 CrossRef CAS.
- Q. Zhong, A. Bonakdarpour, M. Zhang, Y. Gao and J. R. Dahn, J. Electrochem. Soc., 1997, 144, 205–213 CrossRef CAS.
- Y. Wang and G. Cao, Adv. Mater., 2008, 20, 2251–2269 CrossRef CAS.
- N. M. Hagh and G. G. Amatucci, J. Power Sources, 2010, 195, 5005–5012 CrossRef CAS.
- X. H. Ma, B. Kang and G. Ceder, J. Electrochem. Soc., 2010, 157, A925–A931 CrossRef CAS.
- M. Kunduraci, J. F. Al-Sharab and G. G. Amatucci, Chem. Mater., 2006, 18, 3585–3592 CrossRef CAS.
- Y. Y. Sun, Y. F. Yang, H. Zhan, H. X. Shao and Y. H. Zhou, J. Power Sources, 2010, 195, 4322–4326 CrossRef CAS.
- S. T. Myung, K. S. Lee, D. W. Kim, B. Scrosati and Y. K. Sun, Energy Environ. Sci., 2011, 4, 935–939 CAS.
- X. Fang, N. Ding, X. Y. Feng, Y. Lu and C. H. Chen, Electrochim. Acta, 2009, 54, 7471–7475 CrossRef CAS.
- K. M. Shaju and P. G. Bruce, Dalton Trans., 2008, 5471–5475 RSC.
- J. Arrebola, A. Caballero, M. Cruz, L. Hernán, J. Morales and E. Castellón, Adv. Funct. Mater., 2006, 16, 1904–1912 CrossRef CAS.
- X. Huang, Q. Zhang, J. Gan, H. Chang and Y. Yang, J. Electrochem. Soc., 2011, 158, A139–A145 CrossRef CAS.
- L. Zhou, D. Zhao and X. Lou, Angew. Chem., Int. Ed., 2012, 51, 239–241 CrossRef CAS.
- R. Santhanam and B. Rambabu, J. Power Sources, 2010, 195, 5442–5451 CrossRef CAS.
- C. Sun, S. Rajasekhara, J. B. Goodenough and F. Zhou, J. Am. Chem. Soc., 2011, 133, 2132–2135 CrossRef CAS.
- J. Hassoun, K.-S. Lee, Y.-K. Sun and B. Scrosati, J. Am. Chem. Soc., 2011, 133, 3139–3143 CrossRef CAS.
- H. Uchiyama, E. Hosono, H. Zhou and H. Imai, J. Mater. Chem., 2009, 19, 4012–4016 RSC.
- Y. L. Ding, X.-B. Zhao, J. Xie, G. S. Cao, T. J. Zhu, H. M. Yu and C. Y. Sun, J. Mater. Chem., 2011, 21, 9475–9479 RSC.
- C. M. Doherty, R. A. Caruso and C. J. Drummond, Energy Environ. Sci., 2010, 3, 813–823 CAS.
- Y. Sun, Y. Yang, X. Zhao and H. Shao, Electrochim. Acta, 2011, 56, 5934–5939 CrossRef CAS.
- J. H. Kim, S. T. Myung, C. S. Yoon, S. G. Kang and Y. K. Sun, Chem. Mater., 2004, 16, 906–914 CrossRef CAS.
- N. Amdouni, K. Zaghib, F. Gendron, A. Mauger and C. Julien, Ionics, 2006, 12, 117–126 CrossRef CAS.
- C. Julien, F. Gendron, A. Amdouni and M. Massot, Mater. Sci. Eng., B, 2006, 130, 41–48 CrossRef CAS.
- N. Amdouni, K. Zaghib, F. Gendron, A. Mauger and C. M. Julien, Ionics, 2006, 12, 117–126 CrossRef CAS.
- X. Gou, F. Cheng, Y. Shi, L. Zhang, S. Peng, J. Chen and P. Shen, J. Am. Chem. Soc., 2006, 128, 7222–7229 CrossRef CAS.
- K. J. C. van Bommel, A. Friggeri and S. Shinkai, Angew. Chem., Int. Ed., 2003, 42, 980–999 CrossRef CAS.
- T. A. Arunkumar and A. Manthiram, Electrochem. Solid-State Lett., 2005, 8, A403–A405 CrossRef CAS.
- K. Dokko, M. Mohamedi, N. Anzue, T. Itoh and I. Uchida, J. Mater. Chem., 2002, 12, 3688–3693 RSC.
- Y. Terada, K. Yasaka, F. Nishikawa, T. Konishi, M. Yoshio and I. Nakai, J. Solid State Chem., 2001, 156, 286–291 CrossRef CAS.
- M. S. Islam, R. A. Davies and J. D. Gale, Chem. Mater., 2003, 15, 4280–4286 CrossRef CAS.
- K. Ariyoshi, Y. Iwakoshi, N. Nakayama and T. Ohzuku, J. Electrochem. Soc., 2004, 151, A296–A303 CrossRef CAS.
- Y. Xia, H. Takeshige, H. Noguchi and M. Yoshio, J. Power Sources, 1995, 56, 61–67 CrossRef CAS.
- T. Yang, N. Zhang, Y. Lang and K. Sun, Electrochim. Acta, 2011, 56, 4058–4064 CrossRef CAS.
- M. D. Chung, J. H. Seo, X. C. Zhang and A. M. Sastry, J. Electrochem. Soc., 2011, 158, A371–A378 CrossRef CAS.
- M. Kunduraci and G. G. Amatucci, Electrochim. Acta, 2008, 53, 4193–4199 CrossRef CAS.
- J. Liu and A. Manthiram, J. Phys. Chem. C, 2009, 113, 15073–15079 CAS.
Footnote |
| † Electronic Supplementary Information (ESI) available. See DOI: 10.1039/c2ra20669b/ |
| This journal is © The Royal Society of Chemistry 2012 |