Visible light induced photo-hydroxylation of phenol to catechol over RGO–Ag3VO4 nanocomposites without the use of H2O2†
D. P.
Das
*a,
R. K.
Barik
a,
J.
Das
a,
P.
Mohapatra
b and
K. M.
Parida
*a
aColloids & Materials Chemistry Department, CSIR-Institute of Minerals & Materials Technology, Bhubaneswar – 751 013, Odisha, India. E-mail: das_dipti77@yahoo.co.in (DPD); paridakulamani@yahoo.com (KMP)
bC.V. Raman College of Engineering, Bidyanagar, Mahura, Janla, Bhubaneswar –752 054, Odisha, India
First published on 21st June 2012
Abstract
RGO–Ag3VO4 nanocomposites prepared by a novel one-pot photochemical synthesis route show unusual selectivity towards catechol in the photo-hydroxylation of phenol with complete conversion.
The oxidation of phenol using hydrogen peroxide is a widely applied process for producing hydroxylated phenol. The nucleophile generated in the above process attacks the phenol nucleus leading to the formation of a phenoxide ion, which is considered as the precursor ion for the production of catechol, hydroquinone and benzoquinone. The distribution of products depends on the type of active sites and solvent used.1 Catechol is an important component of common building blocks in organic syntheses, in industrially significant flavors, fragrances and pharmaceuticals. However, hydroxylated benzene products are synthesized from phenol/chlorophenol commercially over titanium silicate as catalyst by thermal hydroxylation process in presence of H2O2. Commercially, the conversion is more than 85% and hydroquinone (p-selectivity which is commonly known as shape selectivity) selectivity is 92% with respect to phenol.2 Nowadays, there is an active search for visible light sensitive photocatalysts for the development of greener technology all around the globe. Amongst the various studied visible light active photocatalysts,3–9 graphene oxide (GO), being light weight with high surface area and processed from a cost effective synthesis route, makes it a good candidate for environmental applications,10 pollution abatement,11 or as catalytic carriers in chemical transformations.12 A number of metal oxides have been loaded onto graphene sheets13–17 for various catalytic and photocatalytic applications, but till date no photo-transformation reaction has been reported. Herein, we report for the first time the 100% phototransformation or photo-hydroxylation of phenol over a novel visible light driven catalyst: reduced graphene oxide–silver vanadate nanocomposites (RGO–Ag3VO4). The reaction has 80.23% selectivity towards catechol at room temperature under illumination of visible light within 2 h. However, in the presence of H2O2, benzoquinone is formed as the major product.
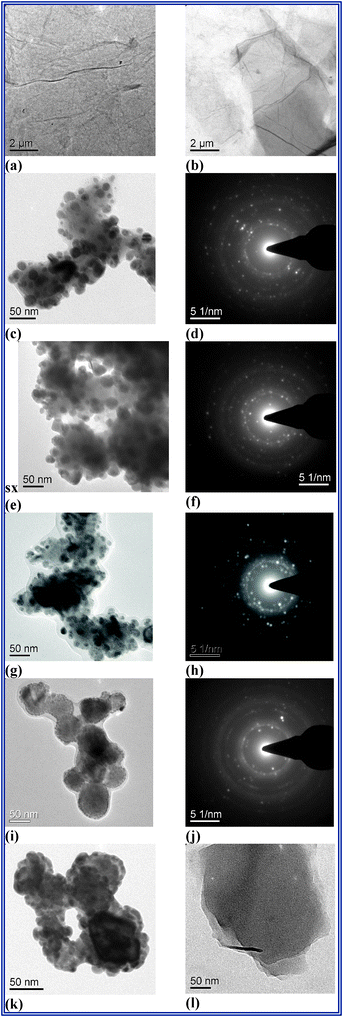
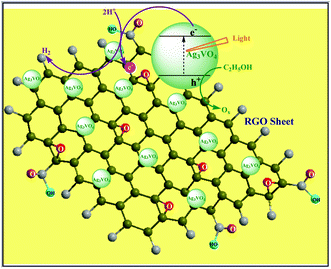
GO was synthesised by the modified Hummer's method.18 The depicted TEM images show that GO consists of one or several layers (Fig. 1(a), (b)). RGO–silver vanadate (RGO–Ag3VO4) nanocomposites were prepared in situ under irradiation of visible light. (Scheme 1, please see supporting information for details, ESI†)
 | ||
| Fig. 1 TEM micrographs of GO (a,b); TEM and SAED images of 1RGO–Ag3VO4 (c,d); TEM and SAED images of 2RGO–Ag3VO4 (e,f); TEM and SAED images of 4RGO–Ag3VO4 (g,h); TEM and SAED images of 8RGO–Ag3VO4 (i,j); TEM micrograph of pristine Ag3VO4 (k) RGO (l). | ||
 | ||
| Scheme 1 Schematic representation of RGO–silver vanadate nanocomposite preparation under visible light illumination. | ||
We observed well distributed 20–30 nm of Ag3VO4 particles on the graphene sheet for 1–2 wt.% RGO–Ag3VO4 nanocomposite, which decreases to 12–15 nm for 4 wt.% RGO–Ag3VO4 and forms agglomerated bundles of particles on the RGO sheet for 8 wt.% RGO–Ag3VO4 (Fig. 1(c), (e), (g), (i)). SAED figures confirm one or multilayer RGO sheet formation in the nanocomposites (Fig. 1(d), (f), (h), (j)).
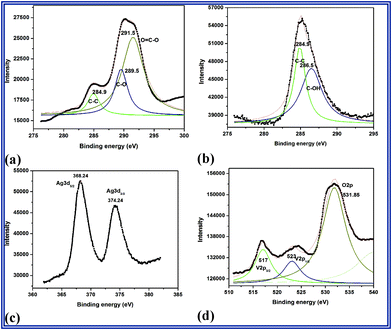
The relative intensity associated with the C–C bond is significantly more (284.9 eV) (Fig. 2(b)) as compared with GO (Fig. 2(a)). The C–O and O![[double bond, length as m-dash]](https://www.rsc.org/images/entities/char_e001.gif) C–O peaks are absent in the composite photocatalysts. Rather, the C–OH group which was absent in GO has appeared in the case of nanocomposites (Fig. 2(b)). This might be due to the photoreduction of epoxy functionality during the synthesis process. This group might be enhancing the activity of the above nanocomposites towards photo-transformation process. This suggests that GO is partly reduced with a small amount of oxygen containing groups, which is in agreement with the reports published by Fu et al. and Tang et al.19,20 Two strong peaks in the Ag region at 368.24 and 374.24 eV are assigned to Ag 3d5/2 and Ag 3d3/2, respectively where as the three peaks at 517, 523 and 531.85 eV correspond to V3p3/2, V3p1/2 and O2p respectively.21
C–O peaks are absent in the composite photocatalysts. Rather, the C–OH group which was absent in GO has appeared in the case of nanocomposites (Fig. 2(b)). This might be due to the photoreduction of epoxy functionality during the synthesis process. This group might be enhancing the activity of the above nanocomposites towards photo-transformation process. This suggests that GO is partly reduced with a small amount of oxygen containing groups, which is in agreement with the reports published by Fu et al. and Tang et al.19,20 Two strong peaks in the Ag region at 368.24 and 374.24 eV are assigned to Ag 3d5/2 and Ag 3d3/2, respectively where as the three peaks at 517, 523 and 531.85 eV correspond to V3p3/2, V3p1/2 and O2p respectively.21
 | ||
| Fig. 2 XPS spectra of C1s (a) GO (b)–(d) RGO–Ag3VO4. | ||
The results were further confirmed by the Raman spectra of GO, Ag3VO4 and RGO–Ag3VO4 nanocomposites (Fig. S3, please see ESI†), in which the features of Ag3VO4 and RGO–Ag3VO4 nanocomposites are identical from 300–1000 cm−1. The Raman shift of the D- and G-bands appears at a lower value in the case of the nanocomposites compared to GO. The D-band shifs from 1364 to 1355 cm−1 and the G-band from 1594 to 1585 cm−1, which is indicative of reduced graphene oxide.22,23 To know the extent of reduction of GO during the formation of RGO–Ag3VO4 nanocomposites, we have calculated the ratio of D to G bands (ID![[thin space (1/6-em)]](https://www.rsc.org/images/entities/char_2009.gif) :
:![[thin space (1/6-em)]](https://www.rsc.org/images/entities/char_2009.gif) IG), which was found to be 0.83 for GO and 0.92 for 4 wt.% RGO–Ag3VO4. This is an indirect indication of partial reduction of GO with few oxygen containing functionalities.
IG), which was found to be 0.83 for GO and 0.92 for 4 wt.% RGO–Ag3VO4. This is an indirect indication of partial reduction of GO with few oxygen containing functionalities.
UV-vis reflectance spectra of neat Ag3VO4 and RGO–Ag3VO4 show strong absorption in the visible region. However, the band gap energy of pristine Ag3VO4 is 2.3 eV.19 Unfortunately, the absorption of RGO–Ag3VO4 system is so strong that it covers the whole range of the visible region, thus making the calculation of band gap energy from DRS data (Fig. S4, ESI†) very tedious.
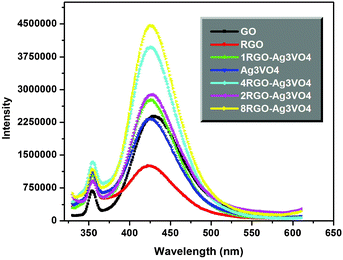
The proposed study started with the notion to investigate the photo-degradation of pollutants over the aforementioned catalysts, but while analysing the products by gas chromatography, the word “photodegradation” is dramatically transformed to “phototrasformation or photo-hydroxylation” even in the absence of any hydroxylating agents like H2O2. This photo-hydroxylation process with RGO–Ag3VO4 nanocomposites as visible light driven photocatalysts in distilled water as media is the first ever report of its kind. Table 1 shows conversion of phenol and selectivity towards catechol (CAT) and hydroquinone (HQ). A prominent enhancement in the activity of Ag3VO4 was observed with RGO loading towards catechol selectivity within 2 h of visible light illumination. This might be ascribed to the formation of more hydroxyl radicals (•OH) with an increase in the C![[thin space (1/6-em)]](https://www.rsc.org/images/entities/char_2009.gif) :
:![[thin space (1/6-em)]](https://www.rsc.org/images/entities/char_2009.gif) Ag3VO4 wt.% ratio. This is confirmed from Fig. 3, where the formation of hydroxyl radical on the surface of the catalysts was detected by PL spectra. Terephthalic acid (TA) was used here as probe molecule which readily reacts with •OH to form a highly fluorescent product ca. 2-hydroxyterephthalic acid (TAOH) (details of the procedure are available in the ESI†).24 The PL intensity of TAOH is proportional to the amount of •OH produced on the surface of the nanocomposites. The emission intensity in the PL spectra was centered at 425 nm upon excitation at 315 nm. The RGO sheets are known to accept electrons easily during the photo-hydroxylation process over the RGO–Ag3VO4 nanocomposites in an aqueous medium, forming the superoxide radical anion (O2•−), which might be subsequently getting transformed to a hydroxyl radical (•OH), thus facilitating the hydroxylation reaction. The synergy effects, in total, enhance the activity of nanocomposites to extra-ordinary node by retiring electron–hole recombination effectively. Table 1 shows 100% conversion of phenol with 80.38% CAT selectivity over 4RGO–Ag3VO4 catalyst which seems quite unexpected in the absence of hydrogen peroxide. Table 1 adds the experimental results of conversion over graphite, GO, RGO, 4GN–Ag3VO4 and without catalyst as well under similar parametric conditions. As observed from Table 1, 4GN–Ag3VO4 exhibits 70.24% conversion, which is low compared to the 4RGO–Ag3VO4 nanocomposite which was prepared by an in situ reduction dispersed GO photoirradiation process. The reason might be due to the incomplete nanocomposite formation in the former case. This is again supported by the ICP-OES data of the filtrate after photohydroxylation reactions over both the catalysts, which shows 2.52 and 0% leaching of V+5, respectively (Table S1). The recyclability of the catalyst was investigated by simply centrifuging, drying and reusing the catalyst for regular experiments. The activity and selectivity remains the same upto the 4th run. The reused catalysts were characterised by Raman studies which shows no structural change (Fig. S5, ESI†). It is a general trend of the metal vanadates to leach under photo-illumination. The filtrate after the photo-hydroxylation process was subject to ICP-OES and leaching was not observed. This confirms the xRGO–Ag3VO4 composites are stable under the reaction conditions.
Ag3VO4 wt.% ratio. This is confirmed from Fig. 3, where the formation of hydroxyl radical on the surface of the catalysts was detected by PL spectra. Terephthalic acid (TA) was used here as probe molecule which readily reacts with •OH to form a highly fluorescent product ca. 2-hydroxyterephthalic acid (TAOH) (details of the procedure are available in the ESI†).24 The PL intensity of TAOH is proportional to the amount of •OH produced on the surface of the nanocomposites. The emission intensity in the PL spectra was centered at 425 nm upon excitation at 315 nm. The RGO sheets are known to accept electrons easily during the photo-hydroxylation process over the RGO–Ag3VO4 nanocomposites in an aqueous medium, forming the superoxide radical anion (O2•−), which might be subsequently getting transformed to a hydroxyl radical (•OH), thus facilitating the hydroxylation reaction. The synergy effects, in total, enhance the activity of nanocomposites to extra-ordinary node by retiring electron–hole recombination effectively. Table 1 shows 100% conversion of phenol with 80.38% CAT selectivity over 4RGO–Ag3VO4 catalyst which seems quite unexpected in the absence of hydrogen peroxide. Table 1 adds the experimental results of conversion over graphite, GO, RGO, 4GN–Ag3VO4 and without catalyst as well under similar parametric conditions. As observed from Table 1, 4GN–Ag3VO4 exhibits 70.24% conversion, which is low compared to the 4RGO–Ag3VO4 nanocomposite which was prepared by an in situ reduction dispersed GO photoirradiation process. The reason might be due to the incomplete nanocomposite formation in the former case. This is again supported by the ICP-OES data of the filtrate after photohydroxylation reactions over both the catalysts, which shows 2.52 and 0% leaching of V+5, respectively (Table S1). The recyclability of the catalyst was investigated by simply centrifuging, drying and reusing the catalyst for regular experiments. The activity and selectivity remains the same upto the 4th run. The reused catalysts were characterised by Raman studies which shows no structural change (Fig. S5, ESI†). It is a general trend of the metal vanadates to leach under photo-illumination. The filtrate after the photo-hydroxylation process was subject to ICP-OES and leaching was not observed. This confirms the xRGO–Ag3VO4 composites are stable under the reaction conditions.
 | ||
| Fig. 3 Fluorescence spectra measured during illumination in 4 × 10⁻³ M NaOH solution of terephthalic acid (excitation at 315 nm). | ||
| Catalyst | Conversion (%) | Selectivity (%) | |
|---|---|---|---|
| CAT | HQ | ||
| a Reaction conditions: [catalyst] = 2 g L−1, [phenol] = 20 mg L−1, VIS light irradiation time = 2 h. b Details of preparation are available in the ESI.† | |||
| No catalyst | 0 | – | – |
| Graphite | 0 | – | – |
| GO | 0 | ||
| RGO | 0 | – | – |
| Ag3VO4 | 18.82 | – | 90 |
| 1RGO–Ag3VO4 | 36.47 | 32.9 | 67.1 |
| 2RGO–Ag3VO4 | 66 | 40.25 | 59.75 |
| 4RGO–Ag3VO4 | 100 | 80.23 | 19.77 |
| 8RGO–Ag3VO4 | 100 | 89.38 | 10.62 |
| 4GN–Ag3VO4b | 70.24 | 50.49 | 49.51 |
In summary, a novel one-pot photochemical synthesis method was reported here for RGO–Ag3VO4 nanocomposites. “Phototransformation” or “photo-hydroxylation” of phenol was investigated over the catalysts under visible light illumination. Complete conversion was achieved over 4 wt.% C![[thin space (1/6-em)]](https://www.rsc.org/images/entities/char_2009.gif) :
:![[thin space (1/6-em)]](https://www.rsc.org/images/entities/char_2009.gif) Ag3VO4 ratio with 80.23% catechol with excellent reusability. A green process could be formulated for commercial synthesis of catechol over the said photocatalyst.
Ag3VO4 ratio with 80.23% catechol with excellent reusability. A green process could be formulated for commercial synthesis of catechol over the said photocatalyst.
Financial support by DST (Fast Track Scheme, SR/FT/CS-98/2010), Government of India and Council of Scientific and Industrial Research (CSIR) for EMPOWER scheme and the support and keen interest of Prof. B. K. Mishra, Director, CSIR-IMMT in carrying out the work is highly acknowledged.
References
- (a) A. Thangaraj, R. Kumar and P. Ratnasamy, J. Catal., 1991, 131, 294 CrossRef CAS; (b) A. Thangaraj, R. Kumar, S.P. Marajkar and P. Ratnasamy, J. Catal., 1991, 130, 1 CrossRef CAS.
- G. Bellussi and C. Perego, in: Handbook of Heterogeneous Catalysis, ed. G. Ertl, H. Knozinger and J. Weitkamp, vol. 5, Wiley, Poiters (France), 1997, p. 2329 Search PubMed.
- Z. G. Zou, J. H. Ye and H. Arakawa, J. Phys. Chem. B, 2002, 106, 517 CrossRef CAS.
- S. Tokunaga, H. Kato and A. Kudo, Chem. Mater., 2001, 13, 4624 CrossRef CAS.
- H. Xu, H. M. Li, C. D. Wu, J. Y. Chu, Y. S. Yan, H. M. Shu and Z. Gu, J. Hazard. Mater., 2008, 153, 877 CrossRef CAS.
- B. Naik, K. M. Parida and G. C. Behera, ChemCatChem, 2011, 3, 311 CrossRef CAS.
- H. B. Fu, C. S. Pan, W. Q. Yao and Y. F. Zhu, J. Phys. Chem. B, 2005, 109, 22432 CrossRef CAS.
- Y. X. Zhou, H. B. Yao, Q. Zhang, J. Y. Gong, S. J. Liu and S. H. Yu, Inorg. Chem., 2009, 48, 1082 CrossRef CAS.
- I. S. Cho, S. Lee, J. H. Noh, G. K. Choi, H. S. Jung, D. W. Kim and K. S. Hong, J. Phys. Chem. C, 2008, 112, 18393 CAS.
- S. T. Yang, Y. L. Chang, H. F. Wang, G. B. Liu, S. Chen, Y. W. Wang, Y. F. Liu and A. N. Cao, J. Colloid Interface Sci., 2010, 351, 122 CrossRef CAS.
- T. Y. Zhang, D. Zhang and M. Shen, Mater. Lett., 2009, 63, 2051 CrossRef CAS.
- S. Bong, Y. R. Kim, I. Kim, S. Woo, S. Uhm, J. Lee and H. Kim, Electrochem. Commun., 2010, 12, 129 CrossRef CAS.
- C. Chen, W. M. Cai, M. C. Long, B. X. Zhou, Y. H. Wu, D. Y. Wu and Y. J. Feng, ACS Nano, 2010, 4, 6425 CrossRef CAS.
- O. Akhavan, Carbon, 2011, 49, 11 CrossRef CAS.
- S. Chen, J. W. Zhu, X. D. Wu, Q. F. Han and X. Wang, ACS Nano, 2010, 4, 2822 CrossRef CAS.
- V. K. Singh, M. K. Patra, M. Manoth, G. S. Gowd, S. R. Vadera and N. Kumar, New Carbon Mater., 2009, 24, 147 CrossRef CAS.
- Q. Xiang, J. Yu and M. Jaroniec, Chem. Soc. Rev., 2012, 41, 782 RSC and references therein.
- W. Hummers and R. Offeman, J. Am. Chem. Soc., 1958, 80, 1339 CrossRef CAS.
- (a) Y. Fu and X. Wang, Ind. Eng. Chem. Res., 2011, 50(12), 7210 CrossRef CAS; (b) X.-Z. Tang, Z. Cao, H.-B. Zhang, J. Liua and Z.-Z. Yu, Chem. Commun., 2011, 47, 3084 RSC.
- J.-M. Song, Y.-Z. Lin, H.-B. Yao, F.-J. Fan, X.-G. Li and S.-H. Yu, ACSNano, 2009, 3, 653 CrossRef CAS.
- S. Stankovich, D. A. Dikin, R. D. Piner, K. A. Kohlhaas, A. Kleinhammes, Y. Jia, Y. Wu, S. T. Nguyen and R. S. Ruoff, Carbon, 2007, 45, 1558 CrossRef CAS.
- T. N. Lambert, C.A. Chavez, B. Hernandez-Sanchez, P. Lu, N. S. Bell, A. Ambrosini, T. Friedman, T. J. Boyle, D. R. Wheeler and D. L. Huber, J. Phys. Chem. C, 2009, 113, 19812 CAS.
- H. Xu, H. Li, L. Xu, C. Wu, G. Sun, Y. Xu and J. Chu, Ind. Eng. Chem. Res., 2009, 48, 10771 CrossRef CAS.
- F. Xu, Y. Yuan, H. Han, D. Wu, Z. Gaoab and K. Jiang, CrystEngComm, 2012, 14, 3615 RSC.
Footnote |
| † Electronic Supplementary Information (ESI) available: Materials & methods, XRD pattern of nanocomposites, Raman spectra, DRUV-vis spectra, ICP-OES data and instrumental set up for the phototransformation reaction. See DOI: 10.1039/c2ra20703f/ |
| This journal is © The Royal Society of Chemistry 2012 |
