Nanocomposites of hematite (α-Fe2O3) nanospindles with crumpled reduced graphene oxide nanosheets as high-performance anode material for lithium-ion batteries†
Song
Bai
a,
Shuangqiang
Chen
b,
Xiaoping
Shen
*a,
Guoxing
Zhu
a and
Guoxiu
Wang
b
aSchool of Chemistry and Chemical Engineering, Jiangsu University, Zhenjiang, 212013, China. E-mail: xiaopingshen@163.com; Fax: (+86) 511-88791800; Tel: (+86) 511-88791800
bSchool of Chemistry and Forensic Science, University of Technology, Sydney, NSW 2007, Australia
First published on 17th September 2012
Abstract
Nanocomposites of Fe2O3 nanospindles with crumpled reduced graphene oxide (RGO) nanosheets were prepared using a facile solvothermal synthesis method. The RGO-Fe2O3 nanocomposite with about 24.4 wt% RGO demonstrated an excellent electrochemical performance as a promising anode material for lithium-ion batteries (LIBs), which achieved a high reversible capacity of 969 mA h g−1 after 100 cycles at a current density of 100 mA g−1 (0.1 C). Furthermore, it also exhibited a large capacity of 336 mA h g−1 after 100 cycles at the high rate of 5 C. The cycling performance and reversible capacities of the RGO-Fe2O3 composites were much better than those of bare Fe2O3 nanospindles and pure RGO nanosheets, as well as previously reported RGO-Fe2O3 nanocomposites. The enhanced performance towards lithium storage can be ascribed to the crumpled RGO nanosheets, which may act as efficient volume buffer and electron conductor in the composites. The strategy proposed here could be extended to produce other nanocomposites based on crumpled graphene nanosheets for various applications.
1. Introduction
Lithium-ions batteries (LIBs), a lithium ion-induced device for electricity supply, have received intensive research interest due to the increasing demands on portable high-performance energy storage devices.1,2 Graphite is usually employed as anode material for LIBs, which can deliver a maximum theoretical lithium storage capacity of 372 mA h g−1. In order to improve the performance of LIBs, researchers have made great efforts to explore alternative anode materials with higher capacities. Recently, graphene, a two-dimensional material with a monolayer or a few layers (<10) of carbon atoms, has been reported to show higher lithium storage capacity owing to its large surface-to-volume ratio and highly conductive nature.3 Furthermore, enhanced cycling performance and lithium storage capacity could also be achieved with the nanocomposites of graphene and other inorganic compounds as the anode materials.4 Nowadays, a wide range of nanomaterials such as metal,5,6 nonmetal elements,7,8 metal oxides,9–11 hydroxides12,13 and chalcogenides14,15 have been integrated with graphene for application as anode materials in LIBs. In these composites, graphene nanosheets not only prevent the aggregation of functional components, but also have effective synergetic effect with other components, resulting in enhanced performance in LIBs.Hematite (α-Fe2O3), an important transition metal oxide, has attracted much attention as an anode material of LIBs due to its high specific capacity, low cost and environmental friendliness.16,17 However, the low electrical conductivity and inferior cycling stability during Li+ insertion/extraction processes restrict its practical application. It is believed that the introduction of graphene could provide highly conductive channels for electron transport and form well-defined nanopores for fast ion diffusion.18 Meanwhile, the surrounding graphene cushions the volume expansion of the anode material upon lithium insertion. The developed nanopores could be used as buffer spaces during charge-discharge, resulting in superior cycling performances.19 Therefore, the syntheses of graphene-based Fe2O3 composites for enhanced Li+ storage have recently been reported by several groups.20–23 However, these synthesis methods were complicated, often involving a multi-step approach with the processes of reduction of graphene oxide (GO) and subsequent growth of detached Fe2O3 as well as the use of toxic reductants. Furthermore, the obtained composites are often with flat graphene nanosheets supporting Fe2O3 nanoparticles, which is not ideal for maximizing the surface area of the nanocomposites and buffering the huge volume expansion.
In this paper, we report a one-step solvothermal method to synthesize graphene-Fe2O3 nanocomposites with different loadings of Fe2O3 nanospindles. The method is environmentally-friendly and highly-efficient, and with the reduction of GO and the growth of Fe2O3 simultaneously. The Fe2O3 nanospindles were loaded well with the naturally crumpled reduced graphene oxide (RGO) nanosheets in the as-obtained composites. When applied as anode materials for LIBs, the RGO-Fe2O3 composites exhibited highly enhanced reversible capacities and better cycling performances than those of bare Fe2O3 nanospindles and pure RGO nanosheets.
2. Experimental
2.1 Materials
Natural flake graphite was purchased from Qingdao Guyu graphite Co., Ltd. with a particle size of 150 μm. All other chemicals were of analytical grade and used without further purification.2.2 Preparation of graphite oxide
Graphite oxide was synthesized from natural flake graphite by a modified Hummers method.24 In a typical procedure, 2.0 g graphite powder was added to a cold (0 °C) concentrated H2SO4 (100 mL) and NaNO3 (4.0 g) solution in a 500 mL flask. Under vigorous stirring, KMnO4 (10.0 g) was added gradually and the temperature of the mixture was kept below 10 °C. The reaction mixture was stirred at 35 °C for 2 h until it became pasty brownish, and then diluted with de-ionized water (100 mL). The addition of water was performed in an ice bath to keep the temperature below 100 °C. Then, the mixture was stirred for 30 min and 20 mL of 30 wt% H2O2 was slowly added to the mixture to reduce the residual KMnO4, after which the color of the mixture changed to brilliant yellow. The mixture was filtered and washed with 5% HCl aqueous solution (800 mL) to remove metal ions, followed by 1.0 L de-ionized water to remove the acid. The resulting solid was centrifuged and dried at 60 °C for 24 h. For further purification, the as-obtained graphite oxide was re-dispersed in de-ionized water and then dialyzed for one week to remove residual salts and acids.2.3 Preparation of RGO-Fe2O3 nanocomposites
A typical procedure for preparing RGO-Fe2O3 nanocomposites is as follows: 1.0 g Fe(NO3)3·9H2O and 100 mg graphite oxide were dispersed in 20 mL de-ionized water by ultrasonication for 30 min to form a solution A. 10 mL NH3·H2O was dissolved in 10 mL ethylene glycol (EG) to form a solution B, which was then added dropwise into the solution A. The mixture was stirred for 30 min at room temperature and then transferred to a 50 mL Teflon-lined stainless steel autoclave and heated to 200 °C for 10 h. After the autoclave had cooled down to room temperature, the resultant black product was separated by centrifuging, washed with de-ionized water and ethanol several times, and dried at 45 °C in a vacuum oven. RGO-Fe2O3 nanocomposites with different Fe2O3 loadings were obtained by adjusting the Fe3+ ion concentration with all other parameters unchanged. For comparison, bare Fe2O3 without GO and pure RGO were also prepared under the same experimental conditions. CMK-Fe2O3 nanocomposite was prepared with the same procedure except that 60 mg mesoporous carbon (CMK-3) was used to substitute 100 mg of graphite oxide in the comparative experiment (100 mg of graphite oxide could be reduced to about 60 mg of RGO).2.4 Characterization
Power X-ray diffraction (XRD) measurements were carried out on an X-ray diffractometer (Bruker D8 Advance diffractometer) with Cu-Kα radiation. Raman spectra were measured at room temperature using a DXR Raman microscope with 514.5 nm excitation source from an Ar+ laser. The X-ray photoelectron spectroscopy (XPS) measurements were performed on a PHI 5000 VersaProbe. The morphology, size and composition of the products were examined by a transmission electron microscope (TEM, JEOL JEM-2100) and a field emission scanning electron microscope (FESEM, JSM-7001) equipped with an energy-dispersive X-ray spectrometer (EDS). TGA analysis was conducted by an integrated thermal analyzer (STA 449C) with a heating rate of 10 °C min−1 in air. The electrical conductivity was measured by a RTS-9 four-point probe test system at room temperature.2.5 Electrochemical measurements
The working electrodes were made by dispersing 80 wt% (weight percent) active material, 10 wt% conductive agent (acetylene black), and 10 wt% binder (polyvinylidene difluoride) in n-methyl pyrrolidinone (NMP) solvent. Then, the working electrodes were dried in a vacuum oven. Coin cells with a diameter of 12 mm were assembled in an argon-filled glove box (Mbraun, Unilab, Germany), in which both the moisture and oxygen contents were controlled to be less than 0.1 ppm. Lithium foil was used as the counter electrode, and the electrolyte was 1 M LiPF6 in a 1![[thin space (1/6-em)]](https://www.rsc.org/images/entities/char_2009.gif) :
:![[thin space (1/6-em)]](https://www.rsc.org/images/entities/char_2009.gif) 1 (weight ratio) mixture of ethylene carbonate and diethyl carbonate. Electrochemical measurements were performed in a LAND-CT2001C battery test system. The cells were discharged and charged galvanostatically in the fixed voltage range of 0.005–3.0 V with a current density of 100 mA h g−1 (0.1 C). High rates (0.5 C, 1 C or 5 C) were also used to test the materials' properties at high current densities. Cyclic voltammetry was performed on a CHI660D electrochemical workstation at a scan rate of 0.1 mV s−1.
1 (weight ratio) mixture of ethylene carbonate and diethyl carbonate. Electrochemical measurements were performed in a LAND-CT2001C battery test system. The cells were discharged and charged galvanostatically in the fixed voltage range of 0.005–3.0 V with a current density of 100 mA h g−1 (0.1 C). High rates (0.5 C, 1 C or 5 C) were also used to test the materials' properties at high current densities. Cyclic voltammetry was performed on a CHI660D electrochemical workstation at a scan rate of 0.1 mV s−1.
3. Results and discussion
3.1 Preparation and characterization of RGO-Fe2O3 nanocomposites
The typical XRD patterns and Raman spectra of the as-prepared graphite oxide, RGO, bare Fe2O3 and RGO-Fe2O3 nanocomposite are shown in Fig. 1. As shown in Fig. 1a, graphite oxide shows a strong diffraction peak centered at 2θ = 10.2°, corresponding to the (001) reflection. In the XRD pattern of RGO nanosheets, the disappearance of the peak at 2θ = 10.2° confirms that graphite oxide has been flaked to GO and then successfully reduced into RGO nanosheets. The diffraction peaks of RGO-Fe2O3 nanocomposite match well with bare Fe2O3. The peaks at 2θ values of 24.2° (012), 33.2° (104), 35.7° (110), 40.9° (113), 49.5° (024), 54.0° (116), 62.5° (214), 64.1° (300) and 72.0° (1010) can be indexed to the rhombohedral phase of hematite (α-Fe2O3, JCPDS No. 79-0007).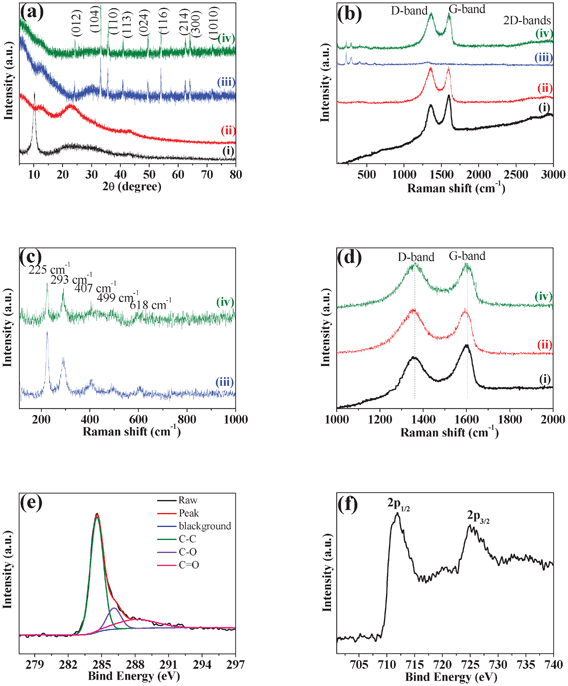 | ||
| Fig. 1 (a) XRD patterns and (b) Raman spectra of (i) graphite oxide, (ii) RGO, (iii) bare Fe2O3 and (iv) RGO-Fe2O3 nanocomposite. (c) Enlarged view of the Raman spectra of bare Fe2O3 and RGO-Fe2O3 nanocomposite in the range of 100–1000 cm−1. (d) Enlarged view of the Raman spectra of graphite oxide, RGO and RGO-Fe2O3 nanocomposite in the range of 1000–2000 cm−1. (e, f) XPS spectra of C 1s (e) and Fe 2p (f) for RGO-Fe2O3 nanocomposite. | ||
Raman spectra of graphite oxide, RGO, bare Fe2O3, and RGO-Fe2O3 nanocomposite are presented in Fig. 1b. RGO-Fe2O3 nanocomposite shows several weak peaks in the range of 100–1000 cm−1, and two prominent D and G peaks in the range 1000–2000 cm−1 as well as 2D and D+G bands at about 2700 and 2900 cm−1, respectively. In the range of 100–1000 cm−1, the bands of RGO-Fe2O3 at 225, 293, 407, 499 and 618 cm−1 can also be identified in the spectrum of bare Fe2O3 (Fig. 1c). These peak positions are in good agreement with that of the α-Fe2O3 phase. The Raman peaks at 225 and 499 cm−1 are attributed to the A1g mode of α-Fe2O3, and those at 293, 407 and 618 cm−1 are attributed to the Eg mode of α-Fe2O3. The Raman spectra of graphite oxide, RGO and RGO-Fe2O3 nanocomposite display two prominent peaks at ∼1357 and ∼1605 cm−1, corresponding to the well-documented D band and G band, respectively (Fig. 1d). The G band is usually assigned to the E2g mode observed for C sp2 carbon domains, while the D band is associated with structural defects and disorders that can break the symmetry and selection rule.25 The intensity ratio of D band to G band (ID/IG) is usually used as a measure of the disorder.26 Compared with graphite oxide (0.85), the ID/IG of RGO (1.01) and RGO-Fe2O3 (1.01) show increased values, indicating that more disordered carbon structures were produced after the exfoliation and reduction of graphite oxide.
The XPS spectrum (Fig. S1, ESI†) of the RGO-Fe2O3 nanocomposite displays the peaks of C 1s (284.6 eV), O 1s (531.2 eV), and Fe 2p. The C 1s XPS spectra (Fig. 1e) could be deconvoluted into three peaks at 284.6 eV, 286.2 eV and 288.1 eV. The binding energy at 284.6 eV could be assigned to the C–C bond (sp2) of RGO. The peak at 286.2 eV is ascribed to the C–O bond, while the peak at 288.1 eV is related to the C![[double bond, length as m-dash]](https://www.rsc.org/images/entities/char_e001.gif) O bond. Compared with the C–C peak, the lower intensities of C–O and C
O bond. Compared with the C–C peak, the lower intensities of C–O and C![[double bond, length as m-dash]](https://www.rsc.org/images/entities/char_e001.gif) O peaks in the nanocomposite suggest that most of the oxygen-containing functional groups have been removed after the reduction process. The XPS spectrum of Fe 2p in Fig. 1f shows the Fe 2p1/2 peak at 711.6 eV as well as the Fe 2p3/2 peak at 725.3 eV, which is also consistent with hematite phase.27,28
O peaks in the nanocomposite suggest that most of the oxygen-containing functional groups have been removed after the reduction process. The XPS spectrum of Fe 2p in Fig. 1f shows the Fe 2p1/2 peak at 711.6 eV as well as the Fe 2p3/2 peak at 725.3 eV, which is also consistent with hematite phase.27,28
In the solvothermal process, the reduction of GO and the growth of Fe2O3 nanoparticles occurred simultaneously. Fig. 2 illustrates the entire process. In the mixed aqueous dispersion of GO and Fe(NO3)3, some Fe3+ ions are attracted by negatively charged oxygen-containing groups on GO through electrostatic interaction and serve as nucleation sites.29 The reaction between Fe3+ and NH3·H2O produces Fe(OH)3 after the addition of the mixed solution of NH3·H2O and EG. During the stirring process, the active seeding sites on the GO surface initiated the nucleation of Fe(OH)3 nanoparticles, and EG could prevent the Fe(OH)3 nanoparticles from agglomerating. When the solution mixture was transferred to the autoclave and heated at 200 °C, the Fe(OH)3 nanoparticles first grew and crystallized to form β-FeOOH. After that, the β-FeOOH was transformed to α-Fe2O3 during the extended reaction time.30 On the other hand, the GO nanosheets were reduced by EG as the reducing agent. The remanent NH3·H2O could alter the alkalinity and further assists the reduction process under the solvothermal conditions.31 This method does not use hazardous reductants, and is efficient in mass production. The reactions can be expressed as:
| Fe3+ + 3NH3·H2O → Fe(OH)3 + 3NH4+ | (1) |
| Fe(OH)3 → β-FeOOH → α-Fe2O3 | (2) |
| CH2OH–CH2OH → CH3CHO + H2O | (3) |
| CH3CHO + GO → RGO + H+ + CH3COOH | (4) |
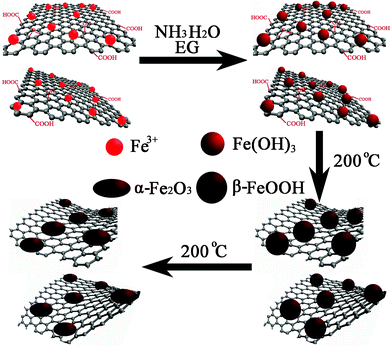 | ||
| Fig. 2 Schematic illustration for the synthesis of RGO-Fe2O3 nanocomposites. | ||
Fig. 3 shows the typical FESEM and TEM images of RGO-Fe2O3 nanocomposite. From the low-magnification FESEM image (Fig. 3a), it can be clearly seen that the nanocomposite consists of many Fe2O3 nanoparticles and RGO nanosheets. The RGO nanosheets were naturally crumpled and curved with petal-like shapes. The Fe2O3 nanoparticles were densely and freely dispersed on the RGO nanopetals. The high-magnification image (Fig. 3b) shows that the Fe2O3 nanoparticles were of spindle shapes. Some Fe2O3 nanospindles were supported by RGO nanosheets, while others were wrapped in RGO nanosheets, just like the rice-hull structure with parts of the hulls destroyed and their rice exposed in a pile of unhusked rice. The low-magnification TEM image (Fig. 3c) shows the well combined Fe2O3 nanospindles and RGO nanosheets. The nanospindles were firmly attached to the RGO nanosheets with no nanospindles outside of the RGO nanosheets or large areas of RGO nanosheets without nanospindle decoration. Fig. 3d shows the high-magnification TEM image of RGO-Fe2O3 nanocomposite. The average size of Fe2O3 nanospindles along its major axis is about 120 nm and along its minor axis is approximately 60 nm with its length-to-width ratio of about two. The crumpled RGO nanosheets were also seen clearly in the TEM image. In the high-resolution TEM (HRTEM) image (Fig. 3e) of part of an area of one Fe2O3 nanospindle in Fig. 3d, the lattice fringes show a spacing of 0.250 nm, which can be indexed to the (110) plane of rhombohedral α-Fe2O3.
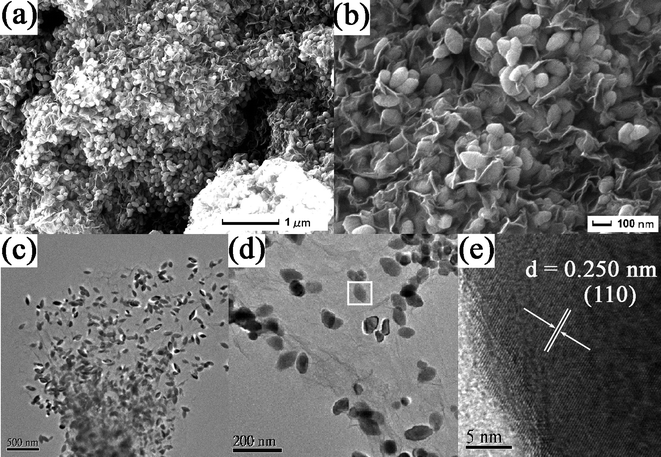 | ||
| Fig. 3 (a, b) FESEM and (c, d) TEM images of RGO-Fe2O3 nanocomposite. (e) HRTEM image of part of an area of a selected Fe2O3 nanospindle in (d). | ||
FESEM images in Fig. 4 and Fig. S2 (see ESI†) show the surface morphologies of RGO, bare Fe2O3 nanospindles, and two RGO-Fe2O3 nanocomposites with high and low Fe2O3 loading, respectively. The as-synthesized pure RGO nanosheets were also crumpled and scrolled with the same morphology as the RGO in the nanocomposites, showing that the corrugation is the intrinsic nature of RGO nanosheets obtained from this solvothermal method, rather than the result of the intercalation of Fe2O3 nanospindles (Fig. 4a and Fig. S2a in ESI†). Furthermore, comparing the morphology of bare RGO and RGO-Fe2O3 composite (Fig. 3a,b), it can be clearly seen that the insertion of Fe2O3 nanospindles can effectively prevent the aggregation of the RGO nanosheets, and also enable the formation of more and larger nanopores. The bare Fe2O3 nanospindles in Fig. 4b (and Fig. S2b in ESI†) have the same morphology as the Fe2O3 in the composites, showing that the introduction of GO has little effect on the formation of Fe2O3 nanospindles. In the presence of GO, the nanocomposites with high (RGO-Fe2O3-H, Fig. 4c) and low (RGO-Fe2O3-L, Fig. 4d) Fe2O3 loadings were obtained by adjusting the initial weight ratio of Fe(NO3)3·9H2O![[thin space (1/6-em)]](https://www.rsc.org/images/entities/char_2009.gif) :
:![[thin space (1/6-em)]](https://www.rsc.org/images/entities/char_2009.gif) GO (10
GO (10![[thin space (1/6-em)]](https://www.rsc.org/images/entities/char_2009.gif) :
:![[thin space (1/6-em)]](https://www.rsc.org/images/entities/char_2009.gif) 1 for RGO-Fe2O3-H; 5
1 for RGO-Fe2O3-H; 5![[thin space (1/6-em)]](https://www.rsc.org/images/entities/char_2009.gif) :
:![[thin space (1/6-em)]](https://www.rsc.org/images/entities/char_2009.gif) 1 for RGO-Fe2O3-L) under the same experimental conditions. The difference in the loading amount can be clearly seen from the FESEM images. Interestingly, from the high-magnification FESEM images (Fig. S2c, d, ESI†), we also found that the size of Fe2O3 nanospindles in the RGO-Fe2O3-H was smaller than that of RGO-Fe2O3-L. A possible explanation is that the higher concentration of Fe3+ led to the formation of a larger amount of Fe(OH)3 nuclei in the initial phase, which consumed more Fe3+ and prevented the further growth of Fe(OH)3 nanoparticles, thus resulting in the smaller size of Fe2O3 nanospindles. The compositions of the two RGO-Fe2O3 nanocomposites were measured by EDS (Fig. S3, ESI†). The C, O and Fe elements were present in the composites. As shown in Fig. 5, the RGO contents were determined by TGA to be about 24.4 wt% and 33.5 wt% for RGO-Fe2O3-H and RGO-Fe2O3-L, respectively. These values were generally consistent with the theoretical values (23.3 wt% RGO for RGO-Fe2O3-H and 37.8 wt% RGO for RGO-Fe2O3-L) of the two nanocomposites (according to our comparative experiments, 100 mg of GO could be reduced to about 60 mg of RGO).
1 for RGO-Fe2O3-L) under the same experimental conditions. The difference in the loading amount can be clearly seen from the FESEM images. Interestingly, from the high-magnification FESEM images (Fig. S2c, d, ESI†), we also found that the size of Fe2O3 nanospindles in the RGO-Fe2O3-H was smaller than that of RGO-Fe2O3-L. A possible explanation is that the higher concentration of Fe3+ led to the formation of a larger amount of Fe(OH)3 nuclei in the initial phase, which consumed more Fe3+ and prevented the further growth of Fe(OH)3 nanoparticles, thus resulting in the smaller size of Fe2O3 nanospindles. The compositions of the two RGO-Fe2O3 nanocomposites were measured by EDS (Fig. S3, ESI†). The C, O and Fe elements were present in the composites. As shown in Fig. 5, the RGO contents were determined by TGA to be about 24.4 wt% and 33.5 wt% for RGO-Fe2O3-H and RGO-Fe2O3-L, respectively. These values were generally consistent with the theoretical values (23.3 wt% RGO for RGO-Fe2O3-H and 37.8 wt% RGO for RGO-Fe2O3-L) of the two nanocomposites (according to our comparative experiments, 100 mg of GO could be reduced to about 60 mg of RGO).
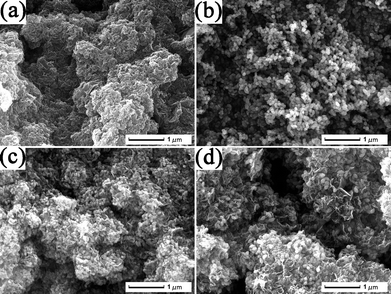 | ||
| Fig. 4 FESEM images of (a) RGO, (b) bare Fe2O3, and (c, d) RGO-Fe2O3 nanocomposites with high (c) and low (d) Fe2O3 loadings. | ||
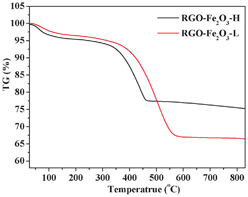 | ||
| Fig. 5 TGA curves of RGO-Fe2O3-H and RGO-Fe2O3-L nanocomposites. | ||
3.2 Lithium storage properties of RGO-Fe2O3 nanocomposites
The electrochemical reactivity of RGO-Fe2O3 nanocomposite as the anode in LIBs was first evaluated by cyclic voltammetry (CV) at a scan rate of 0.1 mV s−1. The CV curves of RGO-Fe2O3-H composite in the first and second scanning cycles are shown in Fig. 6a. There are two main cathodic peaks at ∼1.45 and ∼0.64 V and one broad anodic peak at ∼1.8 V in the first cycle, while the second cycle showed the migration of oxidation and reduction peaks, which may be related to the formation of a stable solid electrolyte interface (SEI). The cathodic peaks are ascribed to the stepwise reduction of Fe3+ by Li to Fe and the irreversible reaction with the electrolyte, while the anodic peak corresponded to the reversible oxidation of Fe.32,33 There is one broad peak, which can also be observed in the second cycle in the last section of cathodic process. The broad peak below 0.5 V may be contributed to by the matrix (RGO nanosheets), related to the Li+ ions insertion in the RGO nanosheets.34,35 The behaviour of the two cycles indicated the formation of an electrolyte interface (SEI) film. A similar reaction happened to the composite of RGO-Fe2O3-L with less sharp oxidation and reduction peaks. The electrochemical reaction mechanism of Li-ion reactions with Fe2O3 anodes can be described by the following equation. | (5) |
 | ||
| Fig. 6 (a) Cyclic voltammetry of RGO-Fe2O3-H and RGO-Fe2O3-L nanocomposites for the first two cycles with a scan rate of 0.1 mV s−1. (b) Charge-discharge profiles of RGO-Fe2O3-H, RGO-Fe2O3-L, bare Fe2O3 nanospindles, bare RGO nanosheets and CMK-Fe2O3 for the first cycle at a current density of 100 mA g−1 (0.1 C). (c) The cycling performance of RGO-Fe2O3-H, RGO-Fe2O3-L, bare Fe2O3 nanospindles and bare RGO nanosheets at 0.1 C. (d) The charge-discharge profiles of RGO-Fe2O3-H and RGO-Fe2O3-L composites for the 1st, 50th and 100th cycles at 0.1 C. | ||
Fig. 6b shows the initial discharge and charge curves of RGO-Fe2O3-H, RGO-Fe2O3-L, bare Fe2O3 nanospindles and bare RGO nanosheets at a constant current (100 mA g−1, 0.1 C) with the fixed voltage of 5 mV–3.0 V. The two voltage plateaus (∼1.62 V vs. Li+/Li in charge curves; ∼0.86 V vs. Li+/Li in discharge curves) agreed well with the CV results of Fig. 6a. The long plateaus at ∼0.86 V are largely due to the reduction of Fe3+ to Fe.33,36 The RGO-Fe2O3-H and RGO-Fe2O3-L composite materials exhibited reversible charge capacities of 1556 and 984 mA h g−1 with initial Coulomb efficiencies of 70.8% and 50.8%, respectively. While the bare Fe2O3 nanospindles and bare RGO nanosheets as the anode materials showed reversible specific capacities of 1135 and 261 mA h g−1 with initial Coulomb efficiencies of 72.1% and 32.5%, respectively. There are large irreversible capacity losses in the first cycle for RGO-Fe2O3-L composite and bare RGO, while the RGO-Fe2O3-H composite and bare Fe2O3 nanospindles exhibited high Coulombic efficiencies.
Fig. 6c shows the cycling performance of RGO-Fe2O3-H, RGO-Fe2O3-L, bare Fe2O3 nanospindles and bare RGO nanosheets at a constant current density (100 mA g−1, 0.1 C) for the first 100 cycles. The reversible specific capacity of bare RGO nanosheets decreased from 261 mA h g−1 to 190 mA h g−1 during the 100 cycles. Although the bare Fe2O3 nanospindles demonstrated high reversible specific capacities in the first cycle with a high Coulomb efficiency, the capacity of the anode material quickly declined to 151 mA h g−1 in the first 10 cycles, then the specific capacity maintained around 120 mA h g−1 in the following cycle tests. The cycling performance of RGO-Fe2O3-H was similar to that of RGO-Fe2O3-L, but the former material showed higher specific capacity and stable cycling performance. The RGO-Fe2O3-H nanocomposite exhibited a large reversible charge capacity of 969 mA h g−1 after 100 cycles. On the contrary, the reversible specific capacity of RGO-Fe2O3-L retained 804 mA h g−1 after 100 cycles, which can be also clearly observed in Fig. 6d (the comparison between RGO-Fe2O3-H and RGO-Fe2O3-L for the 1st, 50th and 100th cycles at the same current density). In Fig. 6d, we also found that the capacity remained close to 100% from the 50th to the 100th cycle for the RGO-Fe2O3-H, demonstrating the high cycling stability of the nanocomposite.
It is suggested that the enhanced performance of the nanocomposites is attributed to the RGO nanosheets, which not only provide a highly conductive matrix for the diffusion of electrons and lithium ions, but also limit the volume expansion of Fe2O3 nanospindles by surrounding them and developing nanopores as buffer spaces during the lithium insertion and extraction reactions.37,38 The electrical conductivities of RGO-Fe2O3-H and RGO-Fe2O3-L are measured to be 0.10 and 0.13 S cm−1, respectively, which are much higher than that of bare Fe2O3 (3 × 10⁻⁵ S cm−1). The difference between RGO-Fe2O3-H and RGO-Fe2O3-L demonstrated that the performance was related to the different RGO contents, with the lower RGO content attaining a better synergic effect. The inferior performance of RGO-Fe2O3-L may be also related to the lower content and larger size of the active Fe2O3 nanospindles in the composite. The performances of RGO-Fe2O3 nanocomposites here are also better than those of previously reported RGO-Fe2O3 nanocomposites at the same current density.20–22 The special nanostructure is responsible for the superior performance of the nanocomposites. Comparing with flat RGO nanosheets-supported composites, the crumpled RGO nanosheets could provide a more multi-dimensional confinement of Fe2O3 nanospindles, which cushions the effect of the volume expansion during lithium insertion. Furthermore, the nanoporous structure has more void spaces to buffer the volume change.
The high reversible capacity was well retained even at increased current densities. Fig. 7a shows the cycling performance of RGO-Fe2O3-H and RGO-Fe2O3-L nanocomposites at different current densities (1 C = 1000 mA g−1). In particular, the high-rate electrochemical performances of RGO-Fe2O3-H nanocomposite at different current densities have been demonstrated. The high initial reversible specific capacities were 898, 975 and 699 mA h g−1 at 0.5 C, 1 C and 5 C, respectively, and remained at 589, 368 and 336 mA h g−1 after 100 cycles. While high-rate electrochemical performances of the RGO-Fe2O3-L nanocomposite at different current densities were 864, 860 and 715 mA h g−1 at 0.5 C, 1 C and 5 C, respectively, and remained at 505, 299 and 169 mA h g−1 after 100 cycles. The cycling performance of RGO-Fe2O3-L and RGO-Fe2O3-H composites at stepwise current rates are shown in Fig. 7b. The capacities decreased slowly with increasing rate, and could recover to their original capacities (a bit lower or higher) when the rate returned to the initial rate. The RGO-Fe2O3 composite anode material can deliver a good cycling stability and high-rate electrochemical performance at stepwise current densities.
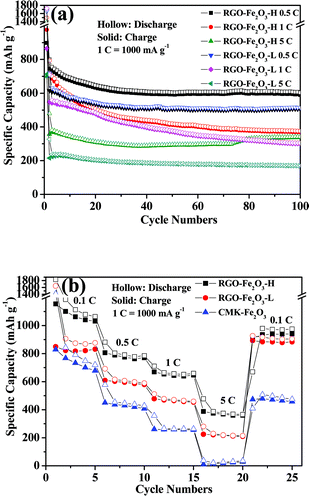 | ||
| Fig. 7 (a) The cycling performances of RGO-Fe2O3-H and RGO-Fe2O3-L composites at different current densities (1 C = 1000 mA g−1). (b) The cycling performances of RGO-Fe2O3-H, RGO-Fe2O3-L and CMK-Fe2O3 composites at stepwise current rates. | ||
To identify the contribution of crumpled RGO nanosheets, a nanocomposite of Fe2O3 nanospindles with mesoporous carbon (CMK-3) was also synthesized and its electrochemical performance was tested. From its charge-discharge profiles (Fig. 6b), it can be clearly seen that the CMK-Fe2O3 composite exhibits much lower charge and discharge capacities in comparison to the RGO-Fe2O3 composites. Moreover, the cycling performance of CMK-Fe2O3 was also inferior to those of RGO-Fe2O3 composites, as shown in Fig. 7b. All of these confirm the important role of RGO in the enhanced performance of RGO-Fe2O3 composites.
To understand the excellent electrochemical performance of the RGO-Fe2O3 composites, the morphology change of the bare RGO, bare Fe2O3 nanospindles as well as the nanocomposites after 100 cycles were examined using SEM. It is obvious that bare RGO nanosheets aggregated (Fig. S4a, ESI†), while bare Fe2O3 nanospindles pulverized into smaller ones and agglomerated (Fig. S4b, ESI†) after cycling, which are responsible for their poor cycling stability. In contrast, for RGO-Fe2O3 nanocomposites (Fig. S4c–f, ESI†), the morphology and particle size of the Fe2O3 nanospindles are almost the same as in their initial state, indicating the important role of crumpled RGO nanosheets, which effectively accommodate the strain and stress of volume change and protect the active Fe2O3 nanospindles, as a result, the cycling stability is enhanced. The protective effect of RGO nanosheets to Fe2O3 can be clearly confirmed by the magnified SEM image of RGO-Fe2O3-H (Fig. S4f, ESI†), in which the Fe2O3 nanospindles were flexibly wrapped by RGO nanosheets after the cycling process.
4. Conclusions
In summary, a new nanocomposite of Fe2O3 nanospindles with crumpled RGO nanosheets has been prepared by a facile and environmentally friendly solvothermal method. When applied as anode material for LIBs, the nanocomposite exhibited improved electrochemical performance, compared to bare Fe2O3 and RGO. It showed a large initial reversible charge capacity of 1556 mA h g−1 at the current density of 0.1 C (1 C = 1000 mA g−1), and a high reversible capacity of 969 mA h g−1 was retained after 100 cycles. At high current rates of 1 C and 5 C, large capacities of 368 and 336 mA h g−1 were also obtained after 100 cycles. The performance of our RGO-Fe2O3 nanocomposite is also better than those of previously reported RGO-Fe2O3 nanocomposites at the same current density. We ascribed the enhancement of the Li+ storage in the nanocomposites to the robust nanocomposite structure and the synergic effects between crumpled RGO nanosheets and Fe2O3 nanospindles. Our research may open a new field in the synthesis and application of nanocomposites based on crumpled graphene nanosheets in the near future.Acknowledgements
The authors are grateful for financial support from the National Natural Science Foundation of China (No. 51272094, 51072071 and 51102117).References
- M. Wakihara, Mater. Sci. Eng., R, 2001, 33, 109–134 CrossRef.
- M. S. Whittingham, Chem. Rev., 2004, 104, 4271–4301 CrossRef CAS.
- G. X. Wang, X. P. Shen, J. Yao and J. Park, Carbon, 2009, 47, 2049–2053 CrossRef CAS.
- S. Bai and X. P. Shen, RSC Adv., 2012, 2, 64–98 RSC.
- G. X. Wang, B. Wang, X. L. Wang, J. Park, S. X. Dou, H. Ahn and K. Kim, J. Mater. Chem., 2009, 19, 8378–8384 RSC.
- L. W. Ji, Z. K. Tan, T. Kuykendall, E. J. An, Y. B. Fu, V. Battaglia and Y. G. Zhang, Energy Environ. Sci., 2011, 4, 3611–3616 CAS.
- J. K. Lee, K. B. Smith, C. M. Hayner and H. H. Kung, Chem. Commun., 2010, 46, 2025–2027 RSC.
- E. Yoo, J. Kim, E. Hosono, H. Zhou, T. Kudo and I. Honma, Nano Lett., 2008, 8, 2277–2282 CrossRef CAS.
- L. Q. Tao, J. T. Zai, K. X. Wang, Y. H. Wan, H. J. Zhang, C. Yu, Y. L. Xiao and X. F. Qian, RSC Adv., 2012, 2, 3410–3415 RSC.
- J. Yao, X. P. Shen, B. Wang, H. K. Liu and G. X. Wang, Electrochem. Commun., 2009, 11, 1849–1852 CrossRef CAS.
- S. Q. Chen and Y. Wang, J. Mater. Chem., 2010, 20, 9735–9739 RSC.
- Y. S. He, D. W. Bai, X. W. Yang, J. Chen, X. Z. Liao and Z. F. Ma, Electrochem. Commun., 2010, 12, 570–573 CrossRef CAS.
- B. J. Li, H. Q. Cao, J. Shao, H. Zheng, Y. X. Lu, J. F. Yin and M. Z. Qu, Chem. Commun., 2011, 47, 3159–3161 RSC.
- K. Chang and W. X. Cheng, ACS Nano, 2011, 5, 4720–4728 CrossRef CAS.
- J. Choi, J. Jin, I. G. Jung, J. M. Kim, H. J. Kim and S. U. Son, Chem. Commun., 2011, 47, 5241–5243 RSC.
- B. Sun, J. Horvat, H. S. Kim, W. S. Kim, J. Ahn and G. X. Wang, J. Phys. Chem. C, 2010, 114, 18753–18761 CAS.
- J. Chen, L. N. Xu, W. Y. Li and X. L. Gou, Adv. Mater., 2005, 17, 582–586 CrossRef CAS.
- J. Yan, Z. J. Fan, T. Wei, W. Z. Qian, M. L. Zhang and F. Wei, Carbon, 2010, 48, 3825–3833 CrossRef CAS.
- S. M. Paek, E. Yoo and I. Honma, Nano Lett., 2009, 9, 72–75 CrossRef CAS.
- X. J. Zhu, Y. W. Zhu, S. Murali, M. D. Stollers and R. S. Ruoff, ACS Nano, 2011, 5, 3333–3338 CrossRef CAS.
- Y. Q. Zhou, J. Kan and Y. Wang, J. Phys. Chem. C, 2011, 115, 20747–20753 Search PubMed.
- X. Y. Xue, C. H. Ma, C. X. Cui and L. L. Xing, Solid State Sci., 2011, 13, 1526–1530 CrossRef CAS.
- S. Y. Liu, J. Xie, Q. Pan, C. Y. Wu, G. S. Cao, T. Z. Zhu and X. B. Zhao, Int. J. Electrochem. Sci., 2012, 7, 354–362 CAS.
- W. S. Hummers and R. E. Offeman, J. Am. Chem. Soc., 1958, 80, 1339–1339 CrossRef CAS.
- A. C. Ferrari, J. C. Meyer, V. Scardaci, C. Casiraghi, M. Lazzeri, F. Mauri, S. Piscanec, D. Jiang, K. S. Novoselov, S. Roth and A. K. Geim, Phys. Rev. Lett., 2006, 97, 187401 CrossRef CAS.
- C. N. R. Rao, A. K. Sood, K. S. Subrahmanyam and A. Govindaraj, Angew. Chem., Int. Ed., 2009, 48, 7752–7777 CrossRef CAS.
- X. M. Liu, S. Y. Fu, H. M. Xiao and C. J. Huang, J. Solid State Chem., 2005, 178, 2798–2803 CrossRef CAS.
- J. Lu, D. R. Chen and X. L. Jiao, J. Colloid Interface Sci., 2006, 303, 437–443 CrossRef CAS.
- S. Bai, X. P. Shen, G. X. Zhu, Z. Xu and J. Yang, CrystEngComm, 2012, 14, 1432–1438 RSC.
- H. Q. Cao, G. Z.Wang, L. Zhang, Y. Liang, S. C. Zhang and X. R. Zhang, ChemPhysChem, 2006, 7, 1897–1901 CrossRef CAS.
- S. Sharma, A. Ganguly, P. Papakonstantinou, X. P. Miao, M. X. Li, J. L. Hutchison, M. Delichatsios and S. Ukleja, J. Phys. Chem. C, 2010, 114, 19459–19466 CAS.
- J. X. Zhu, T. Zhu, X. Z. Zhou, Y. Y. Zhang, X. W. Lou, X. D. Chen, H. Zhang, H. H. Hng and Q. Y. Yan, Nanoscale, 2011, 3, 1084–1089 RSC.
- M. Zhang, B. H. Qu, D. N. Lei, Y. J. Chen, X. Z. Yu, L. B. Chen, Q. H. Li, Y. G. Wang and T. H. Wang, J. Mater. Chem., 2012, 22, 3868–3874 RSC.
- P. C. Lian, X. F. Zhu, S. Z. Liang, Z. Li, W. S. Yang and H. H. Wang, Electrochim. Acta, 2010, 55, 3909–3914 CrossRef CAS.
- S. Q. Chen, P. Chen, M. H. Wu, D. Y. Pan and Y. Wang, Electrochem. Commun., 2010, 12, 1302–1306 CrossRef CAS.
- J. Z. Wang, C. Zhong, D. Wexler, N. H. Idris, Z. X. Wang, L. Q. Chen and H. K. Liu, Chem.–Eur. J., 2011, 17, 661–667 CrossRef CAS.
- G. M. Zhou, D. W. Wang, F. Li, L. L. Zhang, N. Li, Z. S. Wu, L. Wen, G. Q. Lu and H. M. Cheng, Chem. Mater., 2010, 22, 5306–5313 CrossRef CAS.
- Y. M. Li, X. J. Lv, J. Lu and J. H. Li, J. Phys. Chem. C, 2010, 114, 21770–21774 CAS.
Footnote |
| † Electronic Supplementary Information (ESI) available: Fig. S1–Fig. S4. See DOI: 10.1039/c2ra21411c |
| This journal is © The Royal Society of Chemistry 2012 |
