DOI:
10.1039/C2RA21415F
(Paper)
RSC Adv., 2012,
2, 10948-10954
Mechanism of the pH-induced aggregation reaction between melamine and phosphate†
Received
11th July 2012
, Accepted 6th September 2012
First published on 11th September 2012
Abstract
The mechanism of the pH-induced aggregation reaction between melamine (Mel) and phosphate (Ps) has been studied using a combination of resonance Rayleigh scattering (RRS), FTIR, UV-visible spectra, and single-crystal X-ray and powder X-ray diffraction for the first time. The results confirm that the aggregation reaction between Mel and Ps is highly pH-dependent. Changes in pH dramatically influence the molar ratio of Mel to melaminium (Hmel+) and subsequently affect the synergistic nature of hydrogen bonding, electrostatic and π–π stacking interactions, resulting in the reversibility of the aggregation and dissolution process. The composition of the Mel–Ps aggregates has been characterized as 2[Hmel+]·[HPO42−]·3H2O. Mechanism analysis demonstrated that there exist two different methods for the transformation of Mel into Hmel+ by considering the aggregation reaction process and conditions.
Introduction
Melamine (Mel), a rigid, planar, and quite symmetric molecule, with multiple hydrogen bonding and π-stacking capacity,1,2 readily forms insoluble adducts with many organic3,4 and inorganic acids.5–9 Melamine phosphates (Mel–Ps) are well known as an additive-type flame retardant10–15 because of their enhanced thermal stability when blended into many polymers.16,17 The fundamental knowledge of their structural characteristics has been studied from single-crystal data,18,19 powder X-ray diffraction (PXRD) and a combined approach of PXRD, solid-state NMR, and Rietveld refinement.20,21 However, few attempts have focused on the reaction mechanism of Mel–Ps. Frazler et al.5 have studied the phase systems of Mel–H3PO4–H2O. More than ten Mel–Ps have been isolated and characterized, showing that the chemical compositions are closely related to the Mel![[thin space (1/6-em)]](https://www.rsc.org/images/entities/char_2009.gif) :
:![[thin space (1/6-em)]](https://www.rsc.org/images/entities/char_2009.gif) Ps molar ratio and pH values. However, the reaction mechanism has not been proposed. Peschar et al.21 suggested that in Mel–Ps with a Mel
Ps molar ratio and pH values. However, the reaction mechanism has not been proposed. Peschar et al.21 suggested that in Mel–Ps with a Mel![[thin space (1/6-em)]](https://www.rsc.org/images/entities/char_2009.gif) :
:![[thin space (1/6-em)]](https://www.rsc.org/images/entities/char_2009.gif) Ps ratio equal to 1.0, Hmel+ and H2PO4− will be produced via proton transfer, which takes place one-to-one between orthophosphate moieties and Mels. If the Mel
Ps ratio equal to 1.0, Hmel+ and H2PO4− will be produced via proton transfer, which takes place one-to-one between orthophosphate moieties and Mels. If the Mel![[thin space (1/6-em)]](https://www.rsc.org/images/entities/char_2009.gif) :
:![[thin space (1/6-em)]](https://www.rsc.org/images/entities/char_2009.gif) Ps ratio is greater than 1.0, then a second deprotonation of some orthophosphates leads to the production of HPO42−. However, the conclusions drawn from the crystal structure of Mel–Ps have failed to consider the reaction process and conditions, e.g. pH. pH can trigger self-assembly of the pH-sensitive micelles,22 leading to the aggregation of nanoparticles,23 peptides,24 and proteins25 by the protonation or deprotonation reaction. Therefore, further investigation of the pH-dependent reaction between Mel and Ps is needed. The Mel–Ps, whose crystal structures are known,18–21 have similar structural characteristics: (i) Most of the Mel–Ps compounds contain Hmel+, H2O, H2PO4− and HPO42−. (ii) The components of the compounds are interconnected by hydrogen bonding, electrostatic and π–π stacking interactions. (iii) All the synthetic approaches are under acidic conditions (phosphoric or meta-phosphoric acid solution), indicating that pH may be one of the key factors that can induce the reaction between Mel and Ps and influence the morphology and composition of the product. More recently, Zhang et al.26 demonstrated that slightly acidic conditions can induce Mel and Ps to form supramolecular hydrogels, and the gelation can be reversibly switched off/on by increasing/decreasing pH. This phenomenon indicates that the Mel–Ps solution is a complex equilibrium system, whose balance can be disturbed by changing the pH value. However, the mechanism of the reaction about the equilibrium system is not clear yet. Thus, further studies are particularly necessary to enrich our understanding.
Ps ratio is greater than 1.0, then a second deprotonation of some orthophosphates leads to the production of HPO42−. However, the conclusions drawn from the crystal structure of Mel–Ps have failed to consider the reaction process and conditions, e.g. pH. pH can trigger self-assembly of the pH-sensitive micelles,22 leading to the aggregation of nanoparticles,23 peptides,24 and proteins25 by the protonation or deprotonation reaction. Therefore, further investigation of the pH-dependent reaction between Mel and Ps is needed. The Mel–Ps, whose crystal structures are known,18–21 have similar structural characteristics: (i) Most of the Mel–Ps compounds contain Hmel+, H2O, H2PO4− and HPO42−. (ii) The components of the compounds are interconnected by hydrogen bonding, electrostatic and π–π stacking interactions. (iii) All the synthetic approaches are under acidic conditions (phosphoric or meta-phosphoric acid solution), indicating that pH may be one of the key factors that can induce the reaction between Mel and Ps and influence the morphology and composition of the product. More recently, Zhang et al.26 demonstrated that slightly acidic conditions can induce Mel and Ps to form supramolecular hydrogels, and the gelation can be reversibly switched off/on by increasing/decreasing pH. This phenomenon indicates that the Mel–Ps solution is a complex equilibrium system, whose balance can be disturbed by changing the pH value. However, the mechanism of the reaction about the equilibrium system is not clear yet. Thus, further studies are particularly necessary to enrich our understanding.
Resonance Rayleigh scattering (RRS)27–29 is an extremely sensitive technique for monitoring supramolecular assemblies, ion association, aggregation, and so on. A large number of analytical methods have been developed based on chromophore or non-chromophore aggregation by the RRS technique.30–33 Recently, the dynamic process of cold crystallization of amorphous poly(trimethylene terephthalate) was investigated with RRS, which showed a keen sense of each phase of crystallization, including induction, nucleation, nucleus growth and secondary crystallization.34 Under slightly acidic conditions, the aggregation process of Mel and Ps traverses the phase of crystallization,5,18–21 which will induce the gradual enhancement of the RRS signal. Herein, the RRS technique can be used as an ideal technique for investigation of the behaviour of the aggregation reaction between Mel and Ps.
In this article, we focus on the mechanism of the pH-induced aggregation reaction between Mel and Ps using a combination of synchronous “time-scan” RRS, UV-visible spectra, FTIR spectra, single-crystal X-ray and powder X-ray diffraction.
Experimental section
Materials and chemicals
Mel was supplied from Ke-Long Chemical Reagents Plant (Sichuan, China). Mel (2.36 × 10⁻² mol L−1) was prepared by directly dissolving the commercial product (0.297 g, 2.36 mmol) in doubly distilled water (100 mL). Phosphoric acid (6.6 mL, w = 85%) was obtained by diluting concentrated phosphoric acid in doubly distilled water (100 mL). A NaOH solution (1.0 mol L−1) was used to adjust the pH value of the phosphoric acid solution. All the reagents were of analytical grade without further purification. The water used throughout was doubly distilled.
Preparation of Mel–Ps
A phosphoric acid (5.0 mL, 1.00 mol L−1) was placed into a 250 mL conical flask and a certain amount of NaOH (1.00 mol L−1) was used to adjust the pH value of the solution. Then the Mel solution (100.0 mL, 2.36 × 10⁻² mol L−1) was added to it and the mixture was vortexed thoroughly. The equilibrium pH values of the solution are 4.61 (Mel–Ps1), 4.96 (Mel–Ps2), 5.09 (Mel–Ps3), 5.23 (Mel–Ps4), 5.55 (Mel–Ps5), and 6.40 (Mel–Ps6), respectively. A new crystalline component was encountered at pH 6.40 (Mel–Ps6). The resulting crude white precipitates were filtered and washed several times with water, and then dried under vacuum at 30 °C.
Characterization of Mel–Ps
Single-crystal X-ray diffraction data were collected on a Bruker Smart Apex CCD diffractometer with Mo-Kα monochromated radiation (λ = 0.71073 Å) at 296(2) K. Absorption corrections were applied using the multiscan technique. The structures were solved by the direct method and refined by the full-matrix least-squares method on F2 using the SHELXL-97 software.35 All of the non-hydrogen atoms were refined anisotropically. The hydrogen atoms were generated geometrically. The aqua hydrogen atoms were located from difference Fourier maps. Infrared spectra (4000–400 cm−1) were recorded as KBr pellets on a FT-IR Nicolet-170SX spectrophotometer. PXRD patterns were performed on a DX-2600 X-ray diffractometer using Cu-Kα (λ = 0.15406 nm) radiation equipped with a graphite monochromator. The X-ray tube was operated at 40 kV and 25 mA. A Shimadzu UV-visible spectrophotometer (Suzhou Shimadzu Instrument Co., Ltd., China) was employed to record the UV-visible absorption spectra. The RRS spectrum and intensity were recorded with an F-4500 fluorescence spectrophotometer (Hitachi, Japan), and a pHS-3C digital pH meter (Shanghai Hongyi Instrumentation Co., Ltd., China) was used to measure the pH value of the solution.
RRS investigation
The RRS spectrum of the pH-induced aggregation reaction between Mel and Ps has been recorded by using a traditional synchronous “wavelength scan” RRS technique (λem = λex) on a common spectrofluorometer. A synchronous “time-scan” RRS technique has been employed to study the variation with time of the RRS intensity of the aggregation reaction. Each synchronous “time-scan” RRS investigation was initiated by injecting a certain amount of Mel solution into a 1 cm cuvette containing a certain amount of Ps with the desired concentration and pH value. Then the solution was mixed rapidly, and the RRS were recorded in synchronous “time-scan” mode at λem = λex = 360 nm (namely, Δλ = 0 nm) automatically, and data collection was stopped when the RRS intensity exceeded the measuring range for some fast reactions. Otherwise, it was stopped 60 s later for the slow reaction. All synchronous “time-scan” RRS measurements were carried out with a 10.0 nm slit width of the excitation and emission of the spectrophotometer.
Results and discussion
Reversible pH-induced aggregation reaction
The pH-induced aggregation reaction between Mel and Ps is very interesting. It is found that in high acidic aqueous solution (e.g. pH ∼ 3), the mixing of Mel with Ps does not lead to any observable change at room temperature (Fig. 1a). However, it is unexpectedly observed that considerable quantities of the aggregates are produced when the solution pH is adjusted with dilute NaOH solution to about 4–6 (Fig. 1b). And a clear solution can be regenerated when the pH is increased to ∼7 with dilute NaOH (Fig. 1c). This process can be reversibly repeated by alternatively increasing and decreasing the pH (Fig. 1), indicating that the Mel and Ps solution is a complex equilibrium system whose balance can be disturbed by changing the pH value. However, there remain some questions: (1) Why can slightly acidic conditions (pH 4–6) induce the aggregation reaction? (2) Why can the aggregation and dissolution process be reversibly repeated by alternately increasing and decreasing the pH? (3) What does happen during the aggregation process? (4) What is the composition of the aggregates?
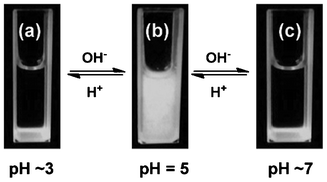 |
| | Fig. 1 Reversible pH-induced aggregation reaction between Mel and Ps. | |
Characterization of Mel–Ps
The composition of Mel–Ps is one of the most important factors in investigating this reaction. Thus, six Mel–Ps from the corresponding original equilibrium pHs: 4.61 (Mel–Ps1), 4.96 (Mel–Ps2), 5.09 (Mel–Ps3), 5.23 (Mel–Ps4), 5.55 (Mel–Ps5), and 6.40 (Mel–Ps6), respectively, have been prepared. Mel–Ps(1–5) are white precipitates and Mel–Ps6 is a needle-shaped crystalline, which have been characterised by a combination of UV-visible spectra, FTIR spectra, single-crystal X-ray and powder X-ray diffraction.
The crystallographic data for Mel–Ps6 are presented in Table 1. The chemical formula of Mel–Ps6 is C6H21N12O7P, which consists of two C3H7N6+ cations (Hmel+), a HPO42− anion, and three molecules of water: 2[Hmel+]·[HPO42−]·3H2O (Fig. 2). Here, the formula 2Hmel+·HPO42−is used so as to make the following discussion more brief and clear. The molecular arrangement in the unit cell (Fig. 3) shows that the Hmel+ residues form planar positively charged chains and the hydrogen-bonded HPO42− anions are interconnected by water molecules, forming negatively charged chains. Both oppositely charged moieties are extensively interconnected by multiple hydrogen bonds and π–π stacking (centroid–centroid distance of 3.575 Å), which stabilize the structure. The interactions among the components are consistent with the reported results.18–21
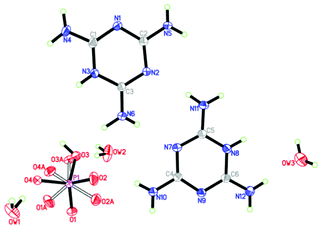 |
| | Fig. 2 ORTEP drawing of the structure of the Mel–Ps crystal with thermal ellipsoids at 30% probability. Open bonds represent disorder components. | |
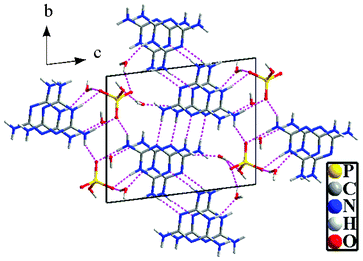 |
| | Fig. 3 Molecular arrangement in the unit cell showing the hydrogen bonding interactions (dashed lines) viewed along the a-axis. | |
| Compound reference |
Mel–Ps |
| Chemical formula |
C6H21N12O7P |
| Formula mass |
404.32 |
| Crystal system |
Triclinic |
|
a/Å |
6.830(5) |
|
b/Å |
10.633(8) |
|
c/Å |
12.576(10) |
|
α/° |
78.645(9) |
|
β/° |
74.258(9) |
|
γ/° |
71.914(9) |
| Unit cell volume/Å3 |
829.2(11) |
|
T/K |
296(2) |
| Space group |
P![[1 with combining macron]](https://www.rsc.org/images/entities/char_0031_0304.gif) |
| No. of formula units per unit cell, Z |
2 |
| No. of reflections measured |
6048 |
| No. of independent reflections |
3023 |
|
R
int
|
0.0350 |
| Final R1 values (I > 2σ(I)) |
0.0498 |
| Final wR(F2) values (I > 2σ(I)) |
0.1271 |
| Final R1 values (all data) |
0.0711 |
| Final wR(F2) values (all data) |
0.1516 |
| CCDC number |
856![[thin space (1/6-em)]](https://www.rsc.org/images/entities/char_2009.gif) 930 930 |
Fig. 4 shows the FTIR spectra of the Mel–Ps (1–6) with those of pure Mel (7) and NaH2PO4·2H2O (8). Obviously, the FTIR spectra of all the Mel–Ps (1–6) are completely different from those of pure Mel (7) and NaH2PO4·2H2O (8), indicating that new Mel–Ps complexes are formed. More importantly, the FTIR spectra of Mel–Ps (1–6) are very similar, indicating that all the Mel–Ps (1–6) complexes may have the same composition. In the –NH stretching region (Fig. 4a and c), for Mel, the peaks at 3469, 3419 and 3332 cm−1 are attributed to the symmetric stretching vibrational modes, while these peaks shift to lower frequencies at about 3350 and 3123 cm−1 in the FTIR spectra of Mel–Ps (1–6) and show a broad nature, indicating strong hydrogen-bond interactions with the neighbouring cations in the solid state.36 A strong infrared band located at about 1679 cm−1 is observed in the case of Mel–Ps (1–6) (Fig. 4b and d). The corresponding band for the Mel crystal was observed at 1654 cm−1.37 Therefore, the intermolecular interactions through the –NH2 groups of the Mel molecule cause a rise in their frequencies for the bending type of motion. More investigation on the band at 778 cm−1 has been reported in the IR spectra of melamine hydrobromide, indicating that the protonation of a ring nitrogen has been demonstrated.38 Further evidence regarding these interactions is reported in Fig. 5, where the UV-visible reflectance spectrum shows the band in the Mel–Ps solid state occurring at 293 nm, which disappears in the upper saturated solution transmittance spectrum. These results can be attributed to the formation of π-electron charge-transfer complexes in the solid state by hydrogen bonding interactions (Fig. 3).39
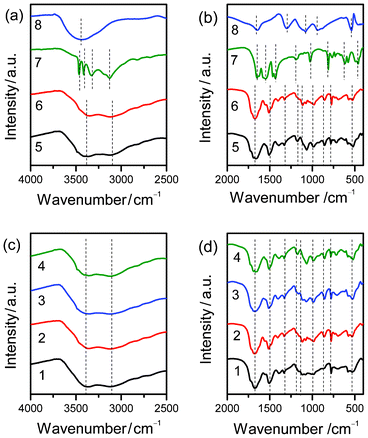 |
| | Fig. 4 FTIR spectra of Mel–Ps (1–6), pure Mel (7), and NaH2PO4·2H2O (8). | |
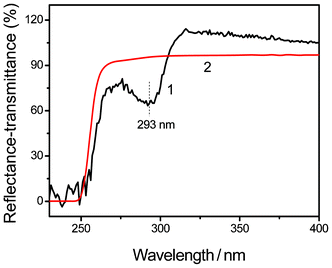 |
| | Fig. 5 UV-visible spectra of Mel–Ps3 reflectance (1) and of the upper saturated solution of Mel–Ps3 transmittance (2). | |
The PXRD patterns of the Mel–Ps (1–6) (Fig. 6) and those of pure Mel (7) and NaH2PO4·2H2O (8) have been investigated. The pure components show scattering peaks at 2θ = 15.6, 19.9, 24.1, and 31.4° for NaH2PO4·2H2O (8) and at 2θ = 13.2, 17.8, 21.8, 26.3, 28.9, and 29.9° for Mel (7). However, all the peaks of the Mel–Ps(1–6) are completely different from those of NaH2PO4·2H2O and Mel, indicating that the crystal structures of Mel–Ps (1–6) are different from those of pure NaH2PO4·2H2O and Mel. It is clear that in the cases of Mel–Ps (1–6), the major peak positions of the PXRD patterns do match quite well, which gives further evidence regarding the same composition in Mel–Ps (1–6).
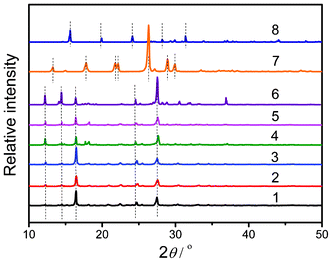 |
| | Fig. 6 PXRD patterns of Mel–Ps (1–6), pure Mel (7), and NaH2PO4·2H2O (8). | |
In view of the crystallographic data, FTIR and UV-visible spectra, and PXRD data, we can draw the conclusion that the same supramolecular 2Hmel+·HPO42− is also present in the corresponding Mel–Ps (1–5) as well as Mel–Ps6, and the results are consistent with those reported.5
RRS feature
The pH-induced aggregation reaction between Mel and Ps has been monitored by a traditional synchronous “wavelength scan” RRS technique (λem = λex) on a common spectrofluorometer at first. The RRS spectra of the Ps, Mel, and Mel–Ps systems are shown in Fig. 7a. The RRS signal of Mel (curve 2 in Fig. 7a) is very weak and stable over the wavelength range 250–700 nm, as well as that of Ps (curve 1 in Fig. 7a). However, the weak RRS signal of Mel can be greatly enhanced by adding Ps at pH 5.44, indicating that the aggregation reaction between Mel and Ps has really occurred and the aggregation reaction can be followed through a RRS enhancement. And indeed, RRS shows a keen sense of the aggregation process of Mel–Ps systems. However, the enhanced RRS signal is extremely unstable, which increases with time (curves 3–5 in Fig. 7a), and the shapes of the RRS spectra with time are different as well. Namely, the maximum scattering wavelengths of the scattering curves from 3 to 5 are 362, 415, and 320 nm, respectively. Although, the maximum peaks range from 320 to 415 nm, most of them are close to 360 nm; therefore, the λex = λem = 360 nm was selected for subsequent studies. In addition, poor reproducibility of the RRS spectra of the pH-induced aggregation reaction between Mel and Ps obtained under the same experimental conditions is observed (Fig. 7b), suggesting the limitation of the traditional synchronous “wavelength-scan” RRS technique for monitoring the unstable aggregation reaction between Mel and Ps.
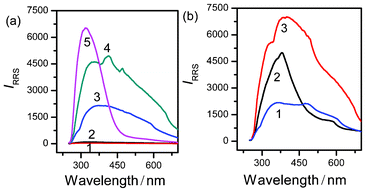 |
| | Fig. 7 Synchronous “wavelength-scan” RRS features of Ps (1), Mel (2), and the aggregation process of Mel and Ps recorded at various time intervals (3–5) (a). Time (s): 20, 40, and 60, respectively. Reproducibility of the synchronous “wavelength-scan” RRS feature of the aggregation process of Mel and Ps recorded at various time intervals (1–3) (b). Time (s): 20, 40, and 60, respectively. Concentrations: Mel (1.91 × 10⁻² mol L−1) and Ps (4.44 × 10⁻² mol L−1). pH 5.44; T = 293 K. | |
Because the IRRS is a function of time (Fig. 7), a synchronous “time-scan” RRS technique has been employed for the first time to study the variation with time of the RRS intensity of the aggregation reaction. The synchronous “time-scan” RRS curve (Fig. 8) clearly demonstrates that the IRRS is indeed a function of time and increases linearly with time to a certain extent. Herein, the slope (KRRS) obtained by the least square curve fit represents the aggregation rate. And the KRRS values of 5 repetitions of the experiment are 93.41, 78.42, 93.44, 83.25, and 92.71 s−1, respectively (Fig. 8b). The average KRRS is 86.25 s−1 and the standard deviation is 6.98%, indicating that the synchronous “time-scan” RRS technique is feasible and reliable for the study of the system. Further investigation showed that the RRS features obtained at various pH values were similar to those shown in Fig. 7 and 8.
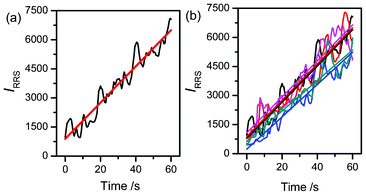 |
| | Fig. 8 Synchronous “time-scan” RRS feature of the aggregation process of the Mel and Ps reaction (the straight line is obtained by the least squares curve fit) (a). Five repetitions of the synchronous “time-scan” RRS feature of the aggregation process of the Mel and Ps reaction (b). Concentrations: Mel (1.91 × 10⁻² mol L−1) and Ps (4.44 × 10⁻² mol L−1). pH 5.44; T = 293 K; λem = λex = 360 nm. | |
Success of the synchronous “time-scan” RRS studies encouraged us to further investigate the pH-induced aggregation reaction. The KRRS of Mel–Ps was recorded by the synchronous “wavelength-scan” RRS method at various pHs. Fig. 9 shows that the KRRS increases remarkably as the pH increases from 3.08 to 5.08. However, when the pH value is higher than 5.08, the KRRS decreases sharply. Additionally, when pH < 3.08 or pH > 6.13, the KRRS is very slow. The fastest aggregation rate, appearing at about pH 5.08, indicates that the hydrogen bonds, electrostatic and π–π stacking interactions occur in a synergistic manner.
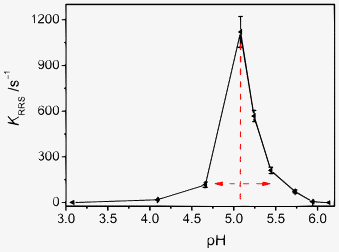 |
| | Fig. 9 Effect of pH on the KRRS of the aggregation reaction between Mel and Ps. Concentrations: Mel (1.91 × 10⁻² mol L−1) and Ps (4.44 × 10⁻² mol L−1). T = 293 K. | |
Proposed mechanism
It is well known that H3PO4 is a weak acid, and the pKa values are pKa1 = 2.16, pKa2 = 7.21, and pKa3 = 12.32.40,41 As shown in Fig. 10a, the fraction of the H2PO4− species increases with pH at first, then the H2PO4− species reaches a plateau and drops when pH is beyond 6.00. It should be emphasized that the percentage of H2PO4−, a dominant species, is greater than 94% in the range pH 4–6, suggesting that H2PO4− is a more important reactant than other species (e.g. HPO42−). Mel is a weak base with three different pKa values: pKa1 = 5.10, pKa2 = 0.20, and pKa3 = −2.10, respectively.42,43 Mel presents two main species in the pH range about 4–6: Mel and Hmel+ (Fig. 10b). With increasing pH the concentration of Hmel+ decreases rapidly, whereas that of Mel increases rapidly. From above, the most possible reactants are H2PO4−, Mel, and Hmel+ in the pH range about 4–6. Changes in pH influence the molar ratio of Hmel+ to Mel dramatically, which subsequently have a remarkable effect on the synergistic manner of the electrostatic and hydrogen bonding interactions among the reactants.1–4 The concentrations of Hmel+ and Mel are equal at the particular pH (pKa1 5.10) where the fastest aggregation rate occurs (Fig. 9), indicating that neutral Mel has a very important role as well as Hmel+. In addition, according to the principle of electrical neutrality, the molar ratio of Hmel+ to Mel to H2PO4− is 1![[thin space (1/6-em)]](https://www.rsc.org/images/entities/char_2009.gif) :
:![[thin space (1/6-em)]](https://www.rsc.org/images/entities/char_2009.gif) 1
1![[thin space (1/6-em)]](https://www.rsc.org/images/entities/char_2009.gif) :
:![[thin space (1/6-em)]](https://www.rsc.org/images/entities/char_2009.gif) 1. From above, we have made certain assumptions about the mechanism of the pH-induced aggregation reaction between Mel and Ps near the pH 5.10 region, ,
1. From above, we have made certain assumptions about the mechanism of the pH-induced aggregation reaction between Mel and Ps near the pH 5.10 region, , | | | Hmel+ + Mel + H2PO4− ⇆ Hmel+·Mel·H2PO4− ↓ | (2) |
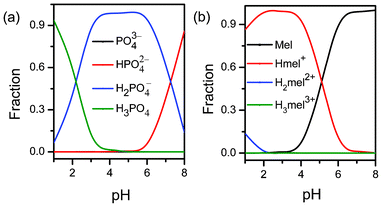 |
| | Fig. 10 Distribution diagrams for H3PO4 (a) and Mel (b). | |
Reaction 1 is an equilibrium system in which the Mel and Hmel+ species interconvert into each other by the changes in pH, and reaction 2 shows that the reactants (Hmel+, Mel, and H2PO4−) will be held together to form Mel–Ps aggregates through the synergistic behaviour of the hydrogen bonding, electrostatic and π–π stacking interactions.
However, Hmel+·Mel·H2PO4− is not the exact component of Mel–Ps, and there are Hmel+ and HPO42− in the Mel–Ps crystal rather than neutral Mel and H2PO4− (Fig. 3). According to Peschar's21 report that the Mel![[thin space (1/6-em)]](https://www.rsc.org/images/entities/char_2009.gif) :
:![[thin space (1/6-em)]](https://www.rsc.org/images/entities/char_2009.gif) Ps ratio in Hmel+·Mel·H2PO4− is greater than 1.0 and the deprotonation of H2PO4− leads to the production of HPO42−, and because the pKa2 (7.21) for the second deprotonation of H3PO4 is low enough to enable the protonation of Mel, this proton transfer reaction can be written as
Ps ratio in Hmel+·Mel·H2PO4− is greater than 1.0 and the deprotonation of H2PO4− leads to the production of HPO42−, and because the pKa2 (7.21) for the second deprotonation of H3PO4 is low enough to enable the protonation of Mel, this proton transfer reaction can be written as
| | | Hmel+·Mel·H2PO4− → 2Hmel+·HPO42− | (3) |
This inference (reaction 3) about the composition of the Mel–Ps coincides with the results of experiment.
Further evidence regarding the proposed mechanism is reported in Fig. 11, where the variations in pH of the Mel and Ps mixture under different pH conditions before and after aggregation are presented. Because the KRRS increases as the pH increases from 3.08 to 5.08 (Fig. 9), the variations in pH of the Mel–Ps mixture in the pH range 4.0 to 5.0 were first investigated. Namely, the pH of the Mel–Ps mixture was controlled below 3.08, then a certain amount of NaOH (1.0 mol L−1) was added and the solution was mixed rapidly, and then the pH was recorded as pH1. Due to the unstable Mel–Ps mixture, the appearance of aggregates would be observed with the decrease in pH until it reached the equilibrium state where the pH was relatively stable (pH2). Then the ΔpH (ΔpH, pH2 − pH1) was plotted as a function of pH1 (Fig. 11). Secondly, the variations in pH of the Mel–Ps mixture in the pH range 5.0 to 6.0 were studied. The pH of the Mel–Ps mixture was controlled higher than 6.13, and HCl (1.0 mol L−1) was used to adjust its pH. In this way, we found that the aggregation process was accompanied by the increase in pH (Fig. 11). From Fig. 11, we can see that the inconspicuous variations in pH happen near the pH 5.10 regions, indicating no obvious proton transfers between the aqueous solution and the reactants. This result illustrates that the reactants (Hmel+, Mel, and H2PO4−) are held together to directly form Mel–Ps aggregates and reaction 2 quickly shifts to the right, followed by proton transfer. If the pH is much lower than pH 5.10, where the concentration of the Hmel+ species is higher than that of the Mel species, one can observe a conspicuous decrease in pH after the formation of the Mel–Ps aggregates, indicating that a proton transfer process between the aqueous solution and the reactants takes place. The ΔpH relies on the concentration of the Hmel+ species (Fig. 11), namely, the higher the concentrations of the Hmel+ species, the larger the –ΔpH, therefore, it is reasonable that Hmel+, rather than H2PO4−, releases H+ (reaction 1 shifts to the left). In addition, higher concentrations of Hmel+ can raise the electrostatic repulsion among the reactants, which decelerates the aggregation rate rapidly (Fig. 9). On the other hand, if the pH is higher than 5.10, where Mel will be the main species, then the conspicuous increase in pH occurs after the formation of the Mel–Ps aggregates, indicating that H+ has transferred from aqueous solution to Mel–Ps. Furthermore, ΔpH relies on the concentration of the Mel species (Fig. 11), namely, the higher the concentrations of Mel, the larger the ΔpH. Thus, it is reasonable that Mel, rather than H2PO4−, combines with H+ (reaction 1 shifts to the right). In addition, increasing the concentration of Mel decreases the electrostatic attraction among the reactants, which decelerates the aggregation rate (Fig. 9).
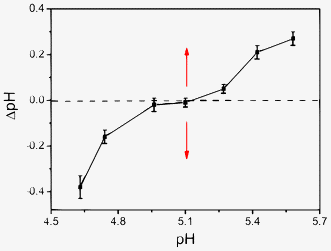 |
| | Fig. 11 The variation in pH value of Mel and Ps mixture before and after aggregation. Concentrations: Mel (1.91 × 10⁻² mol L−1) and Ps (4.44 × 10⁻² mol L−1). T = 293 K. | |
Conclusions
From above, the mechanism of the pH-induced aggregation reaction between Mel and Ps has been proposed as follows: Mel + H+ ⇆ Hmel+, Hmel+ + Mel + H2PO4− ⇆ Hmel+·Mel·H2PO4−, and Hmel+·Mel·H2PO4− → 2Hmel+·HPO42−. The composition of the Mel–Ps aggregates has been characterized to as 2[Hmel+]·[HPO42−]·3H2O. The aggregation reaction between Mel and Ps is highly pH-dependent. Changes in pH dramatically influence the molar ratio of Mel to Hmel+ and subsequently affect the synergistic behaviour of hydrogen bonding, electrostatic and π–π stacking interactions, resulting in the reversibility of the aggregation and dissolution process. Two different methods for the transformation of Mel into Hmel+ (reactions 1, 3) have been proposed by considering the aggregation process and conditions, which further developed Peschar's21 suggestion about proton transfer. This mechanism for the pH-induced aggregation reaction between Mel and Ps is expected to be helpful for the behaviour interpretation of Mel–Ps supramolecular hydrogels,26 the structure prediction of Mel–Ps in general5 and other Mel-related reactions,4,44 and the future development of high quality Mel–Ps blended functional materials and protonated melamine supramolecular chemistry.
Acknowledgements
This work was supported by the National Natural Science Foundation of China (No. 21273174, 20975083), the Municipal Science Foundation of Chongqing City (No. CSTC–2008BB 4013), and the 211 Project of Southwest University (the Third Term).
References
- D. C. Sherrington and K. A. Taskinen, Chem. Soc. Rev., 2001, 30, 83 RSC.
- G. M. Whitesides, E. E. Simanejk, J. P. Mathias, C. T. Seto, D. Chin, M. Mammen and D. M. Gordon, Acc. Chem. Res., 1995, 28, 37 CrossRef CAS.
- B. Roy, P. Bairi, A. Saha and A. K. Nandi, Soft Matter, 2011, 7, 8067 RSC.
- A. Saha, B. Roy, A. Garai and A. K. Nandi, Langmuir, 2009, 25, 8457 CrossRef CAS.
- A. W. Frazler, K. R. Waerstad and Y. K. Kim, J. Chem. Eng. Data, 1988, 333, 518 CrossRef.
- X. Li, S. Yang, W. Xiang and Q. Shi, Struct. Chem., 2007, 18, 661 CrossRef CAS.
- J. Janczak and G. J. Perpetuo, Acta Crystallogr., Sect. C: Cryst. Struct. Commun., 2001, C57, 1431 CAS.
- F. Adam, S. K. Lin, K. M. Hello, M. Hemamalini and H. Fun, Acta Crystallogr., Sect. E: Struct. Rep. Online, 2010, E66, o3033 CAS.
- R. Tanbug, K. Kirschbaum and A. A. Pinkerton, J. Chem. Crystallogr., 1999, 29, 45 CrossRef CAS.
-
J. G. Kersjes and R. H. M. Kierkels, U. S. Pat., 4,080, 501, 1978 Search PubMed.
- W. Y. Chen, Y. Z. Wang and F. C. Chang, J. Polym. Res., 2004, 11, 109 CrossRef CAS.
- S. Y. Liu, Q. Wang, G. X. Fei and Y. H. Chen, J. Appl. Polym. Sci., 2006, 102, 1773 CrossRef.
- S. Zhou, L. Song, Z. Wang, Y. Hu and W. Xing, Polym. Degrad. Stab., 2008, 93, 1799 CrossRef CAS.
- S. Zhou, Z. Wang, Z. Gui and Y. Hu, Fire Mater., 2008, 32, 307 CrossRef CAS.
- Y. Chen and Q. Wang, Polym. Adv. Technol., 2007, 18, 587 CrossRef CAS.
- S. Jahromi, W. Gabrielse and A. Braam, Polymer, 2003, 44, 25 CrossRef CAS.
-
J. G. Kersjes and R. H. M. Kierkels, U. S. Pat., 6653474 B1, 2003 Search PubMed.
- X. M. Li, S. S. Feng, F. Wang, Q. Ma and M. L. Zhu, Acta Crystallogr., Sect. E: Struct. Rep. Online, 2010, E66, o239 CAS.
- J. Janczak and G. Perpetuo, Acta Crystallogr., Sect. C: Cryst. Struct. Commun., 2002, C58, o455 CAS.
- D. J. A. De Ridder, K. Goubitz, V. Brodski, R. Peschar and H. Schenk, Helv. Chim. Acta, 2004, 87, 1894 CrossRef CAS.
- V. Brodski, R. Peschar and H. Schenk, J. Phys. Chem. C, 2008, 112, 12515 CAS.
- H. Dou, M. Jiang, H. Peng, D. Chen and Y. Hong, Angew. Chem., Int. Ed., 2003, 42, 1516 CrossRef CAS.
- J. Nam, N. Won, H. Jin, H. Chung and S. Kim, J. Am. Chem. Soc., 2009, 131, 13639 CrossRef CAS.
- A. Perálvarez-Marín, A. Barth and A. Gräslund, J. Mol. Biol., 2008, 379, 589 CrossRef.
- A. C. Alting, M. Weijers, E. H. A. de Hoog, A. M. van de Pijpekamp, M. A. C. Stuart, R. J. Hamer, C. G. de Kruif and R. W. Visschers, J. Agric. Food Chem., 2004, 52, 623 CrossRef CAS.
- J. S. Shen, Q. G. Cai, Y. B. Jiang and H. W. Zhang, Chem. Commun., 2010, 46, 6786 RSC.
- R. F. Pasternack, C. Bustamante, P. J. Collings, A. Diannetto and E. J. Gibbs, J. Am. Chem. Soc., 1993, 115, 5393 CrossRef CAS.
- R. F. Pasternack and P. J. Collings, Science, 1995, 269, 935 CAS.
- F. Mallamace, N. Micali, S. Trusso, L. Monsu' Scolaro, A. Romeo, A. Terracina and R. F. Pasternack, Phys. Rev. Lett., 1996, 76, 4741 CrossRef CAS.
- S. P. Liu, H. Q. Luo, N. B. Li and Z. F. Liu, Anal. Chem., 2001, 76, 3907 CrossRef.
- L. P. Wu, Y. F. Li, C. Z. Huang and Q. Zhang, Anal. Chem., 2006, 78, 5570 CrossRef CAS.
- J. Ling, C. Z. Huang, Y. F. Li, L. Zhang, L. Q. Chen and S. J. Zhen, TrAC, Trends Anal. Chem., 2009, 28, 447 CrossRef CAS.
- Z. L. Jiang, L. P. Zhou and A. H. Liang, Chem. Commun., 2011, 47, 3162 RSC.
- W. Luo, J. Yang, K. Mai and M. Zhang, Phys. Chem. Chem. Phys., 2010, 12, 4686 RSC.
-
(a)
G. M. Sheldrick, SHELXS 97, University of Göttingen, Germany, 1997 Search PubMed;
(b)
G. M. Sheldrick, SHELXL 97, University of Göttingen, Germany, 1997 Search PubMed.
- R. Venkatraman, P. C. Ray and C. S. Choi, Int. J. Quantum Chem., 2004, 100, 758 CrossRef CAS.
- W. J. Jones and W. J. Orville-Thomas, Trans. Faraday Soc., 1959, 55, 203 RSC.
- M. Scoponi, E. Polo, F. Pradella, V. Bertolasi, V. Carassiti and P. Goberti, J. Chem. Soc. Perkin Trans., 1992, 2, 1127 Search PubMed.
- R. C. Hirt and R. G. Schmitt, Spectrochim. Acta, 1958, 12, 127 CrossRef CAS.
- C. Lorente, A. L. Capparelli, A. H. Thomas, A. M. Braunb and E. Oliveros, Photochem. Photobiol. Sci., 2004, 3, 167 CAS.
- H. T. Fu, Y. P. Lu and M. J. Xie, J. Chromatogr., A, 2002, 945, 97 CrossRef.
- A. Weinstabl, W. H. Binder, H. Gruber and W. Kantner, J. Appl. Polym. Sci., 2001, 81, 1654 CrossRef CAS.
- Y. H. Jang, S.G. Hwang, S. B. Chang, J. Ku and D. S. Chung, J. Phys. Chem. A, 2009, 113, 13036 CrossRef CAS.
- A. Saha, S. Manna and A. K. Nandi, Langmuir, 2007, 23, 13126 CrossRef CAS.
|
| This journal is © The Royal Society of Chemistry 2012 |
Click here to see how this site uses Cookies. View our privacy policy here. ![[thin space (1/6-em)]](https://www.rsc.org/images/entities/char_2009.gif) :
:![[thin space (1/6-em)]](https://www.rsc.org/images/entities/char_2009.gif) Ps molar ratio and pH values. However, the reaction mechanism has not been proposed. Peschar et al.21 suggested that in Mel–Ps with a Mel
Ps molar ratio and pH values. However, the reaction mechanism has not been proposed. Peschar et al.21 suggested that in Mel–Ps with a Mel![[thin space (1/6-em)]](https://www.rsc.org/images/entities/char_2009.gif) :
:![[thin space (1/6-em)]](https://www.rsc.org/images/entities/char_2009.gif) Ps ratio equal to 1.0, Hmel+ and H2PO4− will be produced via proton transfer, which takes place one-to-one between orthophosphate moieties and Mels. If the Mel
Ps ratio equal to 1.0, Hmel+ and H2PO4− will be produced via proton transfer, which takes place one-to-one between orthophosphate moieties and Mels. If the Mel![[thin space (1/6-em)]](https://www.rsc.org/images/entities/char_2009.gif) :
:![[thin space (1/6-em)]](https://www.rsc.org/images/entities/char_2009.gif) Ps ratio is greater than 1.0, then a second deprotonation of some orthophosphates leads to the production of HPO42−. However, the conclusions drawn from the crystal structure of Mel–Ps have failed to consider the reaction process and conditions, e.g. pH. pH can trigger self-assembly of the pH-sensitive micelles,22 leading to the aggregation of nanoparticles,23 peptides,24 and proteins25 by the protonation or deprotonation reaction. Therefore, further investigation of the pH-dependent reaction between Mel and Ps is needed. The Mel–Ps, whose crystal structures are known,18–21 have similar structural characteristics: (i) Most of the Mel–Ps compounds contain Hmel+, H2O, H2PO4− and HPO42−. (ii) The components of the compounds are interconnected by hydrogen bonding, electrostatic and π–π stacking interactions. (iii) All the synthetic approaches are under acidic conditions (phosphoric or meta-phosphoric acid solution), indicating that pH may be one of the key factors that can induce the reaction between Mel and Ps and influence the morphology and composition of the product. More recently, Zhang et al.26 demonstrated that slightly acidic conditions can induce Mel and Ps to form supramolecular hydrogels, and the gelation can be reversibly switched off/on by increasing/decreasing pH. This phenomenon indicates that the Mel–Ps solution is a complex equilibrium system, whose balance can be disturbed by changing the pH value. However, the mechanism of the reaction about the equilibrium system is not clear yet. Thus, further studies are particularly necessary to enrich our understanding.
Ps ratio is greater than 1.0, then a second deprotonation of some orthophosphates leads to the production of HPO42−. However, the conclusions drawn from the crystal structure of Mel–Ps have failed to consider the reaction process and conditions, e.g. pH. pH can trigger self-assembly of the pH-sensitive micelles,22 leading to the aggregation of nanoparticles,23 peptides,24 and proteins25 by the protonation or deprotonation reaction. Therefore, further investigation of the pH-dependent reaction between Mel and Ps is needed. The Mel–Ps, whose crystal structures are known,18–21 have similar structural characteristics: (i) Most of the Mel–Ps compounds contain Hmel+, H2O, H2PO4− and HPO42−. (ii) The components of the compounds are interconnected by hydrogen bonding, electrostatic and π–π stacking interactions. (iii) All the synthetic approaches are under acidic conditions (phosphoric or meta-phosphoric acid solution), indicating that pH may be one of the key factors that can induce the reaction between Mel and Ps and influence the morphology and composition of the product. More recently, Zhang et al.26 demonstrated that slightly acidic conditions can induce Mel and Ps to form supramolecular hydrogels, and the gelation can be reversibly switched off/on by increasing/decreasing pH. This phenomenon indicates that the Mel–Ps solution is a complex equilibrium system, whose balance can be disturbed by changing the pH value. However, the mechanism of the reaction about the equilibrium system is not clear yet. Thus, further studies are particularly necessary to enrich our understanding.


![[1 with combining macron]](https://www.rsc.org/images/entities/char_0031_0304.gif)
![[thin space (1/6-em)]](https://www.rsc.org/images/entities/char_2009.gif) 930
930


![[thin space (1/6-em)]](https://www.rsc.org/images/entities/char_2009.gif) :
:![[thin space (1/6-em)]](https://www.rsc.org/images/entities/char_2009.gif) 1
1![[thin space (1/6-em)]](https://www.rsc.org/images/entities/char_2009.gif) :
:![[thin space (1/6-em)]](https://www.rsc.org/images/entities/char_2009.gif) 1. From above, we have made certain assumptions about the mechanism of the pH-induced aggregation reaction between Mel and Ps near the pH 5.10 region,
1. From above, we have made certain assumptions about the mechanism of the pH-induced aggregation reaction between Mel and Ps near the pH 5.10 region, 
![[thin space (1/6-em)]](https://www.rsc.org/images/entities/char_2009.gif) :
:![[thin space (1/6-em)]](https://www.rsc.org/images/entities/char_2009.gif) Ps ratio in Hmel+·Mel·H2PO4− is greater than 1.0 and the deprotonation of H2PO4− leads to the production of HPO42−, and because the pKa2 (7.21) for the second deprotonation of H3PO4 is low enough to enable the protonation of Mel, this proton transfer reaction can be written as
Ps ratio in Hmel+·Mel·H2PO4− is greater than 1.0 and the deprotonation of H2PO4− leads to the production of HPO42−, and because the pKa2 (7.21) for the second deprotonation of H3PO4 is low enough to enable the protonation of Mel, this proton transfer reaction can be written as 
