Facile synthesis and gas-sensing properties of monodisperse α-Fe2O3 discoid crystals†
Peng
Sun
,
Yingwei
Liu
,
Xiaowei
Li
,
Yanfeng
Sun
,
Xishuang
Liang
*,
Fengmin
Liu
and
Geyu
Lu
*
State Key Laboratory on Integrated Optoelectronics, College of Electronic Science and Engineering, Jilin University, Changchun 130012, People's Republic of China. E-mail: lugy@jlu.edu.cn; liangxs@jlu.edu.cn; Fax: +86 431 85167808; Tel: +86 431 85167808
First published on 28th August 2012
Abstract
Monodisperse α-Fe2O3 discoid crystals have been prepared through a hexamethylenetetramine (HMT)-assisted hydrothermal process combined with subsequent acid-dissolution. First, uniform α-Fe2O3 round-edged hexahedrons with a size of about 1.2 μm were synthesized. Subsequently, by a controlled acid etching process, the as-obtained α-Fe2O3 uniform hexahedrons could be facilely transformed into monodisperse α-Fe2O3 discoid crystals, without influencing the original crystal phase. Both field emission scanning electron microscope results and transmission electron microscope results revealed that the “discuses” were made of piled up nanoparticles. The selected area electron diffraction pattern from the whole discoid crystal displayed that all the nanoparticles were highly oriented, which resulted in the single-crystal “discus” features. To demonstrate the usage of such α-Fe2O3 discoid crystals, the obtained sample was applied to fabricate a gas sensor which was then tested for sensitivity to three kinds of gases (ethanol, methanol and acetone). The results of the test showed that the sensor had a high level of response and good recovery characteristics towards ethanol at the operating temperature of 238 °C.
Introduction
Alpha-iron oxide (α-Fe2O3), the most stable form of iron oxide under ambient conditions, has been recognized as a promising semiconductor material for gas sensors, Li-ion batteries and catalysis1–4 due to its nontoxicity, low cost and excellent stability. Among most of the potential applications, the morphology and structure of the nanomaterials will undoubtedly play a pivotal role in determining their properties.5 In order to improve the performance of devices based on α-Fe2O3, various morphologies of α-Fe2O3 with different dimensional nanostructures, such as particles,6 nanorods,7 nanodiscs,8 hollow spheres9 and complex hierarchical structures constructed with nanoscale building blocks,10–12 have been synthesized via a series of routes. Despite these advances, the unique morphologies of α-Fe2O3 nanocrystals spur researchers to explore their unknown properties and potential applications. For this purpose, the synthesis of novel morphologies of α-Fe2O3 nanostructures through a facile, mild and low cost method has been getting increasing attention. However, to the best of our knowledge, studies of discoid α-Fe2O3 crystals obtained by a simple hydrothermal route have been rarely reported.Recently, great efforts have been devoted to preparing hierarchical micro- and nano-structures assembled by low dimensional nano-building blocks because of their unusual chemical, electronic and optical properties and their potential applications in nanoscale devices.13,14 Research on the intrinsic morphology–property relationship has generated an urgent need for adjusting synthesis strategies, with which the morphology of materials can be controlled with designed functionalities. Among the existing approaches to prepare hierarchical nanostructures, the self-assembly strategy, especially under a low temperature solution environment, where low-dimensional building units spontaneously aggregate into high-dimensional architectures, is probably the most attractive because of its low cost, facile procedure, mild reaction conditions and high yield for large scale production. A variety of semiconductor nanomaterials with hierarchical structures have been successfully prepared using this route in the past few years, such as SnO2,15 ZnO,16 α-Fe2O317 and TiO2.18
In this work, we demonstrate a facile approach to the preparation of monodisperse α-Fe2O3 discoid nanostructures. In our synthetic strategy, uniform α-Fe2O3 round-edged hexahedrons were first prepared via a hexamethylenetetramine (HMT)-assisted hydrothermal process, and then discoid α-Fe2O3 nanostructures were obtained via a controlled hydrochloric acid (HCl) etching process of the as-prepared hexahedrons at low temperature. When applied as the sensing material for gas sensors, the as-prepared α-Fe2O3 discoid crystals exhibited a high response and good recovery characteristics towards ethanol at 238 °C.
Experimental
Synthesis of α-Fe2O3 discoid agglomerates
All the reagents in the experiment were analytical grade (Beijing Chemicals Co. Ltd.) and used as received without further purification. Round-edged α-Fe2O3 hexahedrons were synthesized via a simple hydrothermal process. The typical synthesis process was described in our previous report.19 Briefly, 4.054 g of ferric chloride hexahydrate (FeCl3·6H2O) and 1.2 g of hexamethylenetetramine (HMT, (CH2)6N4) were dissolved in 30 mL of a water![[thin space (1/6-em)]](https://www.rsc.org/images/entities/char_2009.gif) :
:![[thin space (1/6-em)]](https://www.rsc.org/images/entities/char_2009.gif) ethanol mixture (1
ethanol mixture (1![[thin space (1/6-em)]](https://www.rsc.org/images/entities/char_2009.gif) :
:![[thin space (1/6-em)]](https://www.rsc.org/images/entities/char_2009.gif) 1, v/v) under magnetic stirring to form a clear yellowish solution. Subsequently, the solution was transferred into a Teflon-lined stainless steel autoclave, maintained at 160 °C for 12 h and cooled down naturally after the reaction. The resulting precipitate was collected by centrifugation, washed several times with deionized water and ethanol, and finally dried in vacuum at 80 °C. The as-prepared α-Fe2O3 hexahedrons were then dispersed in a solution containing 2 M hydrochloric acid and the reaction medium was stirred at 60 °C for 5.5 h to obtain uniform α-Fe2O3 discoid nanostructures.
1, v/v) under magnetic stirring to form a clear yellowish solution. Subsequently, the solution was transferred into a Teflon-lined stainless steel autoclave, maintained at 160 °C for 12 h and cooled down naturally after the reaction. The resulting precipitate was collected by centrifugation, washed several times with deionized water and ethanol, and finally dried in vacuum at 80 °C. The as-prepared α-Fe2O3 hexahedrons were then dispersed in a solution containing 2 M hydrochloric acid and the reaction medium was stirred at 60 °C for 5.5 h to obtain uniform α-Fe2O3 discoid nanostructures.
Characterization of samples
Powder X-ray diffraction (XRD) measurements of the as-prepared products were recorded with a Rigaku TTR III diffractometer using Cu-Kα radiation (λ = 1.5418 Å). Data was collected over the 2θ range 20–80°. Field-emission scanning electron microscopy (FESEM) images were carried out on a JEOL JSM-7500F microscope at an acceleration voltage of 15 kV. Transmission electron microscopy (TEM) and selected-area electron diffraction (SAED) measurements were obtained on a JEOL JEM- 2100 microscope at an acceleration voltage of 200 kV.Fabrication and measurement of gas sensor
The synthesized α-Fe2O3 discoid crystals were mixed with deionized water to form a slurry. The resulting slurry was then coated onto an alumina tube (4 mm in length, 1.2 mm in external diameter and 0.8 mm in internal diameter), on which a pair of gold electrodes were installed at each end, and each electrode was connected with a Pt wire. After drying in air at room temperature, the devices were sintered at 400 °C for 2 h using a muffle furnace. A Ni–Cr alloy coil was inserted into the alumina tube as a heater controlling the operating temperature of the sensor. A schematic diagram of the as-fabricated sensor and a photograph of the sensor on the socket are shown in Fig. 1. The details of the sensor fabrication are similar to those of sensor fabrication reported in other literature.20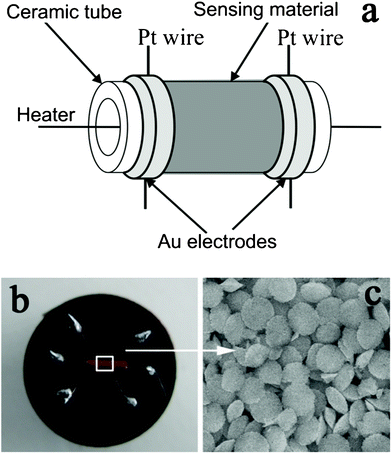 | ||
| Fig. 1 (a) Schematic diagram of the sensor. (b) Photograph of the completed sensor. (c) SEM image of the sensing material. | ||
The measurements were processed by a static process: a given amount of the tested gas was injected into a closed glass chamber and mixed with air. Then the sensor was put into the chamber for the measurement of the sensing performance. The gas response was defined as the ratio between Ra (the resistance when exposed to air) and Rg (the resistance when exposed to test gas). The response time and recovery time were defined as the time taken by the sensor to achieve 90% of the total resistance change in the case of adsorption and desorption, respectively.
Results and discussion
The crystallographic structure of the product obtained via a hydrothermal reaction was analyzed by X-ray diffraction (XRD), the pattern of which is shown in Fig. 2a. All of the diffraction peaks could be unambiguously indexed to the rhombohedral α-Fe2O3 according to JCPDS card No. 33-0664, with space group R![[3 with combining macron]](https://www.rsc.org/images/entities/char_0033_0304.gif) c and lattice parameters a = 5.035 Å and c = 13.75 Å. No diffraction peaks from any other impurities were observed, which indicates the high purity of the product. The morphology and microstructure of the product were characterized using field-emission scanning electron microscopy (FESEM) and transmission electron microscopy (TEM). These showed that the product was composed of uniformly dispersed particles (Fig. 2b). No other morphologies could be detected, which indicates that high yield and uniformity were achieved in this way. It can be observed from the enlarged FESEM image of Fig. 2c that the monodisperse particles had a round-edged hexahedral morphology with an average size of about 1.2 μm. The rough surface of the hexahedral nanostructures was exhibited, as shown in Fig. 2d. The typical TEM image in Fig. 2e displays that the size and shape of the α-Fe2O3 particles were similar to those from the FESEM observations. Fig. 2f shows the TEM image of a representative round-edged hexahedron. The inset corresponds to the selected area electron diffraction (SAED) pattern. The diffraction spots were attributed to (110), (101), (01
c and lattice parameters a = 5.035 Å and c = 13.75 Å. No diffraction peaks from any other impurities were observed, which indicates the high purity of the product. The morphology and microstructure of the product were characterized using field-emission scanning electron microscopy (FESEM) and transmission electron microscopy (TEM). These showed that the product was composed of uniformly dispersed particles (Fig. 2b). No other morphologies could be detected, which indicates that high yield and uniformity were achieved in this way. It can be observed from the enlarged FESEM image of Fig. 2c that the monodisperse particles had a round-edged hexahedral morphology with an average size of about 1.2 μm. The rough surface of the hexahedral nanostructures was exhibited, as shown in Fig. 2d. The typical TEM image in Fig. 2e displays that the size and shape of the α-Fe2O3 particles were similar to those from the FESEM observations. Fig. 2f shows the TEM image of a representative round-edged hexahedron. The inset corresponds to the selected area electron diffraction (SAED) pattern. The diffraction spots were attributed to (110), (101), (01![[1 with combining macron]](https://www.rsc.org/images/entities/char_0031_0304.gif) ) planes and/or their equivalent planes under the incident electron beam along the [
) planes and/or their equivalent planes under the incident electron beam along the [![[1 with combining macron]](https://www.rsc.org/images/entities/char_0031_0304.gif) 11] direction. The sharp diffraction spots represent the single crystalline nature of the hexahedral particle.
11] direction. The sharp diffraction spots represent the single crystalline nature of the hexahedral particle.
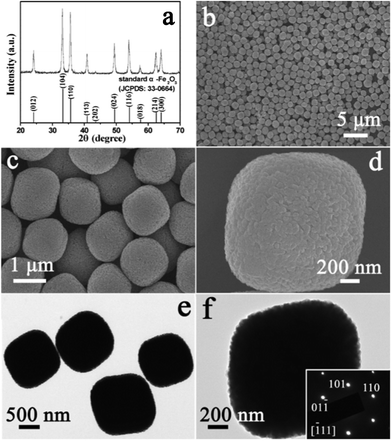 | ||
| Fig. 2 (a) XRD pattern of the product obtained by hydrothermal reaction. FESEM images (b–d) and TEM images (e, f) of the α-Fe2O3 product before acid-dissolution. The inset in (f) is the SAED pattern of the sample. | ||
To obtain more detailed information about the growth mechanism, a time-dependent morphology evolution study was conducted. The morphologies of samples at different reaction times are shown in (Fig. S1†). On the basis of SEM observations, an “oriented aggregation” process leads to the formation of round-edged hexahedrons.21,22 In simple terms, primary nanocrystals first nucleate in a supersaturated solution. Afterwards, the newly formed nanocrystals aggregate into cubic particles, driven by minimization of total surface energy. During the aggregation process, the adjacent primary nanocrystals align in an orderly way by an oriented-aggregation mechanism so that the particles share a planar interface in a common crystallographic orientation.23,24 Thus, the formed round-edged hexahedrons show a single-crystal characteristic.
Monodisperse α-Fe2O3 discoid crystals were generated after acid-dissolution of the round-edged hexahedrons at 60 °C for 5.5 h. The dissolved product was identified by X-ray diffraction as rhombohedral α-Fe2O3 (JCPDS card No. 33-0664) (Fig. 3a). The result indicates that the crystallographic structure of the product was maintained after dissolving with a changed morphology. A panoramic SEM image of the as- prepared α-Fe2O3 discoid crystals obtained on a large scale after acid treatment is shown in Fig. 3b. It is obvious that the initial round-edged hexahedrons had been transformed into discoid structures with a relatively uniform size distribution. It can be observed from the enlarged SEM images of Fig. 3c and d that the product consisted almost entirely of discoid crystals. The high-magnification images in the insets of Fig. 3c and d show the detailed morphology of a single “discus” in front and profile and reveal a clear and well-defined discoid structure with a diameter of about 1.2 μm and a centre thickness of about 500 nm. It can also be clearly identified that the discus was actually composed of densely packed nanoparticles with a relatively small size. In order to further investigate the crystal structure of the discoid particles, transmission electron microscopy (TEM) investigation was carried out in detail. The results reveal that the as-obtained hierarchical structure was an assembly of smaller nanoparticles (Fig. 3e and f). The SAED pattern of an individual “discus” (the inset in Fig. 3f) shows the single crystalline nature. The result indicates that the primary nanoparticles were perfectly oriented, which leads to the single-crystal feature of discoid α-Fe2O3 hierarchical nanostructures.21,22
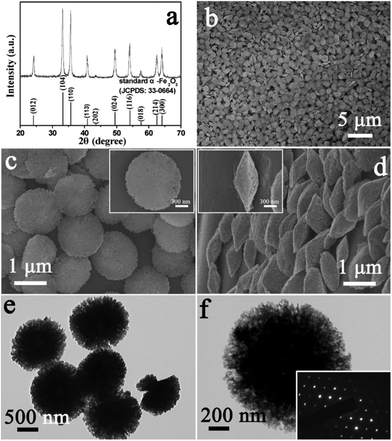 | ||
| Fig. 3 XRD pattern (a), FESEM images (b–d) and TEM images (e, f) of the product after acid-dissolution. The inset in (f) is the SAED pattern of the sample. | ||
To investigate the formation mechanism of these discoid crystals, a series of experiments were carried out with different etching times and other conditions unchanged. The product was collected in each experiment and its morphology was characterized by SEM. The corresponding results are shown in Fig. 4. All SEM images were observed at the same magnification so that the formation process of the α-Fe2O3 discoid crystals could be displayed clearly. During the first stage of etching (0.5 h), the round-edged hexahedron obtained by hydrothermal reaction (Fig. 4a) changed into a spherical structure. The surface of the spheres was rough. After etching for 1.5 h, the spherical α-Fe2O3 particle would be further etched by H+ ions and then olive-like particles were obtained (Fig. 4c). When the etching time was prolonged to 5.5 h, monodisperse and uniform discoid crystals with rough surfaces could be produced (Fig. 4d), with the detailed characteristics described previously. The structure of the round-edged hexahedrons altered substantially during the etching process, but the uniformity and monodispersity were not influenced and no collapse was observed (Fig. S2†). Moreover, X-ray diffraction (XRD) patterns of the samples (Fig. S3†) after different etching times show that the crystal phase of the particles was not changed, although the peak intensity decreased after 5.5 h of etching. On the basis of the aforementioned experimental results, the formation process of such α-Fe2O3 nanostructures can be schematically illustrated, as in Fig. 4e. Firstly, hexahedrons should be selectively etched on corner sites in thermodynamics since reacting on the corners is easy and the reaction rate is fast due to the high surface free energy. As a result, the spherical crystals are able to form easily, and such a phenomenon has been reported in the literature.25 After prolonged reaction for a carefully controlled duration, a uniform discoid structure will be obtained as a consequence of the perfected etching along the diagonal axis of the hexahedron. The detailed formation mechanism is still under investigation by our group. Here is a working hypothesis that is consistent with the observation of electron microscopy.
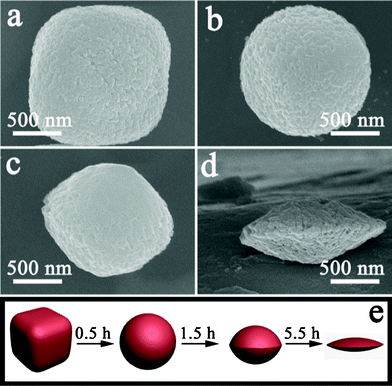 | ||
| Fig. 4 SEM images of products obtained with different dissolution times: (a) 0 h, (b) 0.5 h, (c) 1.5 h, (d) 5.5 h. (e) Schematic illustration of the formation process of α-Fe2O3 discoid crystals. | ||
With the development of the chemical industry, gas sensors have become the focus of worldwide research for applications in detecting pollutants, toxic and combustible gases.26,27 Therefore, a gas sensor using monodisperse α-Fe2O3 discoid crystals has been fabricated and tested for sensitivity to three kinds of gases (ethanol, methanol and acetone). In general, the response of semiconducting metal oxide gas sensors depends on the operating temperature.28,29 In order to determine the optimum operating temperature, the responses of the sensor to 100 ppm ethanol, methanol and acetone were investigated as a function of operating temperature, as shown in Fig. 5a. It is clear that the responses of the sensor to the three tested gases varied with the operating temperature. The response to ethanol first increased with temperature, up to 238 °C, and then decreased gradually. The maximum response to ethanol reached 17.6, at 238 °C. For acetone and methanol, the responses both increased continuously when the operating temperature varied from 200 to 250 °C, and then decreased. The maximum responses to acetone and methanol were 13.8 and 6.4 at 250 °C. Therefore, operating temperatures of 238 and 250 °C were chosen for ethanol and acetone respectively, to further examine the characteristics of the gas sensor. The difference of the optimal operating temperature seems to correlate with the different activation energy barriers related to different test gases.30 The response time and recovery time are important parameters for gas sensors. Fig. 5b shows the response transients of the sensor to 100 ppm ethanol at 238 °C. The results indicate that the sensor responded immediately when ethanol was introduced. The response time and recovery time was 4 and 146 s, respectively. The three reversible cycles of the response curve indicated a stable and repeatable characteristic, as shown in the inset of Fig. 5b.
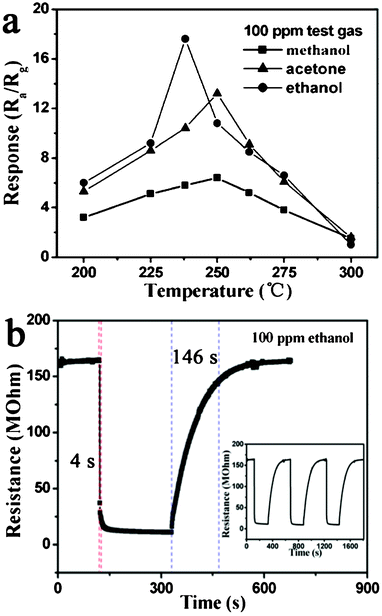 | ||
| Fig. 5 Gas response versus operating temperature of α-Fe2O3 discoid crystals sensor to 100 ppm test gases. (b) Response transient of the sensor to 100 ppm ethanol. The inset shows three periods of response curve. | ||
The response and recovery behaviors were further investigated with the sensor being systematically exposed to different concentrations of ethanol and acetone at an operating temperature of 250 °C. The results are displayed in Fig. 6. It was found that the response and recovery characteristics were almost reproducible. The almost square response shape observed indicated that the sensor first responded rapidly to test gases, quickly achieving a near steady state.31 Then the resistance of the sensor changed slowly due to the test gases diffusing through the material and occupying the remaining surface reaction sites. When the sensor was exposed to air, the resistance returned to near a baseline level. The response time was within 3 and 4 s for ethanol and acetone, respectively. After exposure in air, the recovery time was 65 and 70 s for ethanol and acetone, respectively. Moreover the response was proportional to the increasing concentration of ethanol/acetone from 40 to 100 ppm, but slowly tended to saturation when concentrations became higher. The response was about 4.5, 5.1, 6.4 and 9.1 to 40, 60, 80 and 100 ppm ethanol, respectively. For acetone, the response was about 2.6, 4.5, 9.2 and 10.6 to 40, 60, 80 and 100 ppm, respectively.
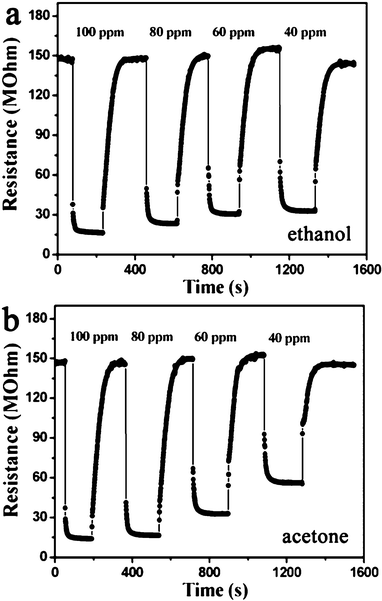 | ||
| Fig. 6 Response curves of the sensor to ethanol and acetone with increasing concentrations at an operating temperature of 250 °C. | ||
The gas sensing mechanism of the α-Fe2O3 sensor should follow the surface charge model, and may be explained by the change in resistance of the sensor upon exposure to different gas atmospheres.32–35 The sensing mechanism can be considered as follows: when the sensor is exposed to air, oxygen molecules are adsorbed on the surfaces of the nanorods and form chemisorbed oxygen species by capturing electrons from the conductance band of α-Fe2O3. In this process, oxygen molecules act as electron acceptors to result in a decrease of electron concentration and an increase of the resistance of the sensor. When the sensor is exposed to ethanol, or another reductive gas atmosphere at a moderate temperature, these gas molecules will react with the adsorbed oxygen species on the surface of the nanorods. This process releases the trapped electrons in the ionized oxygen species back to the conduction band and leads to an increase of electron concentration, which results in a decrease in the resistance. As a multifunctional semiconductor, α-Fe2O3 has potential application in gas sensors. More in-depth investigation is necessary to further develop the synthesis route and improve the gas sensing properties.
Conclusions
In summary, we have developed a simple hydrothermal route combined with subsequent acid dissolution for the controlled synthesis of monodisperse α-Fe2O3 discoid crystals. In our synthetic strategy, uniform and disperse α-Fe2O3 round-edged hexahedrons were first prepared via a hexamethylenetetramine (HMT)-assisted hydrothermal process. Then, the as-obtained hexahedrons could be easily transformed into discoid α-Fe2O3 crystals by using HCl as the etchant without influencing the original crystal phase. Field emission scanning electron microscope results and transmission electron microscope results revealed that these discoid crystals were built from nanoparticles. The obtained product was utilized in a sensor device and its gas sensing properties were examined. It is found that the sensor exhibited a high response and good recovery characteristics to ethanol at the operating temperature of 238 °C.Acknowledgements
This work was supported by the National Nature Science Foundation of China (No. 61074172, 61134010, and 61104203) and the Program for Chang Jiang Scholars and the Innovative Research Team in University (No. IRT1017). Project (20 121 105) Supported by the Graduate Innovation Fund of Jilin University.References
- J. Chen, L. N. Xu, W. Y. Li and X. L. Gou, Adv. Mater., 2005, 17, 582–586 CrossRef CAS.
- B. Wang, J. S. Chen, H. B. Wu, Z. Y. Wang and X. W. Lou, J. Am. Chem. Soc., 2011, 133, 17146–17148 CrossRef CAS.
- L. Aldon and J. C. Jumas, Solid State Sci., 2012, 14, 354–361 CrossRef CAS.
- N. Zhao, W. Ma, Z. Cui, W. Song, C. Xu and M. Gao, ACS Nano, 2009, 3, 1775–1780 CrossRef CAS.
- C. Burda, X. Chen, R. Narayanan and M. A. El-Sayed, Chem. Rev., 2005, 105, 1025–1102 CrossRef CAS.
- K. Woo, J. W. Hong, S. M. Choi, H. W. Lee, J. P. Ahn, C. S. Kim and S. W. Lee, Chem. Mater., 2004, 16, 2814–2818 CrossRef CAS.
- Z. Wang, D. Luan, S. Madhavi, C. M. Li and X. W. Lou, Chem. Commun., 2011, 47, 8061–8063 RSC.
- J. S. Chen, T. Zhun, X. H. Yang, H. G. Yang and X. W. Lou, J. Am. Chem. Soc., 2010, 132, 13162–13164 CrossRef CAS.
- L. P. Zhu, H. M. Xiao, X. M. Liu and S. Y. Fu, J. Mater. Chem., 2006, 16, 1794–1797 RSC.
- L. S. Zhong, J. S. Hu, H. P. Liang, A. M. Cao, W. G. Song and L. J. Wan, Adv. Mater., 2006, 18, 2426–2431 CrossRef CAS.
- M. H. Cao, T. F. Liu, S. Gao, G. B. Sun, X. L. Wu, C. W. Hu and Z. L. Wang, Angew. Chem., Int. Ed., 2005, 44, 4197–4201 CrossRef CAS.
- S. Z. Li, H. Zhang, J. B. Wu, X. Y. Ma and D. R. Yang, Cryst. Growth Des., 2006, 6, 351–353 CAS.
- R. L. Whetten, J. T. Khoury, M. M. Alvarez, S. Murthy, I. Vezmar, Z. L. Wang, C. C. Cleveland, W. D. Luedtke and U. Landman, Adv. Mater., 1996, 8, 428–433 CrossRef CAS.
- X. M. Liu, L. Au, J. Mclellan, Z. Y. Li, M. Marquez and Y. N. Xia, Nano Lett., 2007, 7, 1764–1769 CrossRef.
- X. W. Lou, Y. Wang, C. L. Yuan, J. Y. Lee and L. A. Archer, Adv. Mater., 2006, 18, 2325–2329 CrossRef CAS.
- Z. H. Jing and J. H. Zhan, Adv. Mater., 2008, 20, 4547–4551 CrossRef CAS.
- L. L. Wang and L. Gao, CrystEngComm, 2011, 13, 1998–2005 RSC.
- J. S. Chen, D. Y. Luan, C. M. Li, F. Y. C. Boey, S. Z. Qiao and X. W. Lou, Chem. Commun., 2010, 46, 8252–8254 RSC.
- P. Sun, X. X. He, W. B. Wang, J. Ma, Y. F. Sun and G. Y. Lu, CrystEngComm, 2012, 14, 2229–2234 RSC.
- P. Sun, L. You, D. W. Wang, Y. F. Sun, J. Ma and G. Y. Lu, Sens. Actuators, B, 2011, 156, 368–374 CrossRef.
- X. F. Yang, J. X. Fu, C. J. Jin, J. Chen, C. L. Liang, M. M. Wu and W. Z. Zhou, J. Am. Chem. Soc., 2010, 132, 14279–14287 CrossRef CAS.
- Q. Q. Xiong, J. P. Tu, Y. Lu, J. Chen, Y. X. Yu, Y. Q. Qiao, X. L. Wang and C. D. Gu, J. Phys. Chem. C, 2012, 116, 6495–6502 CAS.
- X. L. Fang, C. Chen, M. S. Jin, Q. Kuang, Z. X. Xie, S. Y. Xie, R. B. Huang and L. S. Zheng, J. Mater. Chem., 2009, 19, 6154–6160 RSC.
- R. L. Penn, J. Phys. Chem. B, 2004, 108, 12707–12712 CrossRef CAS.
- Z. Wang, D. Luan, C. M. Li, F. Su, S. Madhavi, F. Y. C. Boey and X. W. Lou, J. Am. Chem. Soc., 2010, 132, 16271–16277 CrossRef CAS.
- L. J. Bie, X. N. Yan, J. Yin, Y. Q. Duan and Z. H. Yuan, Sens. Actuators, B, 2007, 126, 604–608 CrossRef.
- J. F. Liu, X. Wang, Q. Peng and Y. D. Li, Sens. Actuators, B, 2006, 115, 481–487 CrossRef.
- V. R. Shinde, T. P. Gujar and C. D. Lokhande, Sens. Actuators, B, 2007, 123, 701–706 CrossRef.
- H. Gong, J. Q. Hu, J. H. Wang, C. H. Ong and F. R. Zhu, Sens. Actuators, B, 2006, 115, 247–251 CrossRef.
- Y. S. Kim, S. C. Ha, K. Kim, H. Yang, J. T. Park, C. H. Lee, J. Choi, J. Paek and K. Lee, Appl. Phys. Lett., 2005, 86, 213105 CrossRef.
- S. C. Naisbitt, K. F. E. Pratt, D. E. Williams and I. P. Parkin, Sens. Actuators, B, 2006, 114, 969–977 CrossRef.
- N. Yamazoe, Sens. Actuators, B, 1991, 5, 7–19 CrossRef.
- N. Yamazoe, G. Sakai and K. Shimanoe, Catal. Surv. Asia, 2003, 7, 63–75 CrossRef CAS.
- M. Egashira, Y. Shimizu, Y. Takao and S. Sako, Sens. Actuators, B, 1996, 35, 62–67 CrossRef.
- N. J. Dayan, S. R. Sainkar, R. N. Karekar and R. C. Aiyer, Thin Solid Films, 1998, 325, 254–258 CrossRef CAS.
Footnote |
| † Electronic Supplementary Information (ESI) available. See DOI: 10.1039/c2ra21445h |
| This journal is © The Royal Society of Chemistry 2012 |
