Two-photon excitation of the fluorescent nucleobase analogues 2-AP and tC†‡
R. S. K.
Lane
ab and
S. W.
Magennis
*ab
aThe School of Chemistry, The University of Manchester, Oxford Road, Manchester, M13 9PL, UK. E-mail: steven.magennis@manchester.ac.uk; Fax: +44 161 2751001
bThe Photon Science Institute, The University of Manchester, Alan Turing Building, Oxford Road, Manchester, M13 9PL, UK
First published on 20th September 2012
Abstract
We present two-photon (2P) excitation measurements of two commonly-used and commercially available fluorescent nucleobase analogues in aqueous solution: the environment-sensitive adenine analogue 2-aminopurine (2-AP), which emits in the UV region, and the environment-insensitive cytosine analogue 1,3-diaza-2-oxophenothiazine (tC), which emits in the green region. We studied the 2P excitation of free 2-AP and found that the same emissive states are accessed as via one-photon (1P) and three-photon (3P) excitation. The 2P cross section of 2-AP was 0.2 GM, which is similar to that of related molecules such as NADH. We studied tC incorporated in three single-stranded DNA oligonucleotides by 1P and 2P spectroscopy and microscopy. We found that the same emissive states were populated via either the resonant or non-resonant pathway with a 2P cross section of 1.5 GM. Time-resolved fluorescence studies suggested that tC exists in solution as two species, which we assigned as the amino and imino tautomers. Using confocal microscopy, we found that similar emission rates could be achieved for 2P excitation, as compared with 1P excitation, but without the strong photobleaching observed in the latter case. Although we were unable to detect tC fluorescence at the single-molecule level, these results indicate that multiphoton excitation of nucleobase analogues is a promising approach for imaging applications.
Introduction
Fluorescence spectroscopy and imaging are powerful techniques for studying the structure, dynamics and reactivity of nucleic acids. The naturally occurring nucleic acids are non-fluorescent, thereby requiring a fluorescent label. The most common approach is to attach external labels such as cyanine or rhodamine dyes to nucleotides. These are attached by long linkers, and are thus rather insensitive to local base interactions. An alternative approach is the use of a fluorescent analogue of one of the natural nucleobases. A range of nucleobase analogues for DNA and RNA have been developed and utilised, as summarised recently.1,2The vast majority of emissive base analogues are sensitive to their local environment: e.g. incorporation into oligonucleotides, the degree of base stacking, and sequence context. The archetypal environment-sensitive analogue is 2-aminopurine (2-AP), which can replace adenine (6-aminopurine) in DNA with minimal disruption to the DNA double helix, forming Watson–Crick hydrogen bonds with thymine.3–7 In contrast, a tricylic cytosine analogue, 1,3-diaza-2-oxophenothiazine (tC), has been shown recently to display fluorescent properties that are essentially insensitive to the microenvironment.1,8,9 Unlike external fluorophores, which have a high mobility due to the long linkers, nucleobase analogues also have a well-defined location and geometry relative to the overall DNA structure. The combination of environmental insensitivity, high brightness and restricted mobility of such labels can be an advantage in FRET and anisotropy studies. Variants of tC, tC0 and tCnitro have been shown to function as a FRET donor and acceptor, respectively.10
Whether environment sensitive or insensitive, we would like to be able to study such labelled nucleic acids in vivo, ideally down to the single-molecule level. This is challenging for nucleobase analogues for several reasons. Firstly, in spite of good quantum yields, the intrinsic absorption cross section of nucleobase analogues is much lower than extrinsic dyes, limiting their brightness. Secondly, most nucleobase analogues absorb at short wavelength, often in the UV, and are therefore prone to photobleaching. Thirdly, light penetration in biological media is poorer at short wavelength due to increased absorption and scattering.
Several attempts to detect individual nucleobase analogue molecules have been made. Wennmalm et al. studied 2-AP in various solvents using fluorescence correlation spectroscopy (FCS).11 Count rates per molecule (CPM) of up to 2 kHz per molecule and signal to background ratio per molecule (SBR) of 0.3 were found for 2-AP in water with excitation at 300 nm. A study by Sanabia et al. investigated the feasibility of single-molecule detection of the guanine analogue 3-MI using FCS and found a maximum CPM of 4 kHz and SBR of ca. 5 with excitation at 351 nm.12 While the CPM and SBR for 3-MI were poor compared to those of bright extrinsic dyes used for single-molecule studies, this did illustrate that single-molecule sensitivity is possible.
One of the aforementioned disadvantages of using nucleobase analogues is their short-wavelength absorption. A way to overcome this is to use multiphoton excitation, the simultaneous absorption of two or more longer wavelength photons.13 In addition to allowing deeper penetration into tissue in the near-IR, multiphoton excitation allows 3D localisation of light absorption, without exciting out of focus chromophores. Out of focus photobleaching is therefore also reduced. Furthermore, changes in vibronic coupling or the optical selection rules for multiphoton excitation can result in the more efficient population of the excited states, or in completely new excited states being accessed.13 Other possible advantages of multiphoton excitation include a reduction of background fluorescence from optical components, greater spectral separation of excitation and emission bands, and the simultaneous excitation of multiple fluorophores.14
A few studies have investigated the multiphoton excitation of nucleobase analogues. Katilius and Woodbury demonstrated that 6-MI, a guanine analogue, could undergo two-photon (2P) excitation in the region 700–780 nm with a cross section of 2.5 GM units (Goeppert-Mayer, 1 GM = 10−50 cm4 s photon−1),15 while Stanley et al. showed that the adenine analogue 6 MAP could be excited from 614–700 nm, with a cross section of 3.4 GM.16 Katilius and Woodbury also showed that 2-AP could be excited by a three-photon (3P) process in the range 840 to 920 nm.15 The 3P cross section was not reported, but it was concluded from FCS studies that 3P excitation of 2-AP was unsuitable for imaging applications. 2P excitation of 2-AP was not reported in the latter study due to limitations in the laser tuning range. In fact, the only report of the 2P fluorescence of 2-AP is from a study into the use of photonic crystals for signal enhancement of dyes.17 This paper reported the observation of the excitation of 2-AP doped in a polymer film following non-resonant excitation at 610 nm; neither 2PE in solution, nor 2P cross sections were reported.
Here, we report 2P fluorescence spectroscopy in aqueous solution of the important nucleobase analogues 2-AP and tC. In addition, we have studied tC using polarisation-resolved one-photon (1P) and 2P confocal fluorescence microscopy. We discuss our promising results in the context of imaging and single-molecule applications.
Results and discussion
Two-photon spectroscopy of 2-AP
The structure of the 7H and 9H tautomers of 2-AP are shown in Fig. 1a. It is known that free 2-AP exists as a mixture of ca. 60% of 9H and 40% of the 7H tautomer in aqueous solution.18 These tautomers have similar photophysical properties, but can be resolved using time-resolved fluorescence.18 The fluorescence of 2-AP in water was studied here following excitation at wavelengths intended to allow 1P, 2P and 3P excitation. The use of a mode-locked Ti:sapphire oscillator, alone or combined with either an optical parametric oscillator (OPO) or a third harmonic generator, allowed access to a wide range of excitation wavelengths. As expected, there was no resonant absorption at the longer wavelengths used for multiphoton excitation.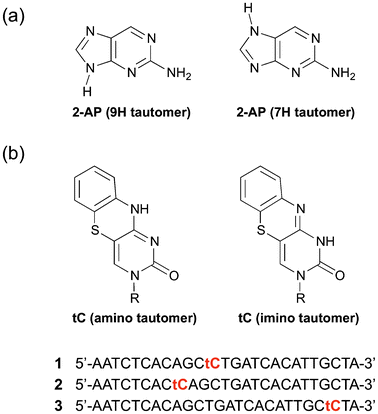 | ||
| Fig. 1 (a) Structure of 2-AP (9H and 7H tautomers). (b) Structure of tC (amino and imino tautomers) and sequence of 26-mer oligos 1, 2 and 3 incorporating a single tC. | ||
The emission spectra of a 0.01 M solution of 2-AP at different excitation wavelengths are shown in Fig. 2. Within error, these three emission spectra are identical; the features at long wavelength with 584 nm excitation were due to instability in the OPO source. We note that the 3P emission spectrum was not reported previously, but as predicted it looks identical to the 1P spectrum.15 For excitation at either 584 nm or 800–960 nm, operating the laser in continuous wave mode, but with the same average power, resulted in no detected fluorescence.
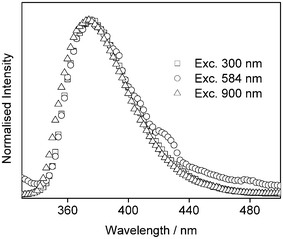 | ||
| Fig. 2 Ensemble emission spectra of 2-AP following one-, two- and three-photon excitation (300, 584 and 900 nm, respectively). | ||
The fluorescence intensity was studied as a function of excitation power at both 584 nm and 900 nm (Fig. 3). Excitation at 584 nm results in a log–log plot with slope of 1.83 ± 0.09, corresponding to a 2P process. Note that if the lowest power point is not included, the fit is 2.12 ± 0.04. At 900 nm, the log–log plot gives a slope of 3.05 ± 0.04, corresponding to a 3P process, as observed previously.15
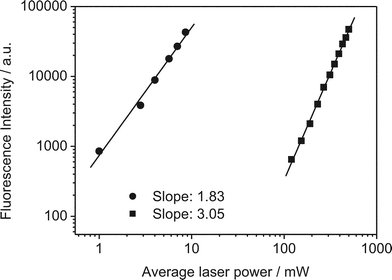 | ||
| Fig. 3 Fluorescence intensity vs. power for 2-AP in water following non-resonant excitation at 584 nm (circles) and 900 nm (squares). The solid line shows the best straight line fit to the data (R = 99.9%). | ||
The lifetimes of 2-AP following either 1P or 3P excitation were identical at 8.2 ns (Fig. S1†). Dilution of the 0.01 M solution to 10−6 M resulted in an increase of the lifetime from 8.2 ns to ca. 12 ns. The latter lifetime agrees with earlier studies of dilute solutions.18 This indicates that there is some concentration quenching at 0.01 M. We did not measure the lifetime of the 0.01 M solution of 2-AP with 584 nm excitation. However, we have previously observed a lifetime of ca. 10 ns from 2-AP from a 0.005 M aqueous solution with excitation at 580 nm. The measurements at 300 and 900 nm used front face detection, whereas the measurement at 580 nm used a right-angle geometry. Thus the higher lifetime at 580 nm is likely due to a combination of concentration quenching and inner filter effects.
We measured the 3P emission intensity as a function of excitation wavelength (800–960 nm). The excitation spectrum was narrower than the 1P spectrum and blue shifted (Fig. S2†) to around 880 nm, in agreement with the earlier study.15 The 1P absorption maximum is 305 nm, while the 3P maximum of 880 nm corresponds to a 1P wavelength of 293 nm. We did not record the 2P intensity as a function of excitation wavelength due to the instability of the OPO. However, the 2P excitation wavelength of 584 nm corresponds to a 1P wavelength of 292 nm, which is likely to be close to the 2P maximum.
Taken together, these data demonstrate that the same lowest excited state is populated via 1P, 2P or 3P excitation. To assess the efficiency of the 2P process, the 2P cross-section (σ2) was measured by comparing it to a reference compound, bis-MSB in cyclohexane, for which the 2P cross section is known.19 By measuring the 2-AP and bis-MSB under identical conditions, we calculated the cross section to be 0.2 GM. This is very similar in magnitude to that of NADH, when measured under similar excitation wavelength and buffer conditions and also using bis-MSB as the reference.20 Although weakly absorbing, NADH has been used frequently for 2P imaging in vivo.14 However, since the quantum yield of 2-AP emission is much lower when incorporated in an oligonucleotide, its use in sensitive imaging applications may be limited. Although we have studied free 2-AP here, we do not anticipate significant differences between the 7H and 9H tautomers, given their similar 1P photophysical properties.
Two-photon spectroscopy of tC
We studied tC incorporated in three different oligonucleotides in a Tris buffer at pH 7.5. The structure of tC in two tautomeric forms (see discussion below) and the oligo sequences are shown in Fig. 1b. In oligos 1 and 3, the tC is flanked by the bases C and T while in oligo 2 it is flanked by C and A. From previous studies it is known that the fluorescence properties of tC are relatively insensitive to sequence context or whether it is incorporated in single or double-stranded nucleotides.8 The absorption and emission spectra agree with those found in the literature for similar tC-labelled oligonucleotides.To investigate whether the tC dye could be excited via a 2P process, we irradiated at 800 nm with a broadband Ti:sapphire laser. The 2P emission spectrum is identical to the 1P spectrum (Fig. 4). As with 2-AP, tC has no resonant absorption at 800 nm. Operating the laser in continuous wave mode, but with the same average power, resulted in no detected emission. Therefore, the emission results from non-resonant excitation. The emission intensity was studied as a function of excitation power. Fig. 5 shows the results of the power dependence measurements at 800 nm; the slope of the log–log plot is 1.89 ± 0.02, demonstrating that excitation occurred by a 2P mechanism.
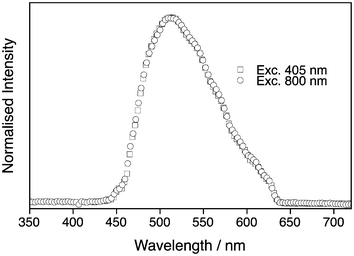 | ||
| Fig. 4 Ensemble emission spectra of tC (oligo 1) following one- and two-photon excitation (405 and 800 nm, respectively). Note that there are distortions in the long-wavelength side of the spectra due to the emission filter used. | ||
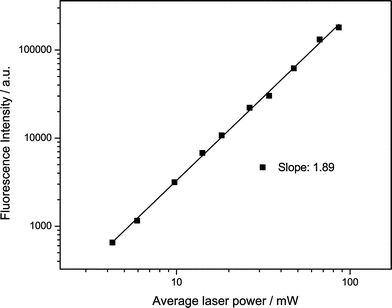 | ||
| Fig. 5 Fluorescence intensity vs. power for tC (oligo 1) following non-resonant excitation at 800 nm. The solid line shows the best straight line fit to the data (R = 99.9%). | ||
The lifetime of oligo 3 was checked in bulk solution using time-correlated single photon counting (TCSPC) following excitation at either 405 nm or 800 nm, with detection at 515 nm. As shown in Fig. 6, the decays are identical, showing that the same emissive states are populated. Due to the low signal with 800 nm excitation, these decays were recorded at low resolution (0.195 ns/channel). The decay following resonant excitation at 405 nm fitted to a monoexponential with a lifetime of 5.47 ns (χ2 = 1.29). A biexponential fit gave an improved fit of χ2 = 0.96 with lifetimes of 3.66 and 6.03 ns and A factors of 0.31 and 0.69, respectively. The decay following 2P excitation at 800 nm fitted to a monoexponential with lifetime of 5.35 ns (χ2 = 1.28), while a biexponential fit returned lifetimes of 3.01 and 5.73 ns with A-factors of 0.19 and 0.81, respectively, and an improved fit (χ2 = 1.14). To investigate this in more detail, we also measured the 1P decay at high resolution (0.012 ns/channel) (Fig. S3†); a monoexponential fit gave a lifetime of 5.48 ns (χ2 = 1.40), while a biexponential fit was better, with lifetimes of 2.86 and 5.75 ns and A factors of 0.17 and 0.83, respectively (χ2 = 1.15).
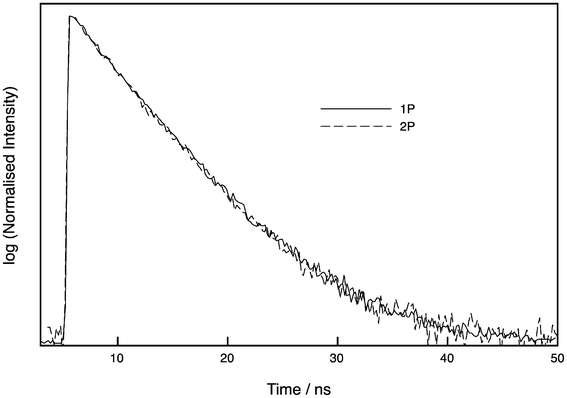 | ||
| Fig. 6 Normalised time-resolved decays of tC (oligo 3) following excitation at 405 nm (one-photon, 1P) and 800 nm (two-photon, 2P). The two decays are indistinguishable. See ESI† for details. | ||
Previously, the lifetime of tC incorporated in single stranded DNA has been reported to have a monoexponential lifetime of 5.3–6.5 ns.9 A sequence in which tC was flanked by C and T, as in oligo 3, had a lifetime of 5.6 ns.9 Therefore, our lifetime measurements are consistent with previous reports. Although the decays give reasonable single-exponential fits, the fits discussed above provide evidence that there may be an additional component of around 3 ns. The A factors represent the fraction of each emitting species, suggesting there is a sizeable proportion (17%) of a second species. As mentioned above, other fluorescent nucleobases such as 2-AP are known to exist as tautomers,18 though we are not aware of any reports that provide direct evidence of alternative tC tautomer structures. However, in order to explain the ambivalent base pairing properties of tC (with G or A), it was proposed that tC undergoes tautomerisation from the amino form, which forms Watson–Crick pairs with G, to the imino form (see Fig. 1 for the tautomeric structures of tC).21 Therefore, we tentatively assign the major and minor species observed here by TCSPC to the amino and imino forms, respectively.
To measure the 2P cross-section, the emission intensity of tC (oligo 1) was compared to that of a reference compound, rhodamine B in methanol. A value of 1.5 GM was obtained, assuming a quantum yield of 0.21 for tC flanked by CT.9 This cross section is 7.5 times higher than was measured for 2-AP, and is similar to those reported for 6-MI (2.5 GM)15 and 6MAP (3.4 GM).16
The 2P excitation spectrum of tC (oligo 3) is shown in Fig. 7, which shows the integrated emission as a function of excitation wavelength from 720–920 nm, normalised for differences in excitation power. Overlaid in Fig. 7 is the corrected 1P excitation spectrum of the same sample plotted from 360–460 nm, where the scale for the 2P spectrum is twice that of the 1P spectrum. Although the two spectra are broadly similar, there is a red shift in the 2P spectrum, which is unusual since most 2P excitation spectra are blue-shifted.22 As the 1P and 2P lifetimes appear to be identical at the same emission wavelength, this is unlikely to be due to differences in the relative cross sections of the proposed tC tautomers. Instead, it suggests that the excited state populations are different for resonant and non-resonant excitation. A detailed time-resolved study as a function of excitation and emission wavelength, as was done for 2-AP,18 could offer further insight.
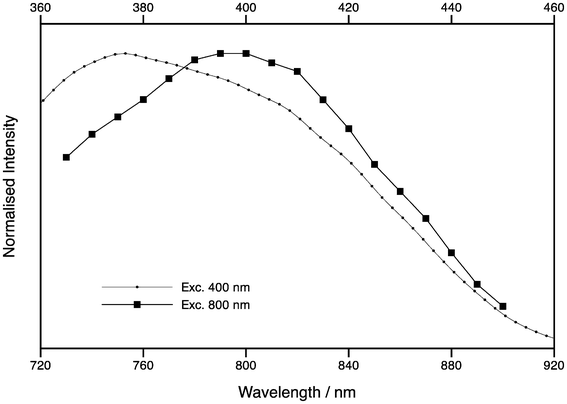 | ||
| Fig. 7 Excitation spectra of tC (oligo 3) following one-photon excitation (circles) and two-photon excitation (squares). The top x-axis is for one-photon excitation, while the bottom axis is for two-photon excitation. | ||
One- and two-photon microscopy of tC
Since the emission of tC is in the visible region, we were able to study it using our confocal microscope, with excitation at 405 nm and 800 nm and detection at 500–550 nm using two detectors, with one parallel and the other perpendicular to the laser polarisation. The tC-labelled oligos were in buffer on a glass coverslip. For 1P excitation, we observed a rapid reduction in fluorescence intensity upon illuminating the sample, which then tailed off to a constant value (Fig. 8a). A 5-fold reduction in the excitation power decreased the amplitude of the intensity decay significantly and reduced the steady-state intensity by a factor of ca. 2 (Fig. 8b). We attribute the rapid decrease in signal intensity to photobleaching of molecules in the focus, which reaches a steady state due to the diffusion of new tC molecules into the laser focus.23 As expected for tC incorporated in a large oligo, there was a high steady-state anisotropy of 0.099, 0.11 and 0.13 for oligos 1, 2 and 3, respectively. The intensity profile in both polarisation channels was fitted to a biexponential decay (Fig. 8a) with similar decay components. In the parallel channel, the decay fitted to a lifetime of 0.34 ± 0.04 s and 5.6 ± 0.9 s, with A-factors of 0.74 and 0.26, respectively; the perpendicular fits were similar, with lifetimes of 0.22 ± 0.03 s and 4.6 ± 0.5 s and A factors of 0.65 and 0.35. Given the similarity between the A-factors for photochemistry and for fluorescence lifetime, the two photochemical rate constants might be attributed to the two tC tautomers discussed previously. However, it is also possible to observe non-exponential bleaching decays in confocal experiments due to the complex photophysics at high irradiance24 or to the illumination conditions,25,26 so this is not yet conclusive.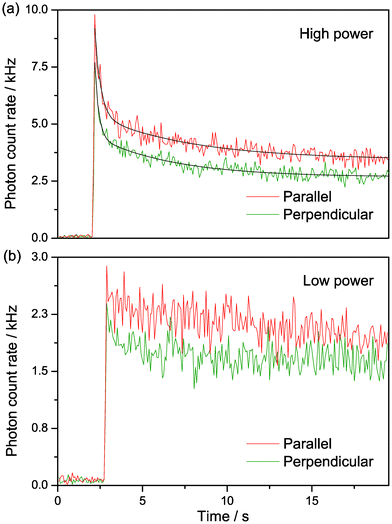 | ||
| Fig. 8 Polarisation-resolved confocal microscopy of tC (oligo 1) with resonant excitation at 405 nm. 25 nM in Tris buffer, pH 7.5. (a) Intensity traces at 370 μW average power at sample (“high power”). The black lines show biexponential fits of the intensity decays, as described in the text. (b) Intensity traces at low excitation power 70 μW average power at sample (“low power”). The laser light was blocked for the first 2–3 s of measurement in both (a) and (b). | ||
Fig. 9 shows the polarisation-resolved intensity trace following 2P excitation of oligo 1. The overall signal was around six times higher than for the 1P experiment in Fig. 8, showing that comparable count rates can be measured under 2P conditions (note that the sample concentration was around six times higher in the 2P experiment). Importantly, we did not observe any photobleaching at these count rates for 2P excitation. In addition, the steady-state anisotropy increased to 0.28 for 2P excitation, around twice the value that we observed for 1P excitation of the same sample. The high anisotropy values following 1P and 2P excitation confirm that we are detecting emission from tC incorporated in a larger oligo. The greater anisotropy in the case of 2P excitation is likely due to the different photoselection properties, which results in a more oriented excited state population.27
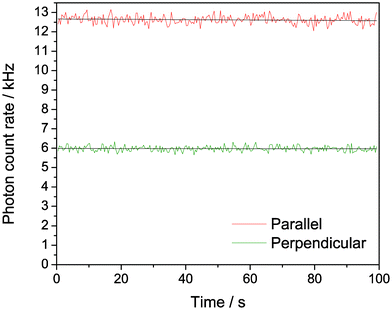 | ||
| Fig. 9 Polarisation-resolved confocal microscopy of tC (oligo 1), with non-resonant excitation at 800 nm. 180 nM in Tris buffer, pH 7.5; 185 mW average power at sample. | ||
We also attempted 1P and 2P FCS for the tC samples, but the signal was too low to obtain adequate correlation curves. We were able to record FCS curves of the Rh110 dye under identical conditions and we found that the focal volumes were similar for both 1P and 2P excitation. Using the Rh110 FCS data, we were able to calculate the number of tC molecules in the focus, which allowed us to estimate the CPM of tC to be ca. 0.1 kHz for 2P excitation under our experimental conditions. The CPM of tC is two orders of magnitude lower than the CPM of the bright organic dyes commonly used for single-molecule studies, and is similar to the background count rate of buffer (SBR ∼1); where we define SBR as (S − B)/B, as used by Sanabia et al.12 Nevertheless, these results are very encouraging and there is room for improvement. The quantum yield of tC is around 20%, so there is scope for improvement there.9 The two-photon cross section is also lower than others reported, so changes to both of those properties would make FCS, and possibly single-molecule detection, feasible.12 Other gains in signal may come from the use of antifade reagents, which can reduce bleaching at high powers and increase the brightness.28 In addition to chemical modifications, it should also be possible to improve the signal by optical means. In particular, the use of shaped ultrafast laser pulses can ensure that the pulses reaching the sample are as short as possible. The high numerical aperture objectives used in microscopy can severely broaden and degrade the excitation pulse; shaping the pulse to produce a short pulse can allow a higher signal with less bleaching.29,30
Conclusion
We have studied the 2P excitation of two important nucleobase analogues in aqueous solution. The environment-sensitive adenine analogue 2-AP could be excited via a 2P excitation process, accessing the same emissive state as via 1P and 3P excitation. The 2P cross section of the UV-emitting 2-AP is low, limiting its use for imaging applications requiring low labeling densities. We also demonstrated the 2P excitation of the environment-insensitive analogue tC and presented evidence that it exists as a mixture of two species, which we assign as the amino and imino tautomers. Since tC has a much higher cross section than 2-AP and emits in the visible region, we also investigated its potential for microscopy applications. In comparison to 1P excitation, we found that similar emission signals could be achieved for 2P excitation but without the strong photobleaching observed for 1P excitation. Although we were not able to detect single molecules of tC, the results are encouraging and suggest that there is plenty of scope for finding nucleobase analogues with significantly improved performance using non-resonant excitation.Experimental
General
2-Aminopurine (>99%) and bis-MSB (Fluka) were obtained from Aldrich Chemical Co. and used as received. Cyclohexane (Fluka) and water (HPLC, Fisher) were used as received. Solvents and buffers were checked for background fluorescence prior to use. Oligonucleotides were synthesised and labelled (Purimex GmbH, Grebenstein) using the tC-CE phosphoramidite (Glen Research). For measurements, 2-AP was dissolved in water to 10 mM and tC-labelled oligos were prepared in buffer containing 20 mM Tris, 15 mM NaCl, and 1 mM MgCl2 at pH 7.5. All measurements were recorded at 21 ± 1 °C.Fluorescence spectroscopy of 2-AP
Excitation was performed with a 10 W Verdi and Mira Ti:sapphire laser (Coherent), producing pulses of ca. 150 fs at 76 MHz, with a wavelength of 900 nm (ca. 800 mW, 15 nm FWHM). For 1P excitation, the fundamental was used; for 2P excitation the fundamental was used as the seed for a synchronously-pumped optical parametric oscillator (Coherent) at 584 nm; and for 3P excitation the fundamental was frequency tripled to 300 nm. For lifetime measurements, the repetition rate was reduced to 4.75 MHz using a pulse picker and detected using TCSPC. See ESI† for further details.Fluorescence spectroscopy and microscopy of tC
A laser diode module (ZM18H-F blau, Z-Laser, Germany) was used to provide 1P excitation at 405 nm. For power dependence and cross section measurements, a broadband Ti:sapphire laser (Mantis, Coherent) and compressor (CPC, Coherent) was used to provide 2P excitation at 800 nm; this produced output pulses of ca. 20 fs at 80 MHz. For lifetime measurements, a Mai Tai Ti:sapphire laser was frequency-doubled at 8 MHz and detected using TCSPC. See ESI† for further details.For microscopy, the same lasers were combined with a home-built confocal microscope, which has been described previously.31 The primary dichroic was 505DCXR (Chroma) for 405 nm and 675DCSPXR (Chroma) for 800 nm excitation. The laser beam diameter at the back aperture of the objective was approximately one-half of the aperture diameter. The average laser power at the sample plane was 370 μW at 405 nm (irradiance of ca. 40 kW cm−2) and 185 mW at 800 nm (irradiance of ca. 104 kW cm−2). The emission was split by a polarising cube and each polarisation component was detected through a 525/50 nm bandpass filter (Chroma, USA) by an avalanche photodiode (APD) detector (PDM50C, MPD, Italy). The use of the two APDs allowed simultaneous independent measurement of parallel and perpendicular components (relative to the excitation beam) of the fluorescence to be measured. The signals from both detectors were routed to a digital autocorrelator (ALV-7002, ALV, Germany) connected to a PC. The fluorescence anisotropy, r, was calculated as:
| r = (IVV − IVH)/(IVV + 2IVH) | (1) |
Two-photon cross section
The 2P cross sections (σ2) of 2-AP and tC were measured, using the experimental setups described above, by comparing spectra to those of a standard using eqn (2), as described previously.33 | (2) |
Acknowledgements
We thank Alisdair Macpherson for assistance with the broadband Ti:sapphire laser and Thomas Badcock and Daniel Velázquez for help with TCSPC. Part of this work was conducted by SWM while working at the COSMIC research centre at the University of Edinburgh. SWM acknowledges the award of an EPSRC advanced research fellowship (EP/D073154).References
- L. M. Wilhelmsson, Q. Rev. Biophys., 2010, 43, 159–183 CrossRef CAS.
- R. W. Sinkeldam, N. J. Greco and Y. Tor, Chem. Rev., 2010, 110, 2579–2619 CrossRef CAS.
- D. C. Ward, E. Reich and L. Stryer, J. Biol. Chem., 1969, 244, 1228–1237 CAS.
- C. R. Guest, R. A. Hochstrasser, L. C. Sowers and D. P. Millar, Biochemistry, 1991, 30, 3271–3279 CrossRef CAS.
- S. O. Kelley and J. K. Barton, Science, 1999, 283, 375–381 CrossRef CAS.
- E. L. Rachofsky, R. Osman and J. B. A. Ross, Biochemistry, 2001, 40, 946–956 CrossRef CAS.
- R. K. Neely, D. Daujotyte, S. Grazulis, S. W. Magennis, D. T. F. Dryden, S. Klimašauskas and A. C. Jones, Nucleic Acids Res., 2005, 33, 6953–6960 CrossRef CAS.
- L. M. Wilhelmsson, P. Sandin, A. Holmen, B. Albinsson, P. Lincoln and B. Norden, J. Phys. Chem. B, 2003, 107, 9094–9101 CrossRef CAS.
- P. Sandin, L. M. Wilhelmsson, P. Lincoln, V. E. C. Powers, T. Brown and B. Albinsson, Nucleic Acids Res., 2005, 33, 5019–5025 CrossRef CAS.
- K. Borjesson, S. Preus, A. H. El-Sagheer, T. Brown, B. Albinsson and L. M. Wilhelmsson, J. Am. Chem. Soc., 2009, 131, 4288–4293 CrossRef.
- S. Wennmalm, H. Blom, L. Wallerman and R. Rigler, Biol. Chem., 2001, 382, 393–397 CrossRef CAS.
- J. E. Sanabia, L. S. Goldner, P. A. Lacaze and M. E. Hawkins, J. Phys. Chem. B, 2004, 108, 15293–15300 CrossRef CAS.
- G. S. He, L. S. Tan, Q. Zheng and P. N. Prasad, Chem. Rev., 2008, 108, 1245–1330 CrossRef CAS.
- W. R. Zipfel, R. M. Williams and W. W. Webb, Nat. Biotechnol., 2003, 21, 1368–1376 CrossRef.
- E. Katilius and N. W. Woodbury, J. Biomed. Opt., 2006, 11, 044004 CrossRef.
- R. J. Stanley, Z. J. Hou, A. P. Yang and M. E. Hawkins, J. Phys. Chem. B, 2005, 109, 3690–3695 CrossRef CAS.
- J. Y. Ye, M. Ishikawa, Y. Yamane, N. Tsurumachi and H. Nakatsuka, Appl. Phys. Lett., 1999, 75, 3605–3607 CrossRef CAS.
- R. K. Neely, S. W. Magennis, D. T. F. Dryden and A. C. Jones, J. Phys. Chem. B, 2004, 108, 17606–17610 CrossRef CAS.
- W. G. Fisher, E. A. Wachter, F. E. Lytle, M. Armas and C. Seaton, Appl. Spectrosc., 1998, 52, 536–545 CrossRef CAS.
- B. Kierdaszuk, H. Malak, I. Gryczynski, P. Callis and J. R. Lakowicz, Biophys. Chem., 1996, 62, 1–13 CrossRef CAS.
- G. Stengel, B. W. Purse, L. M. Wilhelmsson, M. Urban and R. D. Kuchta, Biochemistry, 2009, 48, 7547–7555 CrossRef CAS.
- C. Xu and W. W. Webb, J. Opt. Soc. Am. B, 1996, 13, 481–491 CrossRef CAS.
- C. Eggeling, A. Volkmer and C. A. M. Seidel, ChemPhysChem, 2005, 6, 791–804 CrossRef CAS.
- R. Zondervan, F. Kulzer, M. A. Kol'chenko and M. Orrit, J. Phys. Chem. A, 2004, 108, 1657–1665 CrossRef CAS.
- A. J. Berglund, J. Chem. Phys., 2004, 121, 2899–2903 CrossRef CAS.
- M. Prummer and M. Weiss, Phys. Rev. E: Stat., Nonlinear, Soft Matter Phys., 2006, 74, 021115 CrossRef CAS.
- J. R. Lakowicz, I. Gryczynski, Z. Gryczynski, E. Danielsen and M. J. Wirth, J. Phys. Chem., 1992, 96, 3000–3006 CrossRef CAS.
- T. Cordes, A. Maiser, C. Steinhauer, L. Schermelleh and P. Tinnefeld, Phys. Chem. Chem. Phys., 2011, 13, 6699–6709 RSC.
- P. Xi, Y. Andegeko, L. R. Weisel, V. V. Lozovoy and M. Dantus, Opt. Commun., 2008, 281, 1841–1849 CrossRef CAS.
- R. S. K. Lane, A. N. Macpherson and S. W. Magennis, Opt. Express. Search PubMed , submitted.
- T. Sabir, G. F. Schröder, A. Toulmin, P. McGlynn and S. W. Magennis, J. Am. Chem. Soc., 2011, 133, 1188–1191 CrossRef CAS.
- J. Schaffer, A. Volkmer, C. Eggeling, V. Subramaniam, G. Striker and C. A. M. Seidel, J. Phys. Chem. A, 1999, 103, 331–336 CrossRef CAS.
- L. S. Natrajan, A. Toulmin, A. Chew and S. W. Magennis, Dalton Trans., 2010, 39, 10837–10846 RSC.
- M. H. V. Werts, N. Nerambourg, D. Pelegry, Y. Le Grand and M. Blanchard-Desce, Photochem. Photobiol. Sci., 2005, 4, 531–538 CAS.
- J. Sujatha and A. K. Mishra, J. Photochem. Photobiol., A, 1996, 101, 245–250 CrossRef CAS.
- J. N. Demas and G. A. Crosby, J. Phys. Chem., 1971, 75, 991–1024 CrossRef.
- N. S. Makarov, M. Drobizhev and A. Rebane, Opt. Express, 2008, 16, 4029–4047 CrossRef CAS.
Footnotes |
| † Electronic Supplementary Information (ESI) available. See DOI: 10.1039/c2ra21881j |
| ‡ In memory of Professor Har Gobind Khorana (1922–2011), acknowledging his legacy to the scientific community |
| This journal is © The Royal Society of Chemistry 2012 |
