Electrical and optical properties of electrospun TiO2-graphene composite nanofibers and its application as DSSC photo-anodes
Asha
Anish Madhavan
,
Sujith
Kalluri
,
Daya
K Chacko
,
T. A.
Arun
,
Sivakumar
Nagarajan
,
Kavasseri R. V.
Subramanian
*,
A.
Sreekumaran Nair
*,
Shantikumar V.
Nair
* and
Avinash
Balakrishnan
*
Nanosolar Division, Amrita Centre for Nanosciences and Molecular Medicine, Ponekkara, Kochi, India. E-mail: avinash.balakrishnan@gmail.com; nairshanti@gmail.com; sreekumarannair@aims.amrita.edu; krvsubramanian@aims.amrita.edu; Fax: +91-484-2802020; Tel: +91-484-2802020
First published on 23rd October 2012
Abstract
The present study reports the electrospinning of TiO2-graphene composite nanofibers to develop conductive nano-fiber mats using polyvinylpyrrolidone as a carrier solution. This carrier solution was sublimated at 450 °C to attain a complete conducting continuous nanofibrous network. It was observed during the annealing that as the graphene content was increased to 1 wt% the continuous fiber morphology was lost. Annealing did not have any impact on the fiber diameter (∼150 nm) or morphology as the graphene content was maintained between 0.0–0.7 wt%. The surface porosity of these samples was found be in the range of 45–48%. The presence of graphene in TiO2 nanofibers was confirmed using Raman spectroscopy. Photoluminescence spectroscopy showed excitonic intensity to be lower in graphene-TiO2 samples indicating that the recombination of photo-induced electrons and holes in TiO2 can be effectively inhibited in the composite nanofibers. Fluorescence spectroscopy was used to confirm this phenomenon where blue and quenched emissions were observed for the electrospun TiO2 nanofibers and composite fibers, respectively. Conductivity measurements showed the mean specific conductance values obtained for TiO2-graphene composites to be about two times higher values than that of the electrospun TiO2 fibers. Assembling these TiO2-graphene fiber composites as photoanodes in dye sensitized solar cells, an efficiency of 7.6% was attained.
Introduction
Carbon materials such as graphite,1 carbon black,2 mesoporous carbon,3 carbon nanotube (CNT),4,5 and graphene6–8 have attracted great deal of attention for potential applications in various optoelectronic devices.9,10 Graphene is a mono-layer structure of two-dimensional graphite. Single layered graphene is highly transparent and absorbs ∼2.3% of incident white light11 making it highly suitable for photo-anode applications in dye sensitized solar cells (DSSCs). Its versatility in terms of high conductivity, mechanical strength and energy gap tunability,12 compared to different semiconductor oxides like TiO2, makes it a highly desirable secondary phase in composite form. Inclusion of graphene into semiconductor oxides like TiO2 has another advantage of high surface area (theoretical value of 2630 m2 g−1)13 which can be beneficial in improving the interfacial contact in the composite. Previous studies have shown that the direct interaction between TiO2 and graphene can be used to prevent the re-aggregation of the exfoliated sheets of graphene.14 This phenomenon has been mainly attributed to the redox ability of the excited TiO2 phase. Owing to the observation of charge injection from excited TiO2 to restore the conjugated π-bonded carbon, it can be expected that the presence of graphene in such composite can enhance the electron-accepting ability of grapheme, thereby enhancing the electron transport and thus impede the charge recombination of excited TiO2.15 These properties can be beneficial for the applications of TiO2 in solar cells, especially in dye-sensitized solar cells (DSSCs). There have been several reports of incorporating graphene into TiO2 using several routes like hydrothermal,16,17 electrospinning,18 water-phase synthesis,19 solvothermal reaction,20etc. In the present study, we report electrospinning of different graphene content TiO2 as continuous nanofibers. The amount of graphene in the composite is varied from 0.0–1.0 wt% to obtain morphologically stable electrospun nanofibrous mats with increasing conductivity. Furthermore, on the application front, we report the first examples of employing these composites as photo-anodes in DSSC applications. The preliminary results show an efficiency of 7.6% for TiO2-graphene based photoanodes as compared to 6.3% for bare TiO2 electrospun fibers.Experimental
All the chemicals used in the present study were of analytical grade obtained from Sigma Aldrich. 0.5 g of polyvinylpyrollidone (PVP) was completely dissolved in 3 ml of methanol solution. 1 ml of glacial acetic acid and titanium isopropoxide was introduced into the PVP solution and completely dissolved under constant stirring at room temperature. Graphene powder (Quantum Corporation, India) in different weight proportion (0.2, 0.5, 0.7 and 1 wt%) was added separately to this solution mixture and rigorously stirred to obtain uniform blend solutions. 5 ml of the each blend solution was taken in a syringe and fed into an electrospinning set up (Zeonics System, India). Electrospinning was performed for 4 h at 28 °C at an applied potential of 12 kV by keeping a tip to collector distance of 14 cm and a flow rate of 1 ml h−1. The relative humidity of the chamber was kept at ∼55%. The electrospinning was done over Al foils with dimensions 8 cm × 8 cm × 0.2 mm. After electrospinning, these samples were annealed at 450 °C for 1 h to sublimate binder PVP from the electrospun mats. Based on the graphene content in the TiO2, the electrospun samples were designated as G-T-0.2, G-T-0.5, G-T-0.7 and G-T-1 where G, T and the numbers represent graphene, TiO2 and the weight % of graphene, respectively.Morphological and structural analyses for the processed nanofibrous mats were done using field emission scanning electron microscopy-energy dispersive X-ray (FESEM-EDX) (JEOL JSM 6490 LA) and transmission electron microscopy (TEM, JEOL, Japan). Phase analyses were performed using X-ray diffractometry (XRD, X'Pert PRO Analytical), Raman spectroscopy (Witec confocal Raman -300 AR) and X-ray photoelectron spectroscopy (XPS, Kratos Analytical, Ultra axis). Image analysis software (Gmdh, USA) was used to determine the diameters and average surface pore sizes of the electrospun fibers.
Viscometer (Brookfield Corporation DV-II + Pro) was used to estimate the viscosity of the polymeric blend solution. The photo-luminescent (PL) spectra of the samples were obtained using spectrophotometer (Horiba Jobin Yvon Fluoroman-4) at an excitation wavelength of 350 nm. The fluorescent microscope imaging of the samples was performed using Olympus BX51 under an excitation wavelength of ∼350 nm.
Scanning electrochemical microscope ((SECM, Nanotech, Munich), using Pt probe (25 μm2) and lithium perchlorate as a conducting medium) was used for measuring the current voltage (I–V) characteristics and subsequently the specific conductance (G, S cm−2).
These experimental data were analyzed using a conventional ranking method21,22 to yield the Weibull parameters, for the complete characterization of the statistical properties of the measured specific conductance. This was done by arranging the results measured at each point from the lowest to the highest. The fth result in the set of n = 20 data was assigned a cumulative probability of occurrence, Pf, which was calculated with
 | (1) |
The measured specific conductance (S cm−2, (G), and the cumulative probability, Pf, were then analyzed, by using a simple, least-square regression method, according to the alternative form of the well-known two-parameter Weibull distribution equation
 | (2) |
As an application, G-T-0.7 electrospun fibers were employed as photo-anodes in the DSSC. Prior to the DSSC assembly, photo-anodes comprising of an electrospun TiO2-graphene layer on FTO (fluorine doped tin oxide) glasses were soaked in 0.3 mM ruthenium(II) dye (N719, Solaronix) in an acetonitrile and ter-butanol solution for 12 h and coupled with the platinized FTO counter electrode. A paraffin spacer was introduced between the two electrodes to prevent the occurrence of a short-circuit. Physical clamping of these two electrodes was done and an electrolyte comprising of 0.01 M lithium iodide, 0.001 M iodine, 0.6 M butyl methyl imadizolium iodide and 0.5 M tertiary butyl pyridine was locally introduced between the electrodes. Post this procedure, the internal spacing between electrodes was sealed off to prevent any electrolyte leakage. The current–voltage (I–V) characteristics of the assembled DSSCs were measured under an illumination of one sun using a solar simulator (Newport, Oriel class A). Keithley 2400 digital source meter was used to measure the photo-current (Isc) and open-circuit Voltage (Voc) under an applied external potential scan for an exposed area of 0.2 cm2.
Results and discussion
In the present study it was observed that the mixing of PVP with different proportions of TiO2 and graphene resulted in viscous solutions suitable for the electrospinning process. The viscosity of the blend solutions varied from 2.6–3.2 Pa·s as the graphene content increased from 0.0—1.0 wt%.Fig. 1(a–e) shows the SEM images of the annealed electrospun TiO2 fibers with different graphene content. No charring of the fibers occurred during the sublimation of PVP (sublimation temperature ∼380 °C23,24) during annealing at 450 °C. It was also observed that addition of graphene in the given proportions (i.e. 0.0–1.0 wt%) did not have much effect on the TiO2 fiber morphology or the diameter. However, as the graphene content approached 1 wt% it tends to lose its continuous morphology as seen in Fig. 1(e). This could be mainly attributed to the difference in thermal expansion mismatch between graphene (coefficient of thermal expansion (CTE: −8.0 × 10⁻⁶/C)25 and TiO2 (CTE: 4.5 × 10⁻⁶/C))26,27 resulting in the generation of residual stress and breakage. The presence of a graphene phase was not revealed by SEM possibly due to its low phase contrast and concentration in the matrix. Since the maximum content of graphene that could be incorporated in TiO2 fibers while retaining its continuous fiber morphology during post annealing was for G-T-0.7 samples; these samples were used for further characterization.
 | ||
| Fig. 1 SEM images of annealed electrospun (a) TiO2 fibers, (b) G-T-0.2, (c) G-T-0.5, (d) G-T-0.7 and (e) G-T-1.0 | ||
Fig. 2(a) shows the TEM image of G-T-0.7 samples after annealing. The presence of graphene incorporation into TiO2 nanofibers was observed (see arrow in Fig. 2(a)). The evidence on crystallinity of the TiO2 was confirmed from the HR-TEM analysis as shown in Fig. 2(b). HR-TEM analysis showed that the lattice fringes of TiO2 exhibited an interplanar spacing of ∼0.35 nm and it corresponds to (101) plane of anatase phase. The presence of graphene phase in the G-T-0.7 was confirmed using Raman spectroscopy (Fig. 3). Raman spectrum of G-T-0.7 samples showed the presence of D and G bands of graphene indicating successful incorporation of graphene into the TiO2 matrix.
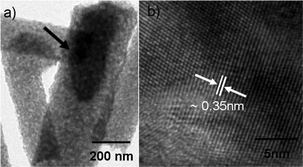 | ||
| Fig. 2 TEM images of annealed electrospun (a) G-T-0.7 samples showing the graphene embedment in TiO2 fibers (b) HR-TEM analysis of TiO2 in G-T-0.7 fibers. | ||
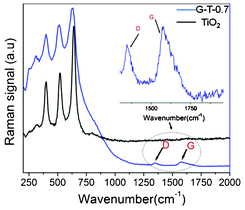 | ||
| Fig. 3 Raman spectrum of G-T-0.7 samples in comparison with electrospun TiO2 nanofibers. | ||
The XRD analysis confirmed the presence anatase TiO2 phase (Fig. 4) in the composite. XPS studies were employed to determine the elemental composition of the electrospun samples (Fig. 5). Table 1 shows the elemental atomic concentration of Ti, O and C present in G-T-0.7 and as prepared TiO2 fiber samples. Interestingly, carbon was detected in both samples indicating that trace amount of carbon was left behind during sublimation of PVP. However, it is anticipated that this carbonization effect would have been similar in both samples as they were subjected to similar annealing conditions. G-T-0.7 samples exhibited carbon content to be ∼15% higher than as compare to as-prepared TiO2 fiber samples, showing incorporation of grapheme in TiO2 matrix.
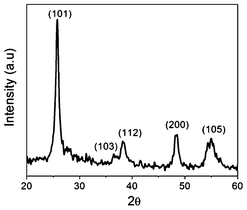 | ||
| Fig. 4 The XRD analysis of G-T-0.7 samples. | ||
 | ||
| Fig. 5 The XPS analysis of TiO2 nanofibers and G-T-0.7 samples. | ||
| Samples | C 1s | Ti 2p | O 1s |
|---|---|---|---|
| TiO2 fiber | 13.46 | 41.05 | 45.49 |
| G-T-0.7 | 28.46 | 31.70 | 39.81 |
Average diameter of the non annealed G-T-0.7 fibers was measured as ∼220 nm and exhibited a normal distribution curve from 50 to 900 nm and while annealed fibers was measured as ∼150 nm (Fig. 6a & b) It was found that ∼75% of the annealed fibers showed diameter size below 150 nm. The average surface pore size values calculated was found to be higher for the annealed G-T-0.7 samples (9 ± 4.72 μm) when compared to the non annealed G-T-0.7 samples (6 ± 3.37 μm) (Fig. 7a & b). The surface porosity measurements using an image analysis model28 from SEM images revealed values of ∼45 ± 4% and ∼48 ± 5% before and after annealing G-T-0.7 samples respectively.
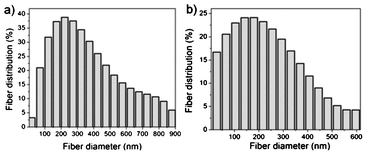 | ||
| Fig. 6 Plot of fiber diameter distribution of G-T-0.7 samples (a) before and (b) after annealing. | ||
 | ||
| Fig. 7 Plot of surface pore size distribution of G-T-0.7 samples (a) before and (b) after annealing. | ||
Fig. 8 shows the PL spectra of the as electrospun TiO2 and the G-T-0.7 excited at 350 nm. Both the samples showed similar PL pattern with strong emission band at 467 nm and 510 nm respectively. However in G-T-0.7 samples, the excitonic PL intensity was found to be lower which indicated that the recombination of photo-induced electrons and holes in TiO2 can be effectively inhibited in the composite nanofibers. The inhibition effect can be explained from the view of stepwise structure of energy levels constructed in G-T composite, as shown in Fig. 9. The conduction band of TiO2 is −4.2 eV and valence band is −7.4 eV (vs vacuum)29 while graphene is a zero band gap material.10 Such energy levels can be beneficial for photo-induced electrons to transfer from the TiO2 conduction band to the graphene, which could efficiently separate the photo-induced electrons and prevent charge recombination in the electron-transfer process, this phenomenon can be beneficial for photovoltaics. (Fig. 10a & b) shows the fluorescent microscope imaging of TiO2 and G-T-0.7 samples respectively, for a scan area of 0.5 cm2. These images confirm the blue and quenched emissions observed from the PL studies for as electrospun TiO2 and G-T-0.7 samples respectively.
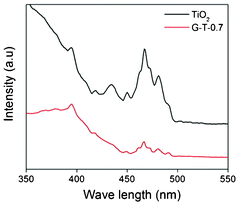 | ||
| Fig. 8 PL spectra of the as electrospun TiO2 and the G-T-0.7 excited at 350 nm. | ||
 | ||
| Fig. 9 Schematic diagram of the energy levels of TiO2 and graphene. | ||
 | ||
| Fig. 10 Fluorescent microscope imaging of a) TiO2 and b) G-T-0.7 samples for a scan area of 0.5 cm2. | ||
In the present study, SECM was used to investigate the charge transfer mechanisms across the TiO2-graphene interfaces. (Fig. 11a & b) shows the spatial mapping of the surface current in electrospun TiO2 and G-T-0.7 samples by keeping the distance between the probe and the conducting surface constant. It was seen that for a scanned area of 100 μm2, the topography established by the current peaks in G-T-0.7 samples was more pronounced than as electrospun TiO2 on a given current scale.
 | ||
| Fig. 11 Spatial mapping of the surface current in annealed a) electrospun TiO2 and b) G-T-0.7 samples. | ||
Fig. 12a shows the I–V curves characterized in SECM mode. Fig. 12a readily shows quantitatively that the graphene inclusion increased conductivity of TiO2. However it should be noted that the SECM is a localized representation (scan area: 100 μm2) of the electrical characteristics of the sample surface. Thus I–V values at numerous points were recorded on different samples (4 samples × 5 measurements) of electrospun TiO2 and G-T-0.7 and plotted as Weibull curves (Fig. 12b) to get a wider perspective of the electrical nature of these fiber mats in both cases. The specific conductance G0 measured from Weibull plots (Fig. 12b) showed higher values for the G-T-0.7 samples ((0.32 ± 0.01) × 10−6 S cm−2) compare to the electrospun TiO2 samples ((0.15 ± 0.04) × 10−6 S cm−2). It was interesting to note that the scattering in specific conductance data indicated was similar in both samples, meaning that the dispersion of graphene into the TiO2 fiber matrix was uniform.
 | ||
| Fig. 12 a) I–V curves characterized in SECM mode for different TiO2-graphene fiber composites and b) Weibull plot comparison of the specific conductance of annealed electrospun TiO2 and G-T-0.7 samples. | ||
It is hypothesized that the presence of “metallic” graphene in the TiO2 matrix can lead to vast changes in the carrier mobility when the charge carriers are in the electronic vicinity of the graphene islands. This is because of the large relativistic mobility of electrons and holes (Dirac fermions) in graphene. Graphene-TiO2 interface represents an electronic contact between a wide band gap semiconductor and narrow band gap semiconductor. Such interfaces can produce deep depletion of the charge carriers at the interface with substantial band bending. This will effectively produce a low concentration of interface carriers and effectively inhibit the possibility of back injection, thereby making charge flow unidirectional. This phenomenon can be highly desirable for photovoltaic stand point especially when graphene bridges contacts TiO2 islands.
Fig. 13 compares the photo-current density-voltage curves of the assembled DSSC employing G-T-0.7 and bare TiO2 fibers as photo-anodes. The open-circuit voltage (Voc), short-circuit photo-current density (Jsc), fill factor (FF) and efficiency (η) for the G-T-0.7 samples were found to be 0.71 V, 16.2 mA cm−2, 66% and 7.6% as compared to 0.71 V, 13.9 mA cm−2, 63% and 6.3% for bare TiO2 fibers, respectively. For both systems, the Voc was found to be similar with a significant improvement in both Jsc values for G-T-0.7 samples resulting in ∼21% increase in η values. The TiO2-graphene fiber system seems to be promising for DSSC applications, however a detailed study elucidating the role of different graphene content in TiO2 is required, which is currently being pursued by our group and is beyond the scope of the present study.
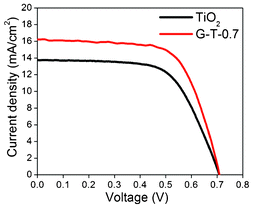 | ||
| Fig. 13 Current–voltage (I–V) characteristics of DSSC using electrospun TiO2 fibers and G-T-0.7 samples. | ||
Conclusions
The present study reports the electrospinning of conductive TiO2-graphene composites in combination with PVP as a carrier solution resulting in well-defined and structurally stable fibers. These electrospun fibers were heat treated at 450 °C to obtain a highly porous network. The presence of graphene phase in the TiO2 nanofibers was confirmed using Raman spectroscopy. The excitonic PL intensity was found to be lower in graphene-TiO2 samples indicating that the recombination of photo-induced electrons and holes in TiO2 can be effectively inhibited in the composite nanofibers. The fluorescence spectroscopy images confirmed the blue and quenched emissions observed for the electrospun TiO2 nanofibers and composite fibers respectively. The Weibull plot showed the mean specific conductance values obtained for TiO2-graphene composites to be about two times higher values than that of the electrospun TiO2 fibers. Employing these samples as photoanodes in DSSCs, a significant improvement in Jsc values was observed resulting in η = 7.6%.Acknowledgements
Department of Science and Technology (DST), Government of India is gratefully acknowledged for their financial support under the NATAG program monitored by Dr G. Sundararajan.References
- X. Hu, K. Huang, D. Fang and S. Liu, Mater. Sci. Eng., B, 2011, 176, 431–435 CrossRef CAS.
- Y. S. Park and H. K. Kim, Curr. Appl. Phys., 2011, 11, 989–994 CrossRef.
- E. Ramasamy and J. Lee, Carbon, 2010, 48, 3715–3720 CrossRef CAS.
- J. Zhang, X. Li, W. Guo, T. Hreid, J. Hou, H. Su and Z. Yuan, Electrochim. Acta, 2011, 56, 3147–3152 CrossRef CAS.
- C. T. Hsieh, B. H. Yang and J. Y. Lin, Carbon, 2011, 49, 3092–3097 CrossRef CAS.
- M. Y. Yen, M. C. Hsiao, S. H. Liao, P. I. Liu, H. M. Tsai, C. C. M. Ma, N. W. Pu and M. D. Ger, Carbon, 2011, 49, 3597–3606 CrossRef CAS.
- W. Hong, Y. Xu, G. Lu, C. Li and G. Shi, Electrochem. Commun., 2008, 10, 1555–1558 CrossRef CAS.
- L. Wan, S. Wang, X. Wang, B. Dong, Z. Xu, X. Zhang, B. Yang, S. Peng, J. Wang and C. Xu, Solid State Sci., 2011, 13, 468–475 CrossRef CAS.
- H. Zhu, J. Wei, K. Wang and D. Wu, Sol. Energy Mater. Sol. Cells, 2009, 93, 1461–1470 CrossRef CAS.
- T. H. Tsai, S. C. Chiou and S. M. Chen, Int. J. Electrochem. Sci., 2011, 6, 3333–3343 CAS.
- R. R. Nair, P. Blake, A. N. Grigorenko, K. S. Novoselov, T. J. Booth, T. Stauber, N. M. R. Peres and A. K. Geim, Science, 2008, 320, 1308 CrossRef CAS.
- M. Y. Han, B. Ozyilmaz, Y. B. Zhang and P. Kim, Phys. Rev. Lett., 2007, 98, 206805–206808 CrossRef.
- Y. Shao, J. Wang, H. Wu, J. Liu, I. A. Aksay and Y. Lin, Electroanalysis, 2010, 22, 1027–1036 CrossRef CAS.
- G. Williams, B. Seger and P. V. Kamat, ACS Nano, 2008, 2, 1487–1491 CrossRef CAS.
- J. Liu, J. Tang and J. J. Gooding, J. Mater. Chem., 2012, 22, 12435–12452 RSC.
- J. Shen, B. Yan, M. Shi, H. Ma, N. Li and M. Ye, J. Mater. Chem., 2011, 21, 3415–3421 RSC.
- J. Shen, M. Shi, B. Yan, H. Ma, N. Li and M. Ye, Nano Res., 2011, 4, 795–806 CrossRef CAS.
- V. J. Babu, A. S. Nair, P. Zhu and S. Ramakrishna, Mater. Lett., 2011, 65, 3064–3068 CrossRef CAS.
- C. Zhu, S. Guo, P. Wang, X. Li, Y. Fang, Y. Zhai and S. Dong, Chem. Commun., 2010, 46, 7148–7150 RSC.
- K. Zhou, Y. Zhu, X. Yang, X. Jiang and C. Li, New J. Chem., 2011, 35, 353–359 RSC.
- K. Sujith, A. M. Asha, P. Anjali, N. Sivakumar, K. R.V. Subramanian, S. V. Nair and A. Balakrishnan, Mater. Lett., 2012, 67, 376–378 CrossRef CAS.
- A. M. Asha, K. Sujith, P. Anjali, N. Sivakumar, K. R.V. Subramanian, S. V. Nair and A. Balakrishnan, J. Nanosci. Nanotechnol., 2012, 12, 1–6 CrossRef.
- M. Chen, H. Qu, J. Zhu, Z. Luo, A. Khasanov, A.S. Kucknoor, N. Haldolaarachchige, D. P. Young, S. Wei and Z. Guo, Polymer, 2012, 53, 4501–4511 CrossRef CAS.
- C. Lau and Y. Mi, Polymer, 2002, 43, 823–829 CrossRef CAS.
- D. Yoon, Y. W. Son and H. Cheong, Nano Lett., 2011, 11, 3227–3231 CrossRef CAS.
- D. R. Hummer, P. J. Heaney and J. E. Post, Powder Diffr., 2007, 22, 352–357 CrossRef CAS.
- S. Liu, B. Liu, K. Nakata, T. Ochiai, T. Murakami and A. Fujishima, J. Nanomater., 2012, 1–5 Search PubMed.
- A. Mikrajuddin and R. Khairurrijal, Indonesian J. Phys., 2009, 20, 37–40 Search PubMed.
- G. Zhu, L. K. Pan, T. Xu, Q. F. Zhao and Z. Sun, J. Alloys Compd., 2011, 509, 7814–7818 CrossRef CAS.
| This journal is © The Royal Society of Chemistry 2012 |