Gravitational field-flow fractionation integrated with chemiluminescence detection for a self-standing point-of-care compact device in bioanalysis†
S.
Casolari
ab,
B.
Roda
*ab,
M.
Mirasoli
ab,
M.
Zangheri
a,
D.
Patrono
c,
P.
Reschiglian
ab and
A.
Roda
ab
aDepartment of Chemistry “G. Ciamician”, University of Bologna, Via Selmi 2, 40126 Bologna, Italy. E-mail: barbara.roda@unibo.it; Fax: +39 (0)512099456; Tel: +39 (0)512099581
bNational Institute of Biostructure and Biosystems, N.I.B.B., Interuniversity Consortium, Viale Medaglie d'Oro 305, 00136 Rome, Italy
cClinical Chemistry Central Laboratory, S.Orsola-Malpighi hospital, Bologna, Italy
First published on 19th October 2012
Abstract
A “Point-Of-Care-Testing” (POCT) system relies on portable and simply operated self-standing analytical devices. To fulfill diagnostic requirements, the POCT system should provide highly sensitive simultaneous detection of several biomarkers of the pathology of interest (multiplexing) in a short assay time. One of the main unsolved issues in POCT device development is the integration of pre-analytical sample preparation procedures in the miniaturized device. In this work, an integrated POCT system based on gravitational field-flow fractionation (GrFFF) and chemiluminescence (CL) detection is presented for the on-line sample pre-analytical treatment and/or clean-up and analysis of biological fluids. As a proof of principle for the new GrFFF-CL POCT system, the automatic on-line analysis of plasma alkaline phosphatase activity, a biomarker of obstructive liver diseases and bone disorders, starting from whole blood samples was developed. The GrFFF-CL POCT system was able to give quantitative results on blood samples from control and patients with low sample volume (0.5 μL) and reagent consumption, short analysis time (10 minutes), high reproducibility and with a linear range of 50–1400 IU L−1. The system can be easily applied to on-line prepare plasma from whole blood for other clinical biomarkers and for other assay formats, based on immunoassay or DNA hybridization.
1. Introduction
The “Point-Of-Care Testing” (POCT) approach, based on the development of miniaturized and portable analytical platforms, aims at rapidly performing clinical chemistry assays directly where the sample is obtained. To meet analytical and diagnostic requirements, a POCT device should combine portability, minimum sample pre-treatment, and the possibility to perform highly sensitive simultaneous detection of several biomarkers (multiplexing) in a short assay time.Sample pre-treatment is the most critical point to reach the needed specificity and detectability in many bioassays conducted on complex biological samples (such as blood, urine, or saliva). Despite this, while great research effort has been directed toward the development of miniaturized analytical devices and biosensors for diagnostic applications, the integration of pre-analytical sample preparation and/or clean-up modules still represents the key bottleneck for realizing a totally integrated analytical device application.1
In specialized laboratories, blood clinical analyses are commonly carried out on cells and plasma components after their separation, generally through a centrifugation step that requires a volume of whole blood samples in the range of milliliters. Various miniaturized systems have been proposed to prepare cell-free plasma, possibly from small volumes of whole blood, such as microfluidic systems exploiting cross-flow filtration,2,3 “lab-on-a-disc” systems exploiting centrifugal forces4 and biomimetic microfluidic separation, microstructures, magnetophoresis, acoustophoresis and dielectrophoresis.5,6 However, such systems do not provide total recovery of plasma and in most cases the efficiency of separation is not satisfactory. In addition, most of the proposed methods present problems of clogging, lead to the rupture of blood cells owing to high shear forces and do not allow collection of cellular materials for further analysis.
In this context, the field-flow fractionation (FFF) family of flow-assisted separation techniques represents a more versatile and multiplexed solution, being able in the same run both to separate plasma from whole blood and to further fractionate cellular components by a non-invasive process and a simple and easily automatable system setup. In FFF the separation is achieved within a capillary empty channel in which a laminar flow of the mobile phase sweeps sample components down the channel. A field is applied perpendicularly to the parabolic flow to make the analytes be driven into different laminar flows due to their differences in physical properties such as molar mass/size, density, and surface properties, resulting in different retention times. Thanks to its “soft” separation mechanism, FFF has been successfully applied to a wide range of bioanalytes, from relatively small biomolecules to living cells in complex biological samples, which after separation keep their native characteristics such as enzymatic activity, cell integrity and vitality, or quaternary protein structure.7,8 The gravitational FFF (GrFFF) variant, exploiting the Earth gravitational field to structure the separation, appears to be particularly suited for its implementation in POCT devices, thanks to the simplicity of its separative device, amenability to miniaturization, and the potential easy on-line integration with specific analytical modules. GrFFF was extensively used as non-invasive cell sorting techniques9–11 and we have recently demonstrated the possibility of increasing its selectivity by derivatizing the fractionation device walls with biospecific reagents.12
Herein, we propose to exploit the potentialities of GrFFF towards the development of an on-line pre-analytical simple module of a POCT device, able to fractionate sample components, thus providing a selectively enriched fraction for the analysis with an increase of the overall analytical output. After fractionation, sample components can be on-line transferred to different analytical modules where analytes are quantified. GrFFF was coupled with chemiluminescence (CL) detection, which has been shown to be particularly suited for its implementation in miniaturized POCT devices, since it offers high detectability also in small volumes and it avoids the need for photoexcitation and wavelength selection systems.13,14 We have recently demonstrated the potential analytical applications of GrFFF coupled with CL detection for the development of rapid and ultrasensitive immunoassays.15,16
As a first approach, we present a novel GrFFF-CL integrated device able to prepare whole blood samples for the automatic on-line measurement of the activity in plasma of alkaline phosphatase (ALP, EC 3.1.3.1), an enzyme produced primarily in the liver and intestine. Measurements of ALP activity in plasma are used as a first level screening test for obstructive liver diseases and bone disorders, elevated levels usually prompting further testing to complete the diagnosis.17 Most frequently, spectrophotometric techniques are employed, exploiting the ability of the enzyme to catalyze the conversion of p-nitrophenyl phosphate (PNPP) to p-nitrophenol (405 nm maximum absorbance). Several kits (such as those produced by TC Diagnostic, Anaheim CA; AbCam Inc. Cambridge, MA; QuantiChrom, BioAssays Systems, Hayward, CA) and automatic devices (such as Cobas® by Roche Diagnostics Corporation, Indianapolis, IN) also for POCT applications (such as SpotChem EZ by A. Menarini Diagnostics, Firenze, Italy) based on colorimetric detection are commercially available for ALP activity measurement in serum. Nevertheless, such methods are limited by interferences from absorbing molecules in plasma (e.g., bilirubin, haemoglobin). Other sensitive methods, amenable to miniaturization, were described, such as CL detection,18 or electrochemical detection, although this system was not tested on human serum or plasma samples.19 However, most of these systems are not applicable to whole blood samples and they require preliminary separation of serum/plasma from whole blood. A method based on voltammetric determination was described to measure ALP activity in whole human blood, which however provided a limit of detection and a linear range not adequate for diagnostic applications.20
In the proposed GrFFF-CL integrated device, after the injection of a small volume of heparin-treated whole blood, plasma is separated from cells which elute at different retention times and is then addressed by means of a microfluidic system to the CL-analytical module, where the enzyme activity is measured by means of an on-line flow-through luminometer. To obtain a compact GrFFF device, amenable to miniaturization and easily integrated in a microfluidic system for POCT applications, the channel geometry was modified with respect to the conventional linear rectangular shape and a more compact GrFFF device containing the separative channel was used. The method has been validated by comparing the results obtained from whole blood samples with those obtained by analyzing serum by a conventional clinical chemistry test routinely used in hospital laboratories.
2. Materials and methods
2.1. Reagents
The CL substrate Lumi-Phos® Plus, containing Lumigen PPD (4-methoxy-4-(3-phosphatephenyl)spiro[1,2-dioxetane-3,2′-adamantane] disodium salt and a patented enhancer in 2-amino-2-methyl-1-propanol buffer (pH 9.6), was purchased from Lumigen Inc. (Southfield, MI, USA). Being Lumigen PPD photosensitive, it was protected from light throughout the analysis. Sodium chloride (NaCl) was acquired from Sigma Aldrich Co. (St. Louis, MO, USA) and the lyophilized calibrator for Automated Systems (C.f.a.s. 10759350), from Roche (Basel, CH, Switzerland), was kindly supplied by the Clinical Chemistry Central Laboratory of the S.Orsola-Malpighi hospital (Bologna, Italy).Saline solution (9 g L−1 NaCl in ultrapure MilliQ water) was used for samples and calibrators dilution and as a FFF mobile phase.
2.2. Samples
Fresh human blood samples were collected in heparin-treated tubes from 15 healthy donors and 10 patients affected by cholestasis. Prior to inclusion in the study, each subject gave his/her written informed consent.
For each analysis, 0.5 μL of whole blood (or plasma isolated after centrifugation for comparison purposes) were injected upon simply a 1![[thin space (1/6-em)]](https://www.rsc.org/images/entities/char_2009.gif) :100 (v/v) dilution with saline solution.
:100 (v/v) dilution with saline solution.
For each sample, ALP activity was calculated by interpolation of the CL signal on the calibration curve and corrected for the sample dilution factor. In addition, for each blood sample, the value of ALP activity in plasma was calculated by considering the dilution factor of plasma in whole blood (blood is composed of 55% plasma and 45% cellular components)21,22 in order to allow comparison of the results with those obtained in plasma with the reference method.
Results obtained by the developed method on control samples and real samples were compared with those obtained by the optimized method Cobas® routinely used in the Clinical Chemistry Central Laboratory of the S.Orsola-Malpighi hospital (Bologna, Italy). This method, based on the colorimetric measurement of ALP activity, is applied to serum samples and it provides a dynamic range of the measurement in the interval 5–2000 IU L−1, with a run-to-run CV of <0.5%, a day-to-day CV of <2% and a recovery of ±5% of the initial value.
Alkaline phosphatase values lower than 270 IU L−1 for men and lower than 240 IU L−1 for women measured at 37 °C were considered normal values for physiological conditions.
2.3. GrFFF-CL POCT system
The GrFFF-CL system was composed of two main integrated modules: the GrFFF device and the CL analyzer, which were on-line connected as described in the following paragraphs and depicted in Fig. 1.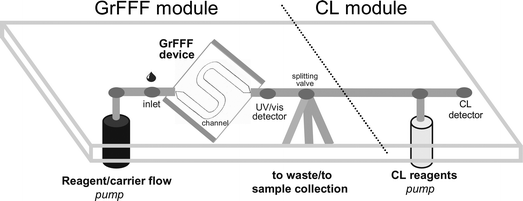 | ||
| Fig. 1 Scheme of the GrFFF-CL system. The GrFFF module is composed of a system for carrier delivery, a tube for sample injection, the GrFFF device (comprising the S-shaped channel and plastic walls), the UV/vis detector, and a splitting valve to drive selected fractions to the integrated CL module (comprising a system for reagents delivery and a CL detector). | ||
Samples and standards (injection volume 50 μL) were directly injected into the channel via a PEEK inlet tube (L = 5 cm, i.d. = 0.750 mm, o.d. = 1/16 in) by means of a Hamilton syringe. They were manually shaken for some seconds before the injection which was performed at a flow rate of 0.2 mL min−1 for 15 s. Then the flow was stopped for 2 min to allow sample relaxation. After the stop-flow time, the flow was restarted at a flow rate of 1.0 mL min−1 for sample elution. During the elution, whole blood components were fractionated: plasma was not retained and eluted in the void peak, while cellular components eluted later following the GrFFF fractionation mechanism. The elution process was registered by means of an on-line UV6000 LP, diode array UV/vis detector (ThermoQuest, Austin, TX), operating at 280 nm and 600 nm.
Alkaline phosphatase activity was measured by employing the CL substrate Lumi-Phos® Plus diluted 1:9 (v/v) with saline solution, warmed to 37 °C and delivered by the peristaltic pump (Gilson) at a flow rate of 1.8 mL min−1 for 10 s. The proportion between the sample and the substrate into the flow-through CL analyzer was fixed to 1:1.8 (v/v), as determined by flow rates of the mobile phase and the CL substrate. These experimental conditions were adopted to minimize the costs of a single run ensuring, at the same time, that the initial reaction speed depends only on enzyme activity. The CL mixture was stopped into the flow-through CL detector cell and the signal was acquired for 3 min; then, the flow was restored to wash out the sample and to make the system ready for further analysis. The value of enzyme activity was calculated from the slope of the CL kinetic curve obtained.
After injection of 10 blood samples, the entire analytical system was cleaned by flushing ultrapure MilliQ water at a flow rate of 1 mL min−1 for 30 minutes, then a cleaning solution (30% v/v ethanol and 0.5% w/v sodium dodecyl sulphate (SDS) in ultrapure MilliQ water) was flushed at 0.5 mL min−1 for 20 minutes. The system was finally rinsed with ultrapure MilliQ water at 1.5 mL min−1 for 30 minutes, before restoring the mobile phase.
3. Results and discussion
3.1. Principle of the assay/preliminary assays
In this work, an on-line GrFFF-CL system was designed and optimized for its applicability in bioanalysis in a POCT setting, by integrating a GrFFF channel in an innovative format with a fluidic CL detection module.Blood ALP activity was used as a model analyte. Preliminary work was conducted to investigate the possibility of a direct measurement of ALP activity in whole blood, by addition of the CL substrate to highly diluted (1/100 to 1/500 v/v) blood samples, exploiting high CL detectability. However, poor reproducibility and sensitivity were obtained (data not shown), thus confirming the need of a simple sample pre-treatment in order to obtain a robust method suitable for diagnostic applications.
In view of a POCT application, the GrFFF-CL system was developed by employing an original curvilinear geometry for the GrFFF channel, in order to obtain a compact device. The influence of the new geometry on the fractionation performance was preliminary evaluated on blood samples by employing CL imaging accomplished by placing the GrFFF transparent channel in a dark box and by acquiring, through a highly sensitive, back-illuminated, double Peltier-cooled CCD camera, the CL emission of fractionated analytes at fixed time intervals during the elution, as previously described.23 No significant difference in the fractionation efficiency was observed with respect to a conventional rectangular GrFFF channel, both in terms of resolution and recovery (Fig. S1†).
Employing such an original channel design, the fractionation method was optimized as described below in order to obtain a quantitative method with high sensitivity, linear range and reproducibility for the analysis of real samples. The developed procedure can be summarized as follows: a small volume (0.5 μL) of whole blood diluted 1:100 (v/v) with saline solution was injected in the GrFFF system for separation of plasma from cells, which elute at different times. At the exit of the GrFFF channel, a fraction of plasma was split to the analytical module, where ALP activity could be measured on-line upon mixing with the dioxyethane-based CL substrate. For method optimization purposes, the UV/vis detector was on-line inserted between the channel outlet and the CL analyzer, however, thanks to the high reproducibility of the fractionation process, the UV-vis detector was eliminated in the final set-up of the GrFFF-CL system.
3.2. Method optimization
A representative GrFFF profile obtained upon injecting whole blood is reported in Fig. 2a, panel I. Since, the whole volume of the void peak was much higher (1.5 mL) than the plasma volume necessary to perform the CL measurement of ALP activity, only a fraction of the void peak was split to the analytical module to reduce CL substrate consumption and measurement times. Even if it is expected that molecules eluted within the void peak are not differently distributed along the peak, since they are not affected by the external field during separation, preliminary experiments were performed aimed at confirming that the distribution of ALP was homogeneous in the void peak (thus no artefact was introduced by analyzing only a fraction of it) and at determining which fraction of the void peak would provide the highest assay sensitivity and reproducibility, with reduced reagent consumption and assay time.
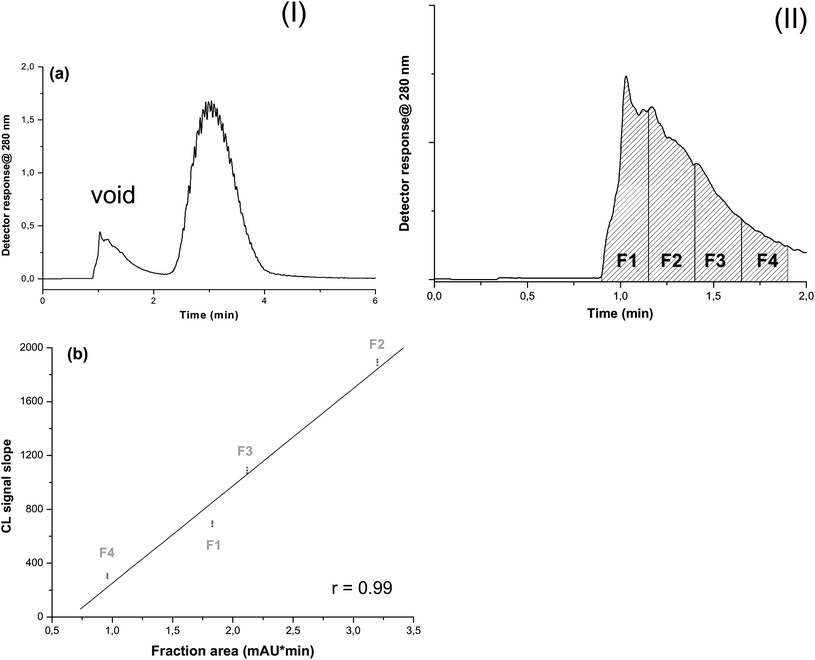 | ||
| Fig. 2 (a) GrFFF fractionation of whole blood (panel I): 50 μL of diluted (1/100 v/v in the mobile phase) whole blood, mobile phase = NaCl 9 g L−1, elution flow rate = 1 mL min−1, relaxation time = 2 min and fractographic profile registered at 280 nm. The first band represents the void peak corresponding to unretained analytes (serum components); the second band corresponds to retained blood cells. Void peak partitioned in 15 s collected fractions (panel II): F1–F4 fractions of the void (serum) peak used for the CL assay. (b) ALP activity (slope of the CL emission profile) for F1–F4 collected fractions vs. area under the curve of the fractographic profile measured at λ = 280 nm (reflecting the whole protein content in each fraction). The F2 fraction which has the higher band area also shows the higher CL intensity. | ||
For this purpose, after injecting 50 μL of diluted whole blood, four 250 μL fractions of eluting plasma (F1–F4, 15 s collection time for each fraction, Fig. 2a, panel II) were separately addressed to the CL analysis module, where the kinetics of CL emission was monitored for 3 min upon mixing for 15 s with the CL substrate, following the procedure described in Section 2.3.2. For each fraction, the area under the curve measured at λ = 280 nm (indicating whole protein content, mainly represented by human serum albumin and other plasma proteins) and the slope of the CL emission profile (indicating ALP activity) were correlated. The graph (Fig. 2b) shows a good linear relationship (r = 0.99) demonstrating a uniform distribution of ALP within the void peak and confirming that any of the fractions collected within the void peak could be used for evaluating ALP activity in the blood sample. Fraction 2 of the void peak, corresponding to the peak maximum and therefore to the highest amount of plasma components, was employed in subsequent experiments to reach higher assay detectability.
The optimal splitting time for addressing the central fraction of the void peak towards the analytical module was assessed to be 10 s, providing high assay reproducibility, as shown in Fig. 3, reporting the results of six repeated GrFFF runs and showing that void peaks of different fractograms and CL emission profile time are completely superimposable. It must be noted that a shorter 6 s splitting time provided high CL signals for ALP activity measurements as well (Fig. S2†), thus potentially low detection limits for ALP activity could also be reached when employing short sampling times. However, low reproducibility was obtained under such conditions in this work, where the instrumental set-up employed, in a prototype level of development, was based on a manual splitting operation. Future automation of the splitting system will most probably enable significant reduction of collection time, thus reagent consumption.
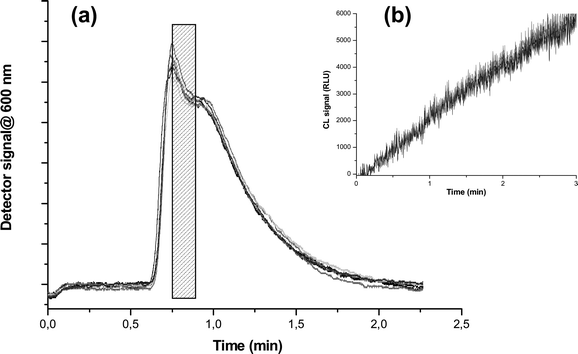 | ||
| Fig. 3 (a) Superimposition of void peaks of the fractographic profiles for six subsequent blood injections in the GrFFF system. The central portion of the void peak (evidenced in grey in panel a) corresponding to a 10 s splitting time was selected as a serum collection time for determination of ALP. (b) Results for chemiluminescence ALP activity measurements on the selected fraction for the six subsequent injections. | ||
As enzyme activity is affected by the temperature, to fulfil international standards for enzymatic measurements in clinical chemistry, the analytical CL module was thermostatted at 37 °C, obviously complicating the instrumental design in a perspective of a POCT application. Explorative tests, performed also at 25 °C, showed that, although a significantly higher signal was obtained for the blank (Fig. 4a), a linear calibration curve was obtained (Y = 86X − 15, r = 0.99), indicating the possibility of giving a conversion factor for analysis to be performed at 25 °C.
 | ||
| Fig. 4 (a) CL signals measured at 25 °C and at 37 °C when the assay was conducted in the absence of the blood sample (blank signal) by analyzing 50 μL of the mobile phase under the GrFFF-CL conditions. (b) CL blank signals measured employing a newly prepared GrFFF channel, after 10 subsequent blood analysis, and using the same channel restored by the cleaning procedure described in Section 2.3.2. | ||
Optimization experiments were performed to minimize the CL substrate consumption while maintaining an excess substrate to obtain an analytical signal only dependent on enzyme activity. Dilution factors for the Lumi-Phos® Plus substrate with saline solution ranging from 1:2 to 1:9 (v/v) were tested, the optimal one being assessed to be 1:9 (v/v) (Fig. S3†).
The memory effect between subsequent runs was also evaluated by measuring the blank signals that, while being very low and constant when a blood sample was injected into a new GrFFF channel, significantly increased after ten repeated blood injections. This memory effect, probably due to the weak adsorption of ALP molecules on the channel walls and their release during the subsequent runs, was eliminated by adopting a short channel cleaning procedure, as described in Section 2.3.2. The procedure was able to eliminate any ALP molecule adsorbed on the channel wall and the resulting memory effect (Fig. 4b). It must, however, be noted that, thanks to the low cost of the GrFFF device, the separative device is suitable for a disposable usage, thus eliminating the memory effect problem.
3.3. Quantitative analysis
:100 (v/v) dilution factor employed for injected samples. The equation Y = 54.0 (±0.2)X + 8 (±2) was obtained when repeating the calibration 15 times (r = 0.99). It is to be underlined that physiological reference values of enzymatic activity of ALP of the adult healthy subject range from 45 to 270 IU L−1, while higher values (generally up to 1400–2000 IU L−1) are encountered in pathologic situations, such as obstructive liver diseases and bone disorders. The limit of detection (LOD), calculated as the ALP activity corresponding to the signal of the blank plus three standard deviations, was 28 IU L−1. The dynamic range of the developed method is thus suitable for the analysis of blood samples presenting normal, abnormally elevated, or abnormally low ALP activity levels. Samples characterized by ALP levels lower than the LOD method may be re-analyzed upon a 1:10 (v/v) dilution, since we have excluded the presence of matrix effects at this sample dilution (Section 3.3.3).
The reproducibility of the method was assessed by analyzing quality control samples at 1.5, 4.0 and 6.0 IU L−1 ALP activity (corresponding to 270, 730, and 1090 IU L−1 in undiluted plasma, calculated as detailed in Section 2.2). Results are reported in Table 1. The intra-assay CVs across the entire range were below 2% (n = 15), while inter-assay CVs, obtained in five different days, were below 4%.
| Real value (IU L−1) | Measured value (IU L−1) | Mean (IU L−1) | Std. dev. (IU L−1) | CV% intra | CV% inter |
|---|---|---|---|---|---|
| 1.50 | 1.55 | 1.57 | 0.02 | 1.3 | 1.5 |
| 1.59 | |||||
| 1.56 | |||||
| 4.00 | 3.85 | 3.79 | 0.07 | 1.7 | 3.2 |
| 3.72 | |||||
| 3.80 | |||||
| 6.00 | 6.75 | 6.63 | 0.13 | 1.9 | 3.5 |
| 6.50 | |||||
| 6.65 |
Accuracy was determined by repeatedly analyzing control plasma samples, having a certified ALP activity value in the range (0.65–7.00) IU L−1 corresponding to final ALP concentrations in the range (120–1270) IU L−1. Results, reported in Table 2, show recovery values in the range from 110 to 93%, thus confirming the accuracy of an ALP quantification procedure. The analysis of pathological samples displaying ALP activities higher than 1400 IU L−1 can be performed by further diluting the sample prior to analysis.
| Real value (IU L−1) | Measured value (IU L−1) | Mean (IU L−1) | Std. dev. (IU L−1) | Recovery (%) |
|---|---|---|---|---|
| 0.65 final c 118 | 0.63 | 0.63 | 0.02 | 97.0 |
| 0.62 | ||||
| 0.65 | ||||
| 1.25 final c 227 | 1.20 | 1.19 | 0.03 | 95.0 |
| 1.16 | ||||
| 1.21 | ||||
| 2.50 final c 455 | 2.38 | 2.29 | 0.09 | 93.0 |
| 2.21 | ||||
| 2.29 | ||||
| 5.00 final c 910 | 4.90 | 4.96 | 0.12 | 99.0 |
| 4.89 | ||||
| 5.10 | ||||
| 7.00 final c 1272 | 7.76 | 7.73 | 0.03 | 110.0 |
| 7.70 | ||||
| 7.74 |
As stated above, automatization of the system may allow a higher control of the flow and splitting times, with a potential reduction of the sampling time and a consequent increase in the dynamic range of the method.
Fig. 5a shows a representative calibration curve obtained with the external standard procedure, in the range 3–32 IU L−1 (corresponding to 550 to 5820 IU L−1 concentrations in an undiluted plasma sample calculated as detailed in Section 2.2). A linear relationship was observed between the ALP activity and the CL signal (r = 0.99). Finally, when the ALP activity in the reference blood sample (diluted 1:10 v/v with saline solution) was calculated by interpolation on the calibration curve, a value of 60 ± 6 IU L−1 of ALP activity (calculated as activity in undiluted plasma) was obtained, which was not significantly different from the value obtained by the reference method (p > 0.01).
 | ||
| Fig. 5 (a) Calibration curve for external standard obtained by analyzing ALP standard solutions in the range 3–32 IU L−1; (b) calibration curve for standard additions obtained by analyzing aliquots of the blood sample fortified with ALP standards in the range 6–23 IU L−1. | ||
The calibration curve obtained by employing the standard addition (Fig. 5b) was produced by addition of ALP standards in the range 6–23 IU L−1 (corresponding to 1090–4180 IU L−1 in undiluted plasma) to aliquots of the reference blood sample, previously diluted 1:10 v/v with saline solution. A linear relationship was observed between the ALP activity and the analytical CL signal (r = 0.99) and a value of 58 ± 5.0 IU L−1 of ALP activity was obtained for the blood sample, which is not significantly different from the reference value (p = 0.05). In addition, no significant difference was observed between the slope of calibration curves obtained by employing the two methods (p > 0.05), thus demonstrating the absence of matrix effects.
3.4. Real samples analysis
Fresh human blood samples were drawn from healthy donors (n = 15) and patients affected by cholestasis (n = 10) in heparin-treated tubes. The samples had ALP activity in plasma values ranging from 500 to 1200 IU L−1, as determined by the reference Cobas® method. For each sample, 0.5 μL of whole blood diluted 1:100 (v/v) was analyzed in the GrFFF system in five replicate analyses. Results (calculated as plasma ALP activity) were compared with those obtained by the reference Cobas® method and a good agreement was observed. Moreover, in order to test the robustness of the method, different dilutions of blood samples and plasma obtained from the same sample were analyzed with the GrFFF-CL system. Representative results for a normal sample and a pathological sample, reported in Table 3, show that recovery values ranged between 90 and 110%, thus confirming the method accuracy.
| Sample | Real value | Determined value | Mean | Dev. Std. | Relative error | CV% intra | Recovery (%) | |
|---|---|---|---|---|---|---|---|---|
| Normal sample | Blood diluted 1/100 | (93–119) | 94.20 | 94.57 | 1.29 | −11 | 1.4 | 90 |
| 93.50 | ||||||||
| 96.00 | ||||||||
| Blood diluted 1/25 | 95.60 | 95.47 | 1.31 | −10 | 1.4 | 90 | ||
| 94.10 | ||||||||
| 96.70 | ||||||||
| Plasma diluted 1/50 | 97.20 | 96.23 | 0.91 | −9 | 0.9 | 91 | ||
| 96.10 | ||||||||
| 95.40 | ||||||||
| Plasma diluted 1/100 | 96.70 | 96.63 | 0.70 | −9 | 0.7 | 92 | ||
| 97.30 | ||||||||
| 95.90 | ||||||||
| Pathological sample | Blood diluted 1/100 | (463–593) | 537.00 | 533.00 | 4.00 | 1 | 0.8 | 100 |
| 529.00 | ||||||||
| 533.00 | ||||||||
| Plasma diluted 1/300 | 567.00 | 562.67 | 4.04 | 7 | 0.7 | 106 | ||
| 562.00 | ||||||||
| 559.00 | ||||||||
| Plasma diluted 1/200 | 590.00 | 587.33 | 2.52 | 11 | 0.4 | 110 | ||
| 585.00 | ||||||||
| 587.00 |
4. Conclusions
The results show the potentialities for the quantitative detection of specific analytes in plasma samples after their separation from cellular components employing a simple and compact GrFFF system on-line integrated with a flow-through CL analyzer.Quantitative detection of ALP activity was obtained with high analytical performances comparable to conventional diagnostic systems, with the advantages of lower sample and reagent consumption, shorter analysis time and simple instrumentation acting directly on the blood sample. The developed method was shown able to highly efficiently separate plasma from a very small volume (0.5 μL) of whole blood, in short analysis time (10 minutes) and high reproducibility (run-to-run CD <2%, day-to-day CV <4%). Such a low sample volume makes the assay compatible with a finger stick blood collection procedure, suitable for a POCT environment.
GrFFF thus represents a convenient tool to assist bioanalytical methods acting on plasma or serum, since it easily on-line isolates plasma components without the need of centrifugation steps. The same approach can be extended to any bioassay terminating with a CL reaction, including also immunoassay and gene probe assays performed in microfluidic platforms and employing CL labels. In principle, with the same injected sample, different analytes could be detected in plasma by splitting different plasma fractions to different specific analytical modules. In addition, the fractionation method used in this work allows preservation of all the native properties of analytes and cells that could be further analyzed with increased analytical information. Finally, due to the simplicity of the proposed system, many detection modules can be simultaneously connected to the GrFFF device, realizing multiplexed analysis.
In the present study, an innovative curvilinear geometry for the GrFFF channel was employed to obtain a compact device, while keeping the same fractionation performance obtained by the GrFFF device containing traditional rectangular channels. In the future, further miniaturization may be accomplished by building a microchannel on a support that also integrates microstructures for sample and mobile phase delivery. The use of an array of GrFFF channels will also be considered to increase enrichment productivity and to allow the development of multiplexed systems based on the same separative principle.
Acknowledgements
This work was supported by grants from the Italian Ministry of Instruction, University and Research (PRIN 2007AWK85F) “Development of integrated analytical instruments based on luminescence principles for multiplexed analysis in POCT (Point-Of-Care Testing) applications” and from the University of Bologna (“Fundamental Oriented Research” and “Strategic University Projects”).References
- A. J. de Mello and N. Beard, Lab Chip, 2003, 3, 11N–19N RSC.
- A. Aota, S. Takahashi, K. Mawatari, Y. Tanaka, Y. Sugii and T. Kitamori, Anal. Sci., 2011, 27, 1173–1178 CrossRef CAS.
- T. Tachi, N. Kaji, M. Tokeshi and Y. Baba, Anal. Chem., 2009, 81, 3194–3198 CrossRef CAS.
- B. S. Lee, Y. U. Lee, H.-S. Kim, T.-H. Kim, J. Park, J.-G. Lee, J. Kim, H. Kim, W. G. Lee and Y.-K. Cho, Lab Chip, 2011, 11, 70–78 RSC.
- D. R. Gossett, W. M. Weaver, A. J. Mach, S. C. Hur, H. T. K. Tse, W. Lee, H. Amini and D. Di Carlo, Anal. Bioanal. Chem., 2010, 397, 3249–3267 CrossRef CAS.
- M. Toner and D. Irimia, Annu. Rev. Biomed. Eng., 2005, 7, 77–103 CrossRef CAS.
- P. Reschiglian, A. Zattoni, B. Roda, E. Michelini and A. Roda, Trends Biotechnol., 2005, 23, 475–483 CrossRef CAS.
- B. Roda, A. Zattoni, P. Reschiglian, M. H. Moon, M. Mirasoli, E. Michelini and A. Roda, Anal. Chim. Acta, 2009, 635, 132–143 CrossRef CAS.
- X. Tong and D. Caldwell, J. Chromatogr., B: Biomed. Sci. Appl., 1995, 674, 39–47 CrossRef CAS.
- B. Roda, P. Reschiglian, A. Zattoni, P. L. Tazzari, M. Buzzi, F. Ricci and A. Bontadin, Anal. Bioanal. Chem., 2008, 392, 137–145 CrossRef CAS.
- B. Roda, P. Reschiglian, F. Alviano, G. Lanzoni, G. P. Bagnara, F. Ricci, M. Buzzi, P. L. Tazzari, P. Pagliaro, E. Michelini and A. Roda, J. Chromatogr., A, 2009, 1216, 9081–9087 CrossRef CAS.
- B. Roda, S. Casolari, P. Reschiglian, M. Mirasoli, P. Simoni and A. Roda, Anal. Bioanal. Chem., 2009, 394, 953–961 CrossRef CAS.
- A. Roda, M. Mirasoli, L. S. Dolci, A. Buragina, F. Bonvicini, P. Simoni and M. Guardigli, Anal. Chem., 2011, 83, 3178–3185 CrossRef CAS.
- B. Kuswandi, Nuriman, J. Huskens and W. Verboom, Anal. Chim. Acta, 2007, 601, 141–155 CrossRef CAS.
- M. Magliulo, B. Roda, A. Zattoni, E. Michelini, M. Luciani, R. Lelli, P. Reschiglian and A. Roda, Clin. Chem., 2006, 52, 2151–2155 CAS.
- A. Roda, M. Mirasoli, D. Melucci and P. Reschiglian, Clin. Chem., 2005, 51, 1993–1995 CAS.
- T. H. Lee, W. R. Kim and J. J. Poterucha, Clin. Liver Dis., 2012, 16, 183–198 CrossRef.
- S. Girotti, E. Ferri, S. Ghini, R. Budini, D. Patrono, L. Incorvara and A. Roda, Anal. Lett., 1994, 27, 325–335 Search PubMed.
- P. Miao, L. Ning, X. Li, Y. Shu and G. Li, Biosens. Bioelectron., 2011, 27, 178–182 CrossRef CAS.
- H.-J. Kim and J. Kwak, J. Electroanal. Chem., 2005, 577, 243–248 CrossRef CAS.
- Blood – The Human Heart, The Franklin Institute Inc., 2009 Search PubMed.
- R. Mitaishvili, The Human Blood: Composition, Typing, Lab Test Interpretation, RM Global Health (RMGH), 2010 Search PubMed.
- D. Melucci, M. Guardigli, B. Roda, A. Zattoni, P. Reschiglian and A. Roda, Talanta, 2003, 60, 303–312 CrossRef CAS.
Footnote |
| † Electronic supplementary information (ESI) available. See DOI: 10.1039/c2an36041a |
| This journal is © The Royal Society of Chemistry 2013 |