The inherent problem of transflection-mode infrared spectroscopic microscopy and the ramifications for biomedical single point and imaging applications
Paul
Bassan
ab,
Joe
Lee
b,
Ashwin
Sachdeva
a,
Juliana
Pissardini
ab,
Konrad M.
Dorling
ab,
John S.
Fletcher†
ab,
Alex
Henderson
ab and
Peter
Gardner
*ab
aManchester Institute of Biotechnology, University of Manchester, 131 Princess Street, Manchester, M1 7DN, UK. E-mail: Peter.Gardner@Manchester.ac.uk; Fax: +44 (0)161 306 5201; Tel: +44 (0)161 306 4463
bSchool of Chemical Engineering and Analytical Science, University of Manchester, Oxford Road, Manchester, M13 9PL, UK
First published on 26th October 2012
Abstract
Transflection-mode FTIR spectroscopy has become a popular method of measuring spectra from biomedical and other samples due to the relative low cost of substrates compared to transmission windows, and a higher absorbance due to a double pass through the same sample approximately doubling the effective path length. In this publication we state an optical description of samples on multilayer low-e reflective substrates. Using this model we are able to explain in detail the so-called electric-field standing wave effect and rationalise the non-linear change in absorbance with sample thickness. The ramifications of this non-linear change, for imaging and classification systems, where a model is built from tissue sectioned at a particular thickness and compared with tissue of a different thickness are discussed. We show that spectra can be distorted such that classification fails leading to inaccurate tissue segmentation which may have subsequent implications for disease diagnostics applications.
1. Introduction
The advent of infrared spectroscopic microscopy, and particularly the expansion of interest in biomedical infrared spectroscopy, has led to a growth in the use of the transflection-mode method of obtaining spectra.1–15 In this experimental geometry the sample of interest is placed on an infrared reflecting substrate. This can be any highly reflecting metal surface, of which a gold covered microscope slide is common, or a low-e microscope slide where the infrared reflective coating is predominantly tin(IV) oxide (SnO2) with a thin buried layer of silver (Ag).16 The microscope is used in reflection mode in which the input beam is focussed onto the sample and the reflected beam collected from the sample using the same Cassegrain optics. The technique is now generally termed transflection since the majority of the beam is transmitted through the sample, is reflected from the substrate surface and is transmitted through the sample again. The spectrum measured is therefore predominantly a transmission spectrum with some contribution from the beam directly reflected from the top surface of the sample.17,18 If this pure reflection component is ignored, it would be reasonable to expect that a sample of thickness z measured in transflection would be essentially equivalent to a sample of thickness of 2z measured in transmission. This simple relationship, however, between the transflection and transmission data has been difficult to evaluate since many biological samples are far from uniform and suffer from a range of optical phenomena, including resonant Mie scattering.19–28Filik et al.29 showed that transflection IR spectra from samples on reflective substrates are affected by electric-field standing waves arising due to reflection from a metallic-like surface affecting the measured absorbance spectrum. The distortion was shown to have a non-linear relationship to the IR wavelength. Their description of the absorbance spectrum with respect to sample thickness and refractive index was based upon a description given by Brooke et al.30 with an additional term to approximately compensate for the reflection from the substrate surface to better fit their model. Two papers by Davis et al.31,32 present rigorous theory of mid-infrared light propagating through a general system used for mid-infrared microspectroscopy. In these papers, it is shown that the electric-field within multilayer systems result in inhomogeneous fields due focusing and interference in both transmission and transflection methods of measurement. Simulations and experimental evidence was shown indicating that spectra measured in transflection mode are more sensitive to optical effects thus resulting in greater spectral distortion than in transmission mode.31 In the current paper, a system comprising a multilayer reflecting substrate is considered and a description of the electric-field upon exit from the sample propagating towards the collection optics is presented. As in our previous work on model metallic substrates,33–35 our model incorporates the infinite multiple internal reflectance from every layer and the resulting interference and attenuation of the beam in each layer concisely by use of a complex refractive index.
In addition to presenting an optical model, it is demonstrated how erroneous biological conclusions can be drawn from distorted transflection-mode spectra. Knowing that the IR absorbance spectrum is distorted due to sample thickness, applications such as tissue and single-cell diagnostics, where samples are often measured in transflection, it is of considerable interest to see the effects on FTIR-based tissue component classification. Classification is performed using machine learning methods such as support vector machines to learn the spectral signatures associated with classes of data – e.g. presented here we use prostate tissue which comprises of a number of cell types. If a classification model were to be trained for example using tissue sectioned with a microtome at 4 μm and then tested using tissue sectioned at 4.1 μm thickness, there would be a difference in the spectra due to the standing wave phenomenon.29 This may lead to misclassification of tissue type and perhaps misdiagnosis.
2. Materials and methods
2.1 Fourier transform infrared (FTIR) spectroscopy
Infrared spectra were measured using a Varian 670-IR spectrometer coupled with a Varian 620-IR microscope (Varian Inc. – now Agilent Technologies – Santa Clara, CA). The system was equipped with a liquid nitrogen cooled mercury–cadmium–telluride (MCT) detector. Transmission and transflection FTIR measurements were performed in single point mode using an aperture size of 250 × 250 μm2, the spectral resolution chosen was 4 cm−1, and spectra were truncated to retain the wavenumber range of 1000 cm−1 to 4000 cm−1. Interferograms were processed using one level of zero filling giving the spectra a data spacing of 2 cm−1. Apodisation was performed using a Blackman–Harris apodisation function. The background was collected using 256 co-added scans, and the sample spectrum collected at 128 co-added scans.FTIR images were collected using a 128 × 128 focal plane array. The background and sample were measure at 32 and 4 co-added scans respectively, at a spectral resolution of 7.7 cm−1.
2.2 Preparation of cytosine thin film samples
Thin films of cytosine were prepared using an in-house built vapour depositor, specifically adapted for the evaporation of organic and biological samples. This turbo pumped vacuum system (base pressure 6 × 10⁻⁵ mbar) consists of a small cylindrical vacuum chamber based on a 100 mm stainless steel tube with flanged ports on two levels. On the lower level there is a ceramic crucible, in an electrically heated tungsten basket, which is filled with the substance to be evaporated, in this instance cytosine (99% purity) in powdered form (Sigma-Aldrich). On the upper level is the substrate holder, adapted to take either low-e microscope slides (Kevley Technologies, Chesterland OH), or CaF2 slides (Crystran Ltd, Pool UK), in a face down orientation. In addition, situated directly next to the substrate holder, there is a quartz crystal microbalance, QCM (STM-100/MF Sycon Instruments, New York, USA) used to measure the thickness of the deposited film. The QCM, calibrated for the density of the sample being deposited, enables the deposition rate to be obtained and samples of the desired thickness to be prepared.2.3 Prostate tissue section preparation
Paraffin-embedded blocks of prostate tissue samples of patients with benign prostatic hyperplasia (BPH) and prostate cancer (CaP) were obtained following informed consent and ethical approval (Trent Multi-centre Research Ethics Committee 01/4/061). Tissue from several patients were sectioned at a thickness of 4 μm onto low-e MirrIR (Kevley Technologies, Ohio, USA) and calcium fluoride (CaF2) (Crystan Ltd., Poole, UK) slides.Sections prepared on the MirrIR substrate were chemically treated to remove paraffin by washing the slides with Citroclear and cold acetone (4 °C), as per a previously published protocol36 and left to dry overnight. Samples prepared on CaF2 were not chemically treated and remained embedded in paraffin.
2.4 Computational methods
All computations were performed in MATLAB 2012a (The MathWorks Inc., Natick, MA, USA) and MathCad 15 (Parametric Technology Corporation, Needham, MA, USA) running programmes written in-house.3. Theory
In this section we introduce the theory of reflection at interfaces as defined by the Fresnel equations37 and reflection properties of multilayer systems.383.1 Reflection at surfaces and the Fresnel formulae
The Fresnel formulae define the reflection coefficient at interface 1 to 2, r12, as the ratio of the reflected electric-field (Eref) magnitude divided by the incident electric-field (Einc) magnitude as illustrated in Fig. 1. This reflection coefficient is a complex value if the media are absorbing. | (1) |
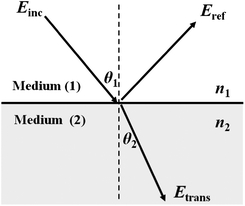 | ||
| Fig. 1 Light incident and propagating through the interface of medium (1) to medium (2), Einc, Eref, Etrans, denote the incident, reflected and transmitted electric-field respectively. n1 and n2 are the refractive indices of the two media. | ||
The transmission coefficient (Etrans/Einc) can be described as t12 = 1 − r12 for s polarisation and (1 − r12) cos θ1/cos θ1 for p polarisation. The reflection coefficient depends on the polarisation of the electric-field, thus rs and rp are defined as the reflection coefficients for s and p polarisation respectively using the following sign convention. For s polarisation, positive Einc and Eref both point down; for p polarisation, positive Einc and Eref both point to left of propagation direction.
 | (2) |
 | (3) |
| ξ1 = n1cos θ1 = (n12 − n12sin2θ1)½ | (4) |
| ξ2 = n2cos θ2 = (n22 − n12sin2θ1)½ | (5) |
| ε = n2 = (η − ik)2 | (6) |
| R = |r|2 | (7) |
The reflectivity of natural light Rnatural is simply the arithmetic mean of Rs and Rp which are the reflectivity of s and p polarisations respectively.
 | (8) |
The computation of reflection coefficients from adjacent layers is elementary in the understanding of interference effects from multilayer systems such as a sample mounted on a low-e substrate. Light passing from one medium into another is affected by the difference in refractive indices and undergoes phase changes as well as attenuation, both of which are a function of distance (assuming a fixed time e.g. t = 0). The following section deals with the reflection of light from a three layer system.
3.2 Phase change for single internal reflection
Fig. 2 illustrates two light paths, the first traversing the point (ach), and the second (begch). At point (c), these paths coincide and interfere constructively or destructively depending on their phase difference. At this stage, the transmission of light into third medium (substrate) is neglected.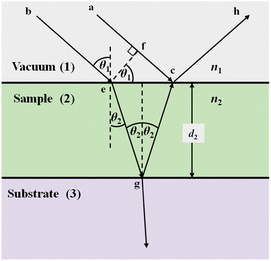 | ||
| Fig. 2 Illustration showing the phase change of two rays incident on a three-layer system. | ||
The phase change is proportional to the optical path length difference which is equivalent to distance: (begc) − (ac), or (egc) − (fc). The resulting phase difference (including full path length experienced) from the double pass through layer 2, 2β2, is given by:
 | (9) |
Because n1λ1 = n2λ2 = λ0 (λ is the wavelength of light and λ0 is the vacuum value) and n1sin θ1 = n2sin θ2 (Snell's law), eqn (9) can be rewritten as
 | (10) |
 | (11) |
 | (12) |
The value of β2 will be complex if any of the layers are absorbing since a complex refractive index is involved, angles will also be complex valued.
3.3 Three-layer system reflection coefficient
The reflection coefficient, r123, in Fig. 2 which is the composite of rays (a) and (b) can be described as| r123 = r12 + t12r23t21exp(−2iβ2) | (13) |
The signal measured during a transflection experiment, involving only three layers (vacuum, sample and substrate) can be described at each wavelength by the reflection coefficient of the surface of the sample. The signal incident upon the sample surface will be partially reflected and partially transmitted. The transmitted signal is reflected from the substrate surface and is attenuated along its path until it arrives at the sample–vacuum interface where it is transmitted, i.e. the path traversed is (begch). There are many internal reflections which undergo attenuation rapidly. Fig. 3 shows light incident upon a three layer system where four (of an infinite number of) fields entering the system are shown. The various contributions to the reflection coefficient r123 are as follows.
| r123(a) = r12 | (14) |
| r123(b) = t12r23t21exp(−2iβ2) | (15) |
| r123(c) = t12r23r21r23t21exp(−4iβ2) | (16) |
| r123(d) = t12r23r21r23r21r23r21r23t21exp(−6iβ2), | (17) |
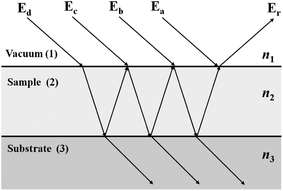 | ||
| Fig. 3 The interference caused by multiple internal reflections from layer 2 in a 3 layer system. | ||
The composite r123, is then
 | (18) |
 | (19) |
Because t12t21 = (1 − r12)2 for both s and p polarisation, and r21 = −r12, eqn (19) can be written:
 | (20) |
The signal Eref that is collected by the optics is a combination of pure reflection from the surface, and the internal multiple reflectance. We can naively consider a transflection experiment at this stage to be comprised of a three-layer system, vacuum, sample, and a highly reflective substrate. Eqn (20) is true for s and p polarisations and allows the calculation of the reflection coefficient from the surface of a multilayer layer system such as that of a low-e substrate. The next section discusses the reflection characteristics for a hypothetical low-e slide.
3.4 Multilayer system reflection coefficient
Fig. 4 shows the schematic of a hypothetical generic low-e substrate comprising of the following layers: tin(IV) oxide, silver, tin(IV) oxide and amorphous silicon dioxide representing glass. The thicknesses have been assumed under the criteria that the substrate must highly transmit visible light which limits the thickness of the tin(IV) oxide and silver layers, yet is highly reflective to mid-IR light.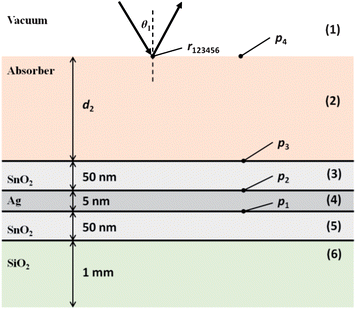 | ||
| Fig. 4 Schematic for a hypothetical low-e substrate. | ||
To calculate the reflection coefficient, r123456, encompassing all possible internal reflections, and absorption from the layers, several computations must be done. For a three layer system, eqn (20) is used to calculate the reflection coefficient, r456, at point p1, for the bottom three layers (4, 5, 6). The complex refractive index for each layer has been used to incorporate phase change and absorption from source.34
The next stage of the calculation is to calculate the reflection coefficient, r3456, at point p2. Eqn (20) is used again, but the effective reflection coefficient of boundary (4, 5) can be replaced by r456 which incorporates the phase change and absorption from the lower layers. This method is repeated sequentially to point p4 at which point the reflection coefficient r123456 is calculated. The reflectivity of the sample surface, Rsample can be computed using eqn (7).
The reflection coefficient, r13456 of the substrate (i.e. the above system without the layer of the absorber) can be computed using the same method but without the absorber layer. The reflectivity of the substrate, Rbackground can be computed again using eqn (7). The reflection ratio, Rratio, and decadic absorbance, A, spectrum is calculated by:
 | (21) |
 | (22) |
The reflectivity is a function of incidence angle, θ, and here we consider a range of angles 35° to 45° which is representative of a typical 15× FTIR Cassegrain objective. The reflectivity ratio is simply the mean of the reflectivity ratio at each individual value for θ.
The optical properties of the Ag and SiO2 layers were taken from the compilation by Palik;39 in the absence of more detailed information in the mid-IR, the refractive index for SnO2 was assumed to be a constant value of 2 (a non-absorber).
4. Results and discussion
4.1 Measured cytosine spectra
To demonstrate the problem with transflection-mode infrared spectroscopy, we have produced a number of thin films of cytosine (C5H5N3O) on both a CaF2 transmission window and a low-e reflective slide. Fig. 5 shows the IR spectra of pure cytosine on low-e substrates at varying thicknesses, as prepared using a vapour deposition method.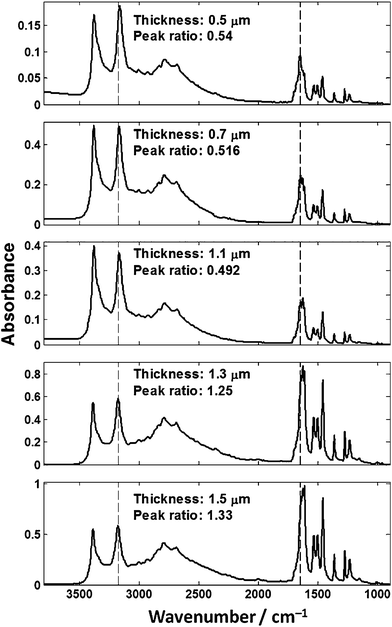 | ||
| Fig. 5 Spectra of cytosine films of varying thickness collected in transflection-mode on low-e slides. The peak ratio was calculated from the 1655/3175 cm−1 bands. | ||
Fig. 5 shows that IR spectra from chemically homogenous thin films of cytosine of different thickness give spectra that are not identical. Due to the different thicknesses, one would expect that the absorbance spectrum would scale approximately linearly as per the Beer–Lambert law. The observed absorption profile does not follow the Beer–Lambert law across the spectrum as evidenced by the non-linear change across the spectrum. The general trend is that as the film thickness increases, more IR radiation is absorbed but not in the expected linear fashion across the spectrum. The ratio was calculated of the absorbance values at 3300 cm−1 and 1655 cm−1 from the N–H stretch and Amide I bands respectively. The peak ratios of the N–H stretch and Amide I band should be constant, but are different beyond error resulting from experimental noise or background distortions. To ensure that the observed spectral distortion was due to the low-e substrate, two films were prepared on calcium fluoride for comparison as shown in Fig. 6.
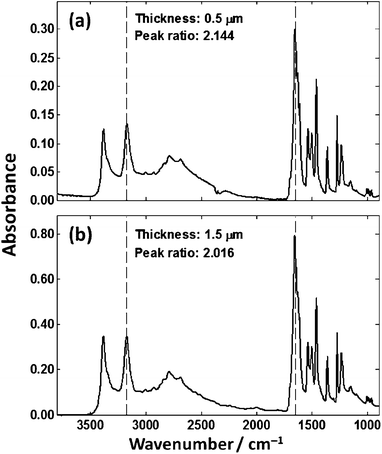 | ||
| Fig. 6 Spectra of cytosine films of (a) 0.5 μm and (b) 1.5 μm collected in transmission mode on a CaF2 substrate. | ||
Fig. 6. shows transmission spectra of cytosine films of 0.5 μm and 1.5 μm thickness. The ratios of the N–H stretch and Amide I for both spectra are much more consistent when compared to the low-e spectra. The origin, mathematical description and consequences of this optical phenomenon is the subject of this paper.
4.2 A hypothetical absorber
To understand the effects of the thickness of a sample on a low-e substrate on the absorbance spectrum, a hypothetical absorber was constructed from equally space Lorentzian line shapes of equal magnitude. The absorption coefficient, α, spectrum is shown in Fig. 7(a), the corresponding imaginary refractive index, κ, Fig. 7(c) and, using the Kramers–Kronig40,41 relationship, the real refractive index, η, Fig. 7(b).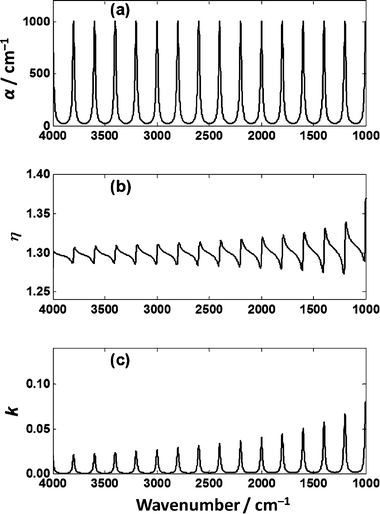 | ||
| Fig. 7 (a) Absorption coefficient, α, for a hypothetical absorber comprised of Lorentzian line shapes. (b) The real part, η, and (c) imaginary part, κ of the index of refraction of the hypothetical absorber. | ||
Using the optical properties of the hypothetical absorber shown in Fig. 7, the absorbance spectrum was computed for varying absorber thickness on the low-e substrate shown in Fig. 4. Fig. 8 shows the resulting theoretical absorbance spectra.
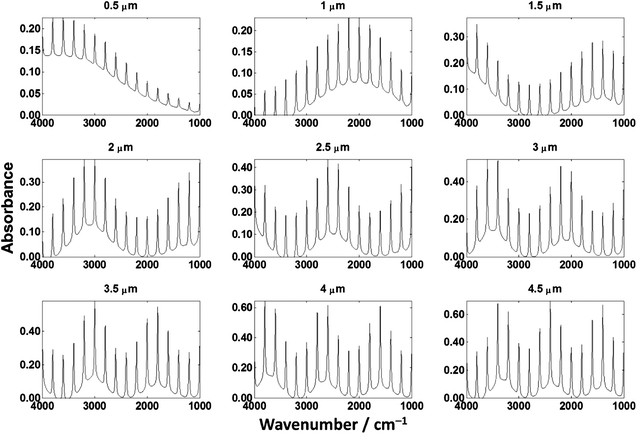 | ||
| Fig. 8 Transflection absorbance spectra for the hypothetical absorber of varying thickness on a low-e substrate. | ||
Fig. 8 demonstrates that the absorbance of the hypothetical absorber does not follow the Beer–Lambert law. The absorber was engineered such that the peaks in the absorbance spectrum should be identical and should appear as a scaled version of the absorption coefficient, α. The film of 0.5 μm thickness shows that the peaks near 1000 cm−1 are considerably smaller in magnitude than those near 4000 cm−1. The film of 1 μm shows that the peaks located near 2000 cm−1 are larger than those located at 1000 and 4000 cm−1 which is inconsistent with both the absorption coefficient spectrum and the 0.5 μm thin film spectrum. In addition to the inconsistent peak magnitude it is apparent that the spectra appear to exhibit an oscillating baseline. To gain further insight into this baseline, the computation was repeated with the absorber's absorption coefficient set to zero (i.e. non-absorbing) and a constant real refractive index, η, of 1.4.
Fig. 9 shows the calculated absorbance spectra for a non-absorbing sample of varying thickness, which contains features at ca. 3200 and ca. 1000–1300 cm−1 due to the SiO2 layer. Each spectrum should be a flat line of zero absorbance but this is not the case. The absorbance is above and below zero in many of the spectra meaning that the reflectivity can increase and decrease due to just the effects of inference in the multilayered system in the substrate. Biological samples typically do not absorb in the ca. 1800–2500 cm−1 region and non-zero absorbance is attributed to scattering. This result shows that what was previously considered as predominantly scatter also contains contributions from the electric-field standing wave effect.
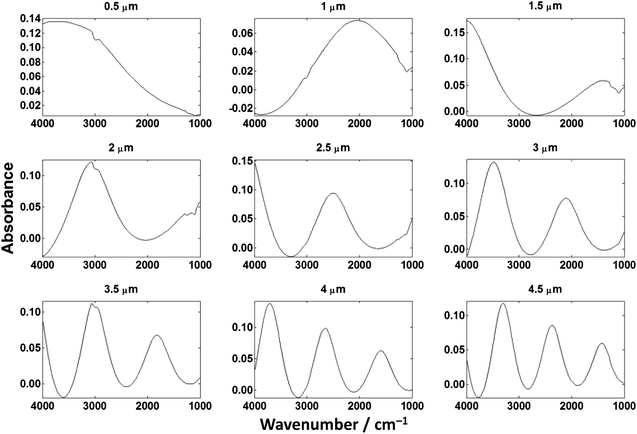 | ||
| Fig. 9 The absorbance spectra for a non-absorbing sample of different thicknesses. | ||
4.3 Theoretical absorbance of cytosine thin films on low-e slides
The transmission spectrum of the 1.5 μm film of cytosine was divided by its thickness to obtain its absorption coefficient, Fig. 10(a). The imaginary and real index of refraction were then computed as shown in Fig. 10(b) and (c) respectively. The real part of the refractive index was given an assumed average refractive index of 1.3.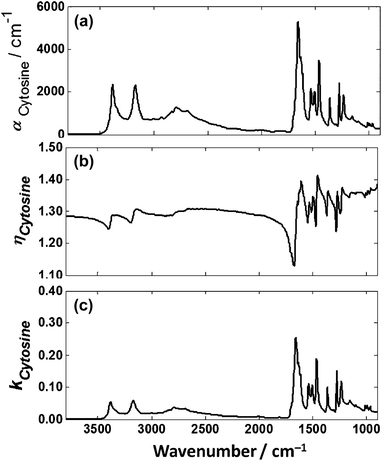 | ||
| Fig. 10 Calculated (a) absorption coefficient, (b) real refractive index and (c) imaginary refractive index for cytosine. | ||
Using the optical properties of cytosine shown in Fig. 10, the absorbance spectra were theoretically computed for the same thickness as were experimentally measured (Fig. 5). The resulting absorbance spectra are shown in Fig. 11 and several interesting observation can be made. The agreement for the 0.5 μm films is excellent. Both the experimental and theoretical spectra show a trend of the changing N–H stretch to Amide I ratio where for thin films the N–H stretch is larger, and then becomes considerably smaller for the larger thicknesses (Fig. 11).
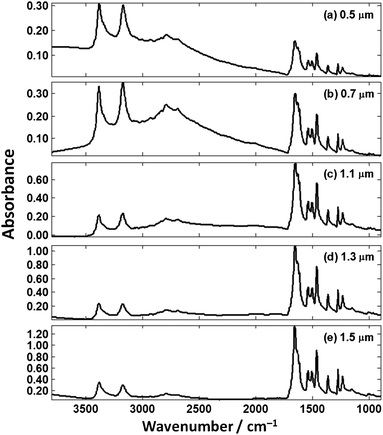 | ||
| Fig. 11 Theoretical cytosine spectra on our hypothetical absorber of the same thickness as measured (Fig. 5). | ||
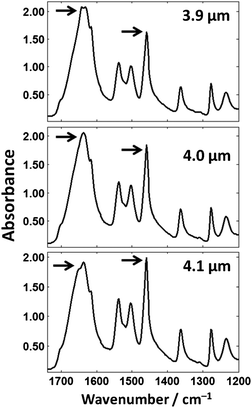
The fingerprint region of the spectrum (ca. 900–1780 cm−1) appears to be constant at first glance but an expanded view of this region shows this is not the case. Fig. 12 shows theoretical spectra of the fingerprint region of cytosine thin films at thicknesses of 3.9, 4.0, and 4.1 μm (thicknesses chosen that represent the differences that could occur in tissue/single-cell samples). The Amide I band shows significant changes throughout the spectra with subtle features that produce the peak maximum of the spectra changing. If biochemical conclusions were drawn based upon the Amide I peak position, different conclusions would be drawn for each thickness which is incorrect as they are all the same chemical.
The highlighted bands in Fig. 12 show a dramatic change in ratio; the Amide I band is larger in magnitude than the ring breathing/ring N–H bending mode at 1458 cm−1 at a film thickness of 3.9 μm but is smaller at a film thickness 4.1 μm. The thickness difference in this example is 0.2 μm and is comparable to the size difference of single-cells and tissue (e.g. lumen in prostate tissue, etc.).
4.4 Interpretation of the measured cytosine spectra
Fig. 13 shows an expanded view of the measured cytosine spectra in the region of 1500–1700 cm−1 from Fig. 5 and 6 where the majority of the spectral features are analogous to molecular vibrations in proteins. Fig. 13(a) shows the expanded view of the two thin films measured in transmission, and (c) shows the thin films measured in transflection. Fig. 13(b) and (d) show the second derivative spectra of (a) and (c) respectively which were computed using the Savitzky–Golay42 method using a window of 9 data points.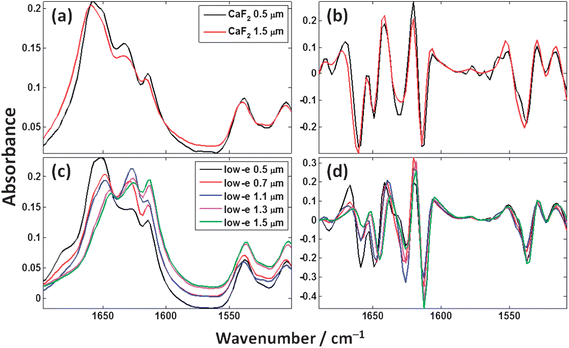 | ||
| Fig. 13 Cytosine spectra expanded in the 1500–1700 cm−1 spectral range for the experimentally measured (a) transmission and (c) transflection thin films; (b) and (d) show the second derivative spectra for (a) and (c) respectively. | ||
Fig. 13(a) shows that the transmission spectra for the 0.5 μm and 1.5 μm cytosine thin films are similar with the relative heights of peaks being approximately equal. Fig. 13(c) shows that the transflection spectra for the 5 different thickness cytosine films are considerably different. The peak maximum of the Amide I band (ca. 1580–1700 cm−1) is different beyond any effects of digitisation (due to finite spectral resolution). The 0.5 and 0.7 μm films have an Amide I peak maximum at ca. 1651 cm−1, the 1.1 and 1.3 μm films peak at ca. 1628 cm−1, and the 1.5 μm film peaks at 1613 cm−1.
A common pre-processing step in the analysis of vibrational spectroscopic data is the use of derivatives as they reduce the effects of low frequency baselines and “enhance” the chemical information from absorption bands which are relatively higher in frequency. This method is prevalent throughout the literature in studies involving both single biological cells and tissue. Fig. 13(b) and (d) show the second derivative spectra of the Fig. 13(a) and (c). The transmission second derivative spectra again look considerably more consistent with one another than the transflection second derivative spectra. To gain insight into the similarity between the spectra, principal components analysis (PCA) was employed as an explorative tool. The measured spectra comprised 69 spectra, 10 spectra each from the two CaF2 thin film thicknesses, and 10 spectra from each of the MirrIR thin film thickness except the 0.7 μm group which contained 9 spectra. The second derivatives were calculated and the spectra truncated to 1500–1700 cm−1 spectral range as per Fig. 13. The spectra were then individually mean centered (i.e. subtracting the mean of each spectrum away from itself) followed by a vector normalisation thus making the vector length of each spectrum a magnitude of 1. The resulting scores plot is shown in Fig. 14.
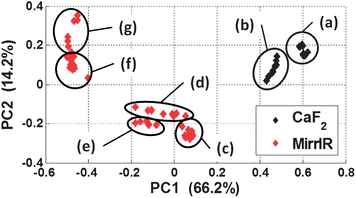 | ||
| Fig. 14 Principal components analysis (PCA) scores plot comparing the second derivative spectra of the 1500–1700 cm−1 spectral region of the cytosine thin films. The transmission spectra are: (a) 0.5 μm, (b) 1.5 μm; the transflection spectra are (c) 0.5 μm, (d) 0.7 μm, (e) 1.1 μm, (f) 1.3 μm and (g) 1.5 μm. | ||
Fig. 14 shows the that the two transmission thin film thicknesses (a) and (b) are located close together relative to the other groups of data. The transflection data forms sub-clusters, Fig. 14(c–g), for similar thicknesses. It might be expected that the in Fig. 14 clusters (a) and (b) should form one cluster, however two distinct clusters have formed which could be attributed to the phenomena reported by Davis et al.,31,32 the electric-field is inhomogeneous in magnitude when propagating through the sample and substrate which result in non-linear changes to the absorbance spectrum. Transmission spectra computed for the same chemical of different thickness were shown to deviate from the expected spectrum.
4.5 FTIR imaging of prostate tissue and classification
Fig. 15(a) shows a micrograph of a piece of prostate tissue stained with haematoxylin and eosin (H&E), the size of the shown piece of tissue is approximately ca. 4224 × 4224 μm2. The serial section of this tissue was sectioned at a thickness of 4 μm onto a CaF2 substrate. The tissue was spectroscopically imaged by creating a “mosaic” comprising of 6 × 6 individual FTIR image giving a total of 589![[thin space (1/6-em)]](https://www.rsc.org/images/entities/char_2009.gif) 824 spectra. The data was corrected for non-resonant Mie scattering as the scattering was minimal due to the near refractive index matching of the paraffin surrounding the tissue. The spectra were truncated to the fingerprint region after which the region of 1342–1520 cm−1 corresponding to the strong paraffin bands were also truncated. The first derivative of the spectra were then computed using the Savitzky–Golay42 method with a window of 5 points. The spectra were then individually mean centred and vector normalised using the same method stated in Section 4.4. The image was then subjected to a k-means clustering algorithm to segment the spectra into 5 classes. Fig. 15(b) shows a false colour image representing the results of the clustering which correspond well to the tissue histology.
824 spectra. The data was corrected for non-resonant Mie scattering as the scattering was minimal due to the near refractive index matching of the paraffin surrounding the tissue. The spectra were truncated to the fingerprint region after which the region of 1342–1520 cm−1 corresponding to the strong paraffin bands were also truncated. The first derivative of the spectra were then computed using the Savitzky–Golay42 method with a window of 5 points. The spectra were then individually mean centred and vector normalised using the same method stated in Section 4.4. The image was then subjected to a k-means clustering algorithm to segment the spectra into 5 classes. Fig. 15(b) shows a false colour image representing the results of the clustering which correspond well to the tissue histology.
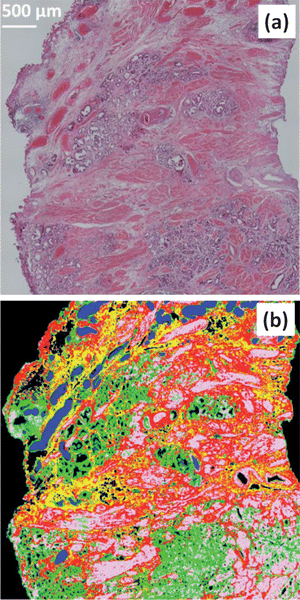 | ||
| Fig. 15 (a) Visible micrograph of a prostate tissue section stained with haematoxylin and eosin (H&E). (b) False colour image based upon FTIR spectroscopic image of a serial section of the same prostate tissue sample. Colour code as follows: blue = blood, green = epithelium, pink = smooth muscle, red = fibrous muscle, yellow = mixed stroma. | ||
Using the results from the clustering in Fig. 15(b), the raw spectra (i.e. no pre-processing) were extracted and placed into a database labelled with the histological classes: blood (blue), epithelium (green), smooth muscle (pink), fibrous muscle (red) and mixed stroma (yellow). Similar tissue classification has been reported previously by Fernandez et al.43
The database of raw spectra were initially corrected for non-resonant Mie scattering to remove any slight baselines. Assuming a thickness of 4 μm, the real and imaginary part of the refractive index for each spectrum was calculated. This allowed the simulation of the absorbance spectra as if they were measured on a low-e substrate at a sample thickness of exactly 4 μm. These data were placed in a new database hereafter called the “model database”.
The spectra in the model database were truncated to retain the fingerprint region, and then further truncated to remove peaks paraffin peaks (ca. 1342–1520 cm−1). The spectra were then individually mean centered and normalised as previously. A random 150 spectra were taken from each class and used to train a linear kernel support vector machine (SVM) classifier, using the LIBSVM44 library by Chang et. al. This procedure was repeated a further 4 times using a different random 150 spectra each time totalling 5 independent SVM classifiers allowing a voting style classifier to be constructed.
The model database (which contains the real and imaginary refractive index for each spectrum) was then taken and the absorbance spectrum simulated as if it were a thickness of 3.6 μm on a transflection substrate. The resulting spectra underwent the same pre-processing steps as per the spectra used to build the SVM classifier. After pre-processing, the spectra were subjected to the classifier which outputs the histological class for each spectrum. A false colour system similar to that of tissue stained by H&E was employed: blood = red, epithelium = purple, smooth muscle = dark pink, fibrous muscle = salmon pink and mixed stroma = yellow. The false colour image from this procedure is shown in Fig. 16, top left. This procedure was repeated to simulate the effect of the tissue being 3.6 μm to 4.4 μm in step sizes of 0.1 μm, the results are shown in Fig. 16.
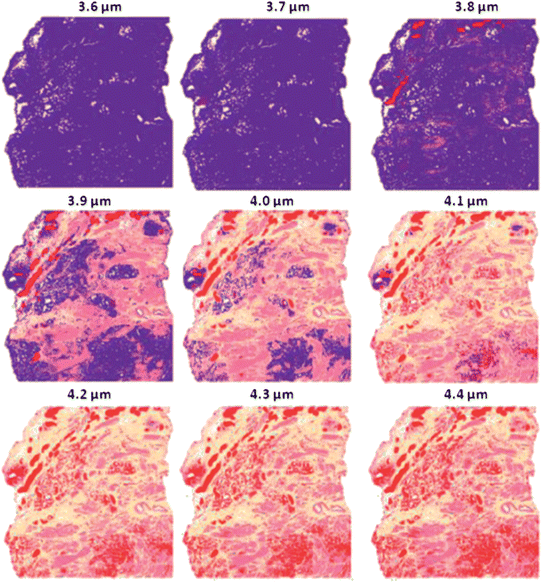 | ||
| Fig. 16 False colour classification images of the 5 class histological model for prostate tissue. Classifier trained on a database of transflection simulated spectra of 4 μm thickness. | ||
Fig. 16 shows that the transflection data of 4 μm thickness classify with excellent agreement to the H&E image shown in Fig. 15(a). The classification accuracy drops as the thickness deviates from 4 μm even as little as 0.1 μm. At 3.6 μm the image is completely distorted and unreliable.
To investigate the benefits of derivatives, the procedure above was repeated with the addition to the pre-processing step of a first derivative after non-resonant Mie scattering. The results show that again at 4 μm the classification is most accurate as this is the thickness the classifier was trained at, however the accuracy does decrease at other thicknesses as Fig. 17 shows. The distortion appears to be less extreme than the previous experiment in which no derivatives were taken.
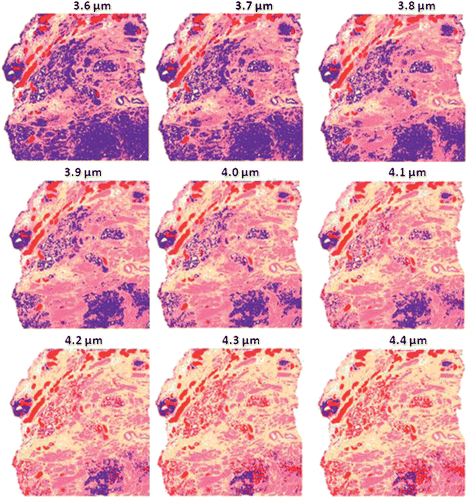 | ||
| Fig. 17 False colour classification images of the 5 class histological model for prostate tissue. Classifier trained on a database of transflection simulated spectra of 4 μm thickness using a first derivative. | ||
Fig. 18 shows the same experiment again except using a second derivative instead of a first derivative. The results show that the classification accuracy appears to be less affected than both the first derivative and no derivative experiments. Closer inspection of the 4.4 μm tissues shows that there is considerably more mixed stroma in the image than the “correct” answer as shown at 4 μm.
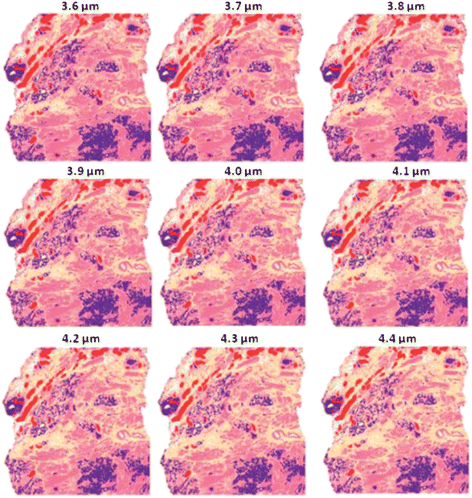 | ||
| Fig. 18 False colour classification images of the 5 class histological model for prostate tissue. Classifier trained on a database of transflection simulated spectra of 4 μm thickness using a second derivative. | ||
4.6 FTIR spectroscopic imaging data from prostate tissue on a low-e substrate
The accuracy of classification was shown to be affected by sample thickness in transflection-mode. Arguments stating that preparing tissue at a consistent thickness using a microtome negates the transflection thickness problem are not valid. Fig. 19(c) and (d) show spectra from a region of prostate tissue on a low-e MirrIR substrate that is far from the edge of tissue, and in an area of seemingly “flat” tissue. The spectra are clearly affected by resonant Mie scattering which shows that the tissue does not have a perfectly “flat” surface but has a topography of similar magnitude to the indecent wavelength. Scattering is dependent on both particle size and refractive index, but the spatial variations of refractive index on a scale comparable to the wavelength are unlikely to be large enough to cause scattering of this extent. Thus the argument of obtaining flat tissue from a carefully controlled microtome method is simply not valid. Knowing that the sample thickness is not a constant, the transflection absorbance spectrum will inevitably be distorted.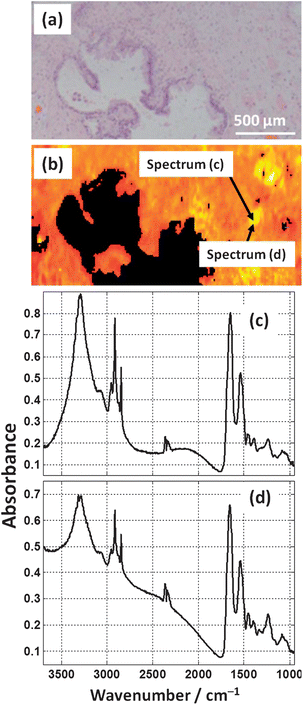 | ||
| Fig. 19 (a) H&E micrograph from a prostate tissue section. (b) False colour heat-map of the Amide I intensity of FTIR image of the serial section of tissue (a). (c) and (d) show two raw spectra (no pre-processing) that are located approximately 20 μm from each other. | ||
The ratio of the N–H stretch and Amide I band in Fig. 19(c) and (d) are hugely different. Compensating for the baseline, the N–H stretch in (c) is larger in magnitude than the Amide I band, whereas in (d) the N–H stretch is approximately a third of the magnitude. These spectra are a distance of ca. 20 μm apart from each other in an area which does not contain any edges, and appears to be mixed stroma. The difference in these ratios is not due to the chemistry but due to the variation of thickness.
In Section 4.5 it was shown that without the use of derivatives the histological classification was inaccurate when the thickness was only 0.1 μm different from the thickness of the tissue that was used to build the classification model. The difference between histological classes, e.g. blood and epithelium cells is likely to be larger than the differences between for example benign and cancerous epithelium. The second derivative procedure gives more accurate results than the no derivative and first derivative but still was affected by the transflection thickness issue. In the case of subtle changes due to disease state, the second derivative method may not necessarily perform as well as in the case of histological classing which exhibit large spectral differences.
5. Conclusion
The results from Filik et al.29 and this study show that infrared spectra measured in transflection-mode are distorted non-linearly as a function of wavenumber with respect to sample thickness. We have shown experimentally and theoretically that the measured absorbance spectrum of a chemically homogenous thin film is severely distorted in transflection-mode compared to transmission mode. We have also shown that a non-absorbing sample can give rise to oscillations in the spectral baseline similar in profile to that of Mie scattering.Qualitative applications such as investigating the presence of a molecular vibration could be obtained with low-e substrates with relatively little danger, however quantitative information such as peak heights and ratios, etc. are unreliable. Biomedical applications such as drug screening or disease diagnostics from tissue samples, involve the use of quantitative information from spectra and could be affected severely. Data from transflection-mode FTIR should be treated with extreme caution to ensure that biochemical differences observed are not from sample thickness differences which will be difficult without repeating the experiment in transmission mode.
A single tissue section on a sample exhibits thickness differences as shown by the presence of scattering in regions of “flat” tissue, and this combined with uncertainty in microtome accuracy leads to an inevitable unknown spectral distortion when using transflection-mode FTIR using low-e slides. The same is true for single-cells measured in transflection-mode FTIR. Although using a first or second derivative goes some way to negate the problem it is clear that the method should still be used with caution. The phenomena presented are of course not limited to biological samples, but will impact all transflection-mode experiments.
Acknowledgements
We would like to thank Dr Jonathan Shanks from the Christie NHS foundation trust for histopathology advice. We would also like to thank Prof. John Vickerman and Dr Nick Lockyer for the use of the thin-film vapour deposition system.References
- B. Bird, M. Miljkovic, M. J. Romeo, J. Smith, N. Stone, M. W. George and M. Diem, Infrared micro-spectral imaging: distinction of tissue types in axillary lymph node histology, BMC Clin. Pathol., 2008, 8, 8 CrossRef.
- M. D. Brown, C. Hart, E. Gazi, P. Gardner, N. Lockyer and N. Clarke, Influence of omega-6 PUFA arachidonic acid and bone marrow adipocytes on metastatic spread from prostate cancer, Br. J. Cancer, 2010, 102(2), 403–413 CrossRef CAS.
- R. K. Dukor and C. A. Marcott, Method and system for performing infrared study on a biological sample, US Pat., 6274871, 2001.
- N. Eidelman and C. G. Simon, Characterization of combinatorial polymer blend composition gradients by FTIR microspectroscopy, J. Res. Natl. Inst. Stand. Technol., 2004, 109(2), 219–231 CrossRef CAS.
- K. R. Flower, I. Khalifa, P. Bassan, D. Demoulin, E. Jackson, N. P. Lockyer, A. T. McGown, P. Miles, L. Vaccari and P. Gardner, Synchrotron FTIR analysis of drug treated ovarian A2780 cells: an ability to differentiate cell response to different drugs?, Analyst, 2011, 136(3), 498–507 RSC.
- E. Gazi, J. Dwyer, N. Lockyer, P. Gardner, J. C. Vickerman, J. Miyan, C. A. Hart, M. Brown, J. H. Shanks and N. Clarke, The combined application of FTIR microspectroscopy and ToF-SIMS imaging in the study of prostate cancer, Faraday Discuss., 2004, 126, 41–59 RSC.
- E. Gazi, J. Dwyer, N. P. Lockyer, J. Miyan, P. Gardner, C. A. Hart, M. D. Brown and N. W. Clarke, A study of cytokinetic and motile prostate cancer cells using synchrotron-based FTIR micro spectroscopic imaging, Vib. Spectrosc., 2005, 38(1–2), 193–201 CrossRef CAS.
- K. M. Gough, L. Tzadu, M. Z. Kastyak, A. C. Kuzyk and R. L. Julian, Theoretical and experimental considerations for interpretation of amide I bands in tissue, Vib. Spectrosc., 2010, 53(1), 71–76 CrossRef CAS.
- G. Hastings, R. Wang, P. Krug, D. Katz and J. Hilliard, Infrared microscopy for the study of biological cell monolayers. I. Spectral effects of acetone and formalin fixation, Biopolymers, 2008, 89(11), 921–930 CrossRef CAS.
- A. Kocak, J. P. Lucania and S. L. Berets, Some advances in Fourier transform infrared transflection analysis and potential applications in forensic chemistry, Appl. Spectrosc., 2009, 63(5), 507–511 CrossRef CAS.
- L. Quaroni and A. G. Casson, Characterization of Barrett esophagus and esophageal adenocarcinoma by Fourier-transform infrared microscopy, Analyst, 2009, 134(6), 1240–1246 RSC.
- M. Romeo, C. Matthaus, M. Miljkovic and M. Diem, Infrared microspectroscopy of individual human cervical cancer (HeLa) cells, Biopolymers, 2004, 74(1–2), 168–171 CrossRef CAS.
- G. Steiner and E. Koch, Trends in Fourier transform infrared spectroscopic imaging, Anal. Bioanal. Chem., 2009, 394(3), 671–678 CrossRef CAS.
- B. R. Wood, K. R. Bambery, C. J. Evans, M. A. Quinn and D. McNaughton, A three-dimensional multivariate image processing technique for the analysis of FTIR spectroscopic images of multiple tissue sections, BMC Med. Imaging, 2006, 6, 12 CrossRef.
- T. A. T. Yang, S. F. Weng, N. Zheng, Q. H. Pan, H. L. Cao, L. A. Liu, H. D. Zhang and D. W. Mu, Histopathology mapping of biochemical changes in myocardial infarction by Fourier transform infrared spectral imaging, Forensic Sci. Int., 2011, 207(1–3), E34–E39 CrossRef CAS.
- J. A. Cohen and C. Virnelson, FT-IR spectrometer window and method, US Pat., 5160826, 1991.
- P. Bassan, H. J. Byrne, J. Lee, F. Bonnier, C. Clarke, P. Dumas, E. Gazi, M. D. Brown, N. W. Clarke and P. Gardner, Reflection contributions to the dispersion artefact in FTIR spectra of single biological cells, Analyst, 2009, 134(6), 1171–1175 RSC.
- J. Lee, E. Gazi, J. Dwyer, M. D. Brown, N. W. Clarke, J. M. Nicholson and P. Gardner, Optical artefacts in transflection mode FTIR microspectroscopic images of single cells on a biological support: the effect of back-scattering into collection optics, Analyst, 2007, 132(8), 750–755 RSC.
- K. R. Bambery, B. R. Wood and D. McNaughton, Resonant Mie scattering (RMieS) correction applied to FTIR images of biological tissue samples, Analyst, 2012, 137(1), 126–132 RSC.
- P. Bassan, H. J. Byrne, F. Bonnier, J. Lee, P. Dumas and P. Gardner, Resonant Mie scattering in infrared spectroscopy of biological materials – understanding the ‘dispersion artefact’, Analyst, 2009, 134(8), 1586–1593 RSC.
- P. Bassan, A. Kohler, H. Martens, J. Lee, H. J. Byrne, P. Dumas, E. Gazi, M. Brown, N. Clarke and P. Gardner, Resonant Mie Scattering (RMieS) correction of infrared spectra from highly scattering biological samples, Analyst, 2010, 135(2), 268–277 RSC.
- P. Bassan, A. Kohler, H. Martens, J. Lee, E. Jackson, N. Lockyer, P. Dumas, M. Brown, N. Clarke and P. Gardner, RMieS-EMSC correction for infrared spectra of biological cells: extension using full Mie theory and GPU computing, J. Biophotonics, 2010, 3(8–9), 609–620 CrossRef CAS.
- P. Bassan, A. Sachdeva, A. Kohler, C. Hughes, A. Henderson, J. Boyle, J. H. Shanks, M. Brown, N. W. Clarke and P. Gardner, FTIR microscopy of biological cells and tissue: data analysis using resonant Mie scattering (RMieS) EMSC algorithm, Analyst, 2012, 137(6), 1370–1377 RSC.
- S. Boydston-White, T. Gopen, S. Houser, J. Bargonetti and M. Diem, Infrared spectroscopy of human tissue. V. Infrared spectroscopic studies of myeloid leukemia (ML-1) cells at different phases of the cell cycle, Biospectroscopy, 1999, 5(4), 219–227 CrossRef CAS.
- A. Kohler, J. Sule-Suso, G. D. Sockalingum, M. Tobin, F. Bahrami, Y. Yang, J. Pijanka, P. Dumas, M. Cotte, D. G. van Pittius, G. Parkes and H. Martens, Estimating and correcting Mie scattering in synchrotron-based microscopic Fourier transform infrared spectra by extended multiplicative signal correction, Appl. Spectrosc., 2008, 62(3), 259–266 CrossRef CAS.
- B. Mohlenhoff, M. Romeo, M. Diem and B. R. Woody, Mie-type scattering and non-Beer–Lambert absorption behavior of human cells in infrared microspectroscopy, Biophys. J., 2005, 88(5), 3635–3640 CrossRef CAS.
- M. Romeo and M. Diem, Correction of dispersive line shape artifact observed in diffuse reflection infrared spectroscopy and absorption/reflection (transflection) infrared micro-spectroscopy, Vib. Spectrosc., 2005, 38(1–2), 129–132 CrossRef CAS.
- M. Romeo, B. Mohlenhoff and M. Diem, Infrared micro-spectroscopy of human cells: causes for the spectral variance of oral mucosa (buccal) cells, Vib. Spectrosc., 2006, 42(1), 9–14 CrossRef CAS.
- J. Filik, M. D. Frogley, J. K. Pijanka, K. Wehbe and G. Cinque, Electric field standing wave artefacts in FTIR micro-spectroscopy of biological materials, Analyst, 2012, 137(4), 853–861 RSC.
- H. Brooke, D. L. Perkins, B. Setlow, P. Setlow, B. V. Bronk and M. L. Myrick, Sampling and quantitative analysis of clean B. subtilis spores at sub-monolayer coverage by reflectance Fourier transform infrared microscopy using gold-coated filter substrates, Appl. Spectrosc., 2008, 62(8), 881–888 CrossRef CAS.
- B. J. Davis, P. S. Carney and R. Bhargava, Theory of midinfrared absorption microspectroscopy: I. Homogeneous samples, Anal. Chem., 2010, 82(9), 3474–3486 CrossRef CAS.
- B. J. Davis, P. S. Carney and R. Bhargava, Theory of mid-infrared absorption microspectroscopy: II. Heterogeneous samples, Anal. Chem., 2010, 82(9), 3487–3499 CrossRef CAS.
- P. Gardner, S. LeVent and M. Pilling, A theoretical investigation of the far-infrared RAIRS experiment applied to a buried metal layer substrate, Surf. Sci., 2004, 559(2–3), 186–200 CrossRef CAS.
- S. Le Vent, M. J. Pilling and P. Gardner, A theoretical study of inverse features in far-infrared RAIRS spectra from non-metallic substrates, Surf. Sci., 2005, 587(1–2), 150–158 CrossRef CAS.
- M. J. Pilling, P. Gardner and S. Le Vent, Considerations of optical anisotropy in the simulation of reflection absorption infrared spectra, Surf. Sci., 2005, 582(1–3), 1–13 CrossRef CAS.
- E. Gazi, J. Dwyer, N. P. Lockyer, J. Miyan, P. Gardner, C. Hart, M. Brown and N. W. Clarke, Fixation protocols for subcellular imaging by synchrotron-based Fourier transform infrared microspectroscopy, Biopolymers, 2005, 77(1), 18–30 CrossRef CAS.
- E. Hecht, Optics, Pearson Education, Addison-Wesley Series in Physics, 4th edn, 1974 Search PubMed.
- Z. Knittl, Optics of Thin Films, John Wiley, 1981 Search PubMed.
- E. D. Palik, Handbook of Optical Constants of Solids, Academic Press, Orlando, 1985, vol. 1 Search PubMed.
- H. A. Kramers, Atti. congr. intern. fisici, Como, 1927, 2, 545–557 Search PubMed.
- R. L. Kronig, J. Opt. Soc. Am., 1926, 12(6), 547 CrossRef CAS.
- A. Savitzky and M. J. E. Golay, Smoothing and differentiation of data by simplified least squares procedures, Anal. Chem., 1964, 36(8), 1627 CrossRef CAS.
- D. C. Fernandez, R. Bhargava, S. M. Hewitt and I. W. Levin, Infrared spectroscopic imaging for histopathologic recognition, Nat. Biotechnol., 2005, 23(4), 469–474 CrossRef CAS.
- C.-C. Chang and C.-J. Lin, LIBSVM: a library for support vector machines, ACM Trans. Intell. Syst. Technol., 2011, 2(3), 1–27 CrossRef.
Footnote |
| † Present address: Department of Chemistry and Molecular Biology, University of Gothenburg, 412 96 Göteborg, Sweden. |
| This journal is © The Royal Society of Chemistry 2013 |

