Simultaneous electroanalytical determination of hydroquinone and catechol in the presence of resorcinol at an SiO2/C electrode spin-coated with a thin film of Nb2O5
Thiago C.
Canevari
*a,
Leliz T.
Arenas
b,
Richard
Landers
c,
Rogério
Custodio
a and
Yoshitaka
Gushikem
a
aInstitute of Chemistry, State University of Campinas, PO Box 6154, 13084-971 Campinas, SP, Brazil. E-mail: tccanevari@gmail.com; Fax: +55 19 3521-3109; Tel: +55 19 3521-3109
bInstitute of Chemistry, Federal University of Rio Grande do Sul, Porto Alegre, RS, Brazil
cInstitute of Physics Gleb Wataghin, State University of Campinas, Campinas, SP, Brazil
First published on 23rd October 2012
Abstract
This paper describes the development, characterization and application of an Nb2O5 film formed on the surface of a carbon ceramic material, SiO2/C, obtained by a sol–gel method, using the spin-coating technique. The working electrode using this material will be designated as SiCNb. Hydroquinone and catechol can be oxidized at this electrode in the presence of resorcinol, allowing their simultaneous detection. The electrochemical properties of the resulting electrode were investigated using cyclic and differential pulse voltammetry techniques. Well-defined and separated oxidation peaks were observed by differential pulse voltammetry in Tris–HCl buffer solution at pH 7 containing 1 mol L−1 KCl in the supporting electrolyte solution. The SiCNb electrode exhibited high sensitivity in the simultaneous determination of hydroquinone and catechol in the presence of resorcinol, with the limits of detection for hydroquinone and catechol being 1.6 μmol L−1 and 0.8 μmol L−1, respectively. Theoretical calculations were performed to determine the ionization energies of hydroquinone, catechol and resorcinol; the results were used to explain the simultaneous determination of species by differential pulse voltammetry. The presence of resorcinol did not produce any interference in the simultaneous detection of hydroquinone and catechol on the surface of the modified electrode.
1. Introduction
Hydroquinone (HQ, 1,4-dihydroxybenzene), catechol (CC, 1,2-dihydroxybenzene) and resorcinol (RC, 1,3-dihydroxybenzene) are phenolic compounds incorporated into a wide variety of organic pollutants, as they are used in a number of industrial processes.1 Dihydroxybenzenes can be introduced into the environment from a variety of industrial and natural sources. They are often used as industrial reagents in the production of rubber, dyes, plastics, pharmaceuticals and cosmetics. These compounds are also highly toxic to humans, are suspected of being carcinogens and their degradation has a negative impact on the environment.2,3 They usually coexist and interfere with each other during their identification, due to their similar structures and characteristics. Therefore, it is necessary to develop an effective electrochemical sensor for the simultaneous detection of these dihydroxybenzene isomers.Several analytical methods to evaluate these isomers have been employed, such as high performance liquid chromatography,4,5 fluorescence and UV-Vis spectroscopy6,7 and electrochemical methods.8–10 The electrochemical method is one of the most commonly used techniques in environmental and biological research because of its high sensitivity, rapid response, low detection limit and easy operation. Given that the electrochemical oxidation of phenols on the surface of unmodified or bare electrodes takes place at high overpotentials without a separation between their oxidation peaks,8,9 new materials have been used to fabricate modified electrodes to measure these isomers by electrochemical methods. These materials include mesoporous platinum,8 boron-doped diamond,9 modified glass carbon,10 functionalized SBA-15 mesoporous silica,11 carbon nanotubes,12 gold nanoparticles on carbon nanotubes,13 mesoporous carbon14 and biosensors.15–18
The SiO2/Nb2O5 mixed oxide, due to the presence of a Brønsted acid, high surface area, wide band gap and high thermal and chemical stability, is used in different areas, such as catalysis,19 photocatalysis,20 ion exchange matrices21–23 and in the manufacture of chemical sensors.24,25 SiO2/Nb2O5 can be obtained as a thin film of Nb2O5 on the surface of silica by using the grafting technique23 to form Si–O–Nb bonds or as highly dispersed Nb2O5 particles inside a silica matrix using the sol–gel method.24
Carbon ceramic electrodes (CCEs) are used in the development of electrochemical sensors,26,27 due to features such as rigidity, porosity, an easily renewable surface, durability and constant electrical conductivity. The constant conductivity is explained by the good distribution of graphite particles in the silica matrix.28
In this work, the electroactive species Nb2O5 was dispersed by a grafting reaction on a carbon–ceramic matrix, SiO2/C, obtained through the sol–gel method using a spin coating procedure. Taking into consideration that hydroquinone, catechol and resorcinol are considered to be environmental pollutants by the US Environmental Protection Agency (EPA) and the European Union (EU),10 the electrode prepared with the modified material, SiO2/C/Nb2O5, was used to simultaneously determine hydroquinone and catechol concentrations in the presence of resorcinol.
2. Experimental
2.1 Synthesis of SiO2/C by the sol–gel method
SiO2/C was synthesized using the sol–gel method according to the following procedure: 25 ml (0.11 mol) of tetraethylorthosilicate (TEOS; 99.8%, Aldrich) was added to 25 ml of anhydrous ethanol (99.5%, Synth). After homogenization of the solution, about 1 ml of HCl (37%, Synth) was added. The resulting solution was stirred for 4 h at 343 K to promote the hydrolysis of TEOS. After that, 3.3 g of graphite (99.99%, Aldrich) and 4 ml of water were added and the mixture was sonicated for 20 minutes at 343 K until gelation of the material occurred. The mixture was left standing at 313 K to evaporate the ethanol. The xerogel was ground and washed with ethanol in a Soxhlet system for 6 h, and then dried under vacuum (10−4 mm Hg) at 343 K for 4 h. About 30 mg of SiO2/C was pressed (pressure of 4 tonnes per cm2) into a disk with a surface area of 0.28 cm2.2.2 Dispersion of the Nb2O5 film onto the SiO2/C matrix and characterization
Nb(OC2H5)5−nCln was prepared in pure ethanol (99.9%) according to the procedure described previously, with a few modifications.23 The pressed disk of SiO2/C was spin-coated by spreading 50 μl of Nb(OC2H5)nCl5−n (0.1 mol L−1) under a rotation speed of 300 rpm at room temperature (first step). The disc was then transferred to a closed receptacle under a humid atmosphere and left for 12 h to promote complete hydrolysis of the remaining unreacted Nb–OC2H5 on the disk surface (second step).In the first step, the resulting film leads to the formation of Si–O–Nb on the surface of the material, according to the following general reaction:
![[triple bond, length as m-dash]](https://www.rsc.org/images/entities/char_e002.gif) SiOH refers to free silanol groups present on the surface of the SiO2/C matrix. In the second step, this material reacts in a humid atmosphere according to the reaction:
SiOH refers to free silanol groups present on the surface of the SiO2/C matrix. In the second step, this material reacts in a humid atmosphere according to the reaction:to generate the C/(
![[triple bond, length as m-dash]](https://www.rsc.org/images/entities/char_e002.gif) SiO)nNb(OH)n solid. The C/(
SiO)nNb(OH)n solid. The C/(![[triple bond, length as m-dash]](https://www.rsc.org/images/entities/char_e002.gif) SiO)nNb(OH)n material was thermally treated at 353 K for 4 h and will hereafter be identified as SiCNb.
SiO)nNb(OH)n material was thermally treated at 353 K for 4 h and will hereafter be identified as SiCNb.
2.3 Apparatus
The X-ray photoelectron spectrum (XPS) of the SiCNb pressed disc was obtained using a VSW HA 100 hemispherical electron analyzer, using an Al anode as the X-ray source. The X-ray source was operated at 12 keV and 15 mA. The correction of the binding energies for charge was obtained using the reference Si 2p line from silica, set at 103.4 eV.29The SiCNb morphology was evaluated by scanning electron microscopy (SEM) measurements using a JEOL JSM 6360 LV microscope operating at 20 kV, equipped with a microprobe purchased from NORAN Instruments. Energy dispersive spectrometry (EDS) was employed to analyze the niobium oxide distribution on the surface of the SiCNb electrode.
Electrochemical measurements were performed on a PGSTAT-20 galvanostat-potentiostat using an electrochemical cell composed of a working electrode (made with the prepared material), reference electrode (SCE) and counter electrode (Pt). The electrochemical techniques used were cyclic voltammetry and differential pulse voltammetry. Measurements were made in an electrochemical cell containing 25 ml of Tris–HCl buffer in 1 mol L−1 KCl supporting electrolyte solution with a scan rate of 10 mV s−1.
2.4 Theoretical study
The ionization energies of hydroquinone, catechol and resorcinol were calculated as the difference between the Gibbs free energies based on G3 theory30–32 (Gaussian 3) of the ion and neutral molecule at 298.15 K, with an average absolute deviation in relation to experimental values lower than 2 kcal mol−1 or 0.1 eV. These ionization energies were estimated considering adiabatic processes. Therefore, cations and neutral molecules had their geometries fully optimized. The calculations were usually carried out for isolated molecules. The solvent effect was analyzed considering only local contributions of one or two water molecules through hydrogen bonds with the three main compounds. All calculations were carried out with the software Gaussian/2003.332.5 Preparation of the working electrode and electrochemical measurements
The SiCNb disk, approximately 2 mm thick, was fixed at the end of a glass tube (15 cm in length and 6 mm in diameter) using cyanoacrylate ester glue. Electrical contact was made with a copper wire inserted in the glass tube. To improve the connection between the wire and the disk surface, pure graphite powder was added to the glass tube.All experiments were carried out at room temperature and high purity nitrogen was kept flowing over the solution during the experiments. Solutions of hydroquinone (99%, Merck), catechol (99%, Merck) and resorcinol (98%, Merck) were prepared daily.
3. Results and discussion
3.1 X-ray photoelectron spectroscopy (XPS)
X-ray photoelectron spectroscopy (XPS) analysis was performed in order to acquire information about the surface of the SiCNb electrode. Table 1 summarizes the XPS binding energy (eV) values obtained for the Nb2O5 film on the SiO2/C matrix, compared with those of SiO2, Nb2O5 and NbO2.| Sample | O1s (eV) | Nb3d3/2 (eV) | Nb3d5/2 (eV) | Atom% | |
|---|---|---|---|---|---|
| Nb4+ | Nb5+ | ||||
| C/SiO2/NbxOy | 530.1 | 207.3 | 210.1 | 0.2 | 0.2 |
| 528.2 | 205.6 | 208.4 | |||
| 532.7 | |||||
| Nb2O5 (ref. 34 and 35) | 529.7 | 207.5 | 210.2 | ||
| NbO2 (ref. 36 and 37) | 528.0 | 205.7 | 208.5 | ||
| SiO2 (ref. 21) | 532.7 | ||||
Fig. 1a illustrates the XPS spectrum and binding energy values of the spin–orbit components Nb3d3/2 and Nb3d5/2 at 205.6, 208.4 eV and 207.3, 210.11 eV, respectively, indicating the presence of Nb4+ and Nb5+ species on the surface.34–37 As a consequence, binding energy values of O1s at 530.1 and 528.2 eV were assigned to the oxygen bonded to niobium atoms in Nb2O5 and NbO2 oxides, respectively. This suggests that the presence of Nb4+ in SiO2/C/Nb2O5 can be explained by subjecting the material to X-ray photo-irradiation in vacuum.38,39
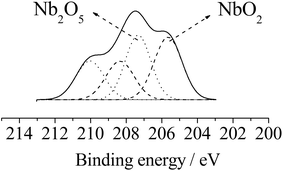 | ||
| Fig. 1 XPS spectrum for niobium species. | ||
The binding energy value of 532.7 eV exhibited by O1s refers to the Si–O bond; similar values have been reported in papers containing Nb2O5 dispersed in a silica matrix.21,40
3.2 SEM micrograph images
Fig. 2a illustrates the backscattering SEM image of the SiCNb electrode and the corresponding Nb distribution on the composite surface in Fig. 2b. In Fig. 2a two different distribution areas can be clearly observed. In the mapping images depicted in Fig. 2c the light gray zones correspond to silica while dark gray zones correspond to carbon particles, respectively. In the niobium mapping images, the Nb2O5 particles are uniformly dispersed on the disk surface at the sub-micrometric level considering the magnification used.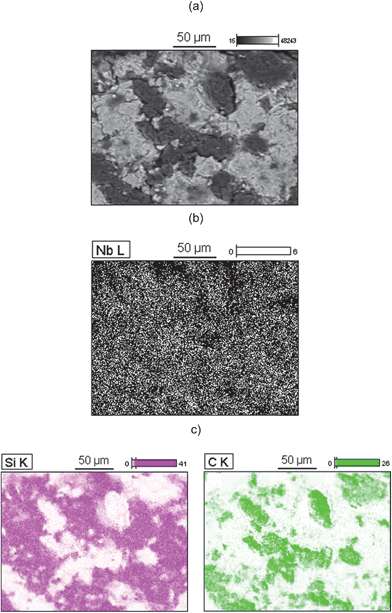 | ||
| Fig. 2 (a) SEM image of SiCNb; the corresponding EDS mapping of (b) Nb and (c) Si and C. | ||
3.3 Electrochemical oxidation of hydroquinone, catechol and resorcinol
The difference in the electrochemical behavior of the SiO2/C and SiCNb electrodes was initially examined via differential pulse voltammetry in Tris–HCl buffer, pH 7, containing 1 mol L−1 KCl solution. Fig. 3 shows the determination of hydroquinone, catechol and resorcinol by the bare SiO2/C electrode (a) and the SiCNb electrode (b), respectively. The overlapping oxidation peak at 0.146 V, in Fig. 3a, was observed for the bare SiO2/C electrode for a mixture of hydroquinone, catechol and resorcinol, indicating that the oxidation peaks of those three dihydroxybenzene isomers could not be separated at the bare electrode. In contrast, when the determination was performed at the SiCNb electrode, there was good peak separation for hydroquinone (HQ, 0.05 V), catechol (CC, 0.16 V) and resorcinol (RC, 0.535 V), as shown in Fig. 3b. These good peak separations indicate that the SiCNb electrode exhibits good electrocatalytic activity and can identify and separate dihydroxybenzene isomers.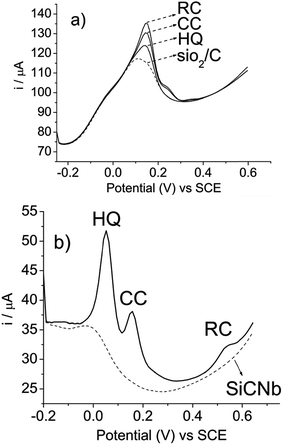 | ||
| Fig. 3 Differential pulse voltammograms of hydroquinone (HQ), catechol (CC) and resorcinol (RC): (a) bare SiO2/C electrode and (b) SiCNb electrode. Measurements performed with concentrations of 2.74 × 10⁻⁴ mol L−1 hydroquinone, 2.74 × 10⁻⁴ mol L−1 of catechol and 2.74 × 10⁻⁴ mol L−1 of resorcinol in Tris–HCl, pH 7, containing 1 mol L−1 KCl. | ||
As can be observed, the electrocatalytic response was very similar for hydroquinone and catechol. However, the behavior of resorcinol was different from that shown by the other two isomers. This can be explained by the fact that resorcinol has low reactivity9 of the aromatic ring, activated with an OH group, in comparison with hydroquinone and catechol. Therefore, in this study, resorcinol was used as a potential source of interference, since it can coexist with hydroquinone and catechol in the environment and potentially interfere with the quantitative determination of hydroquinone and catechol. For this reason, the determination of hydroquinone and catechol in the presence of resorcinol is important.
3.4 Theoretical explanation of hydroquinone, catechol and resorcinol electrooxidation on the SiO2/C and SiCNb electrode surface
The ionization energies for the three compounds are summarized in Table 2. They show that isolated hydroquinone is the most easily ionized compound, followed by catechol and resorcinol.| Hydroquinone | IP (eV) | Catechol | IP (eV) | Resorcinol | IP (eV) |
|---|---|---|---|---|---|
| Isolated | 7.96 | Isolated | 8.19 | Isolated | 8.23 |
| Hydroquinone + H2O | 7.54 | Catechol + H2O | 7.70 | Resorcinol + H2O | 7.81 |
| Hydroquinone + 2H2O | 7.45 | Catechol + 2H2O | 7.56 | Resorcinol + 2H2O | 7.54 |
These results show the same qualitative tendency observed with the simultaneous determination of the three compounds on the surface of the SiCNb electrode, as shown in Fig. 3b. However, the inclusion of one or two water molecules interacting with hydroquinone, catechol and resorcinol significantly changed the behavior of the ionization process. The presence of solvent molecules indicates that the ionization energies of the three compounds are very similar, approaching the hydroquinone ionization energy of catechol and resorcinol. It is important to see that these results are in close agreement with the electrochemical behavior shown by the bare SiO2/C electrode (see Fig. 3a). In a more simplified physical picture, ionization energies at the Hartree–Fock level of theory are associated with the negative potential of the HOMO energy orbital. Therefore, based on Table 2 and considering that the ionization energies are different for the isolated molecules, we can suggest that the interaction of the HOMO of the three molecules with the conduction band of the Nb2O5 film is more effective when the three molecules are free of solvent, facilitating electron transfer through the SiCNb surface electrode. Considering the results obtained from the calculations, the main conclusion is that the interaction of the three molecules with the SiCNb surface electrode minimizes the solvent effect on each compound, justifying the oxidation process observed experimentally.
Fig. 3b shows that the electron transfer rate through the SiCNb surface electrode is not the same for HQ, CC and RC due to structural differences. On the other hand, SiO2/C electrodes are not able to separate these compounds because the solvent effect is still significant.
3.5 Electrochemical characterization
The relationship between current (i) versus scan rate at the SiCNb electrode was studied individually in the presence of hydroquinone (Fig. 4a) and catechol (Fig. 4b), both at a concentration of 2 × 10⁻⁴ mol L−1, by cyclic voltammetry with the velocity changing from 10 to 100 V s−1. In both cases, a linear relationship was obtained between current and scan rate, i × v (shown in the insets), r = 0.999 for hydroquinone and r = 0.999 for catechol, confirming an adsorption-controlled process.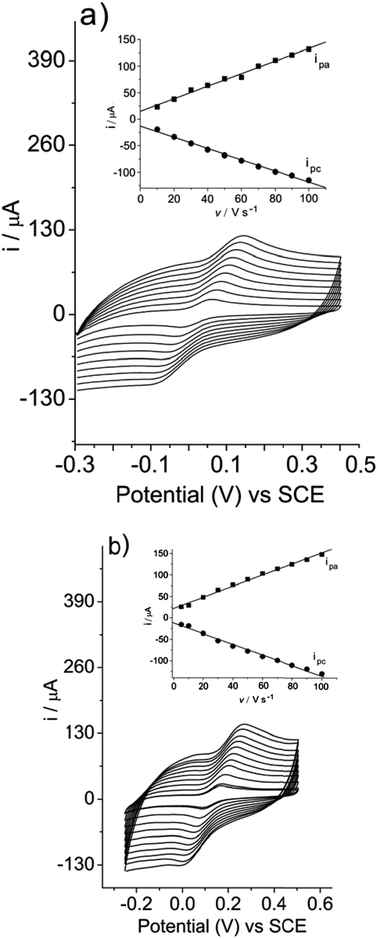 | ||
| Fig. 4 Relationship between current (i) versus scan rate (v) of (a) hydroquinone and (b) catechol both at a concentration of 2 × 10⁻⁴ mol L−1. Measurements obtained in Tris–HCl buffer, pH 7, containing KCl 1 mol L−1. | ||
The average amount (Γ) of surface-adsorbed hydroquinone and catechol on the modified electrode was calculated using Laviron's equation,41ip = 9.39 × 10⁵n2vAΓ, taking into account the slope of the current (i) versus scan rate (v) plot. The average amounts (Γ) obtained for hydroquinone and catechol were 1.12 × 10⁻¹² and 1.23 × 10⁻¹² mol cm−2, respectively. It can be inferred that hydroquinone and catechol were first adsorbed onto the SiCNb electrode surface, as suggested, followed by an oxidation process similar to what occurs with other modified electrodes.14,42
The influence of pH on the potential (E) of the SiCNb electrode was also investigated in the buffer Tris–HCl, containing 1 mol L−1 KCl solution (data not shown) by varying the pH between 3 and 7. The formal potential shifted to less positive values with an increase in pH. This behavior is due to the process of electrooxidation of phenols involving the participation of protons to form quinone.9–14 Therefore, pH 7 was used for determining hydroquinone, catechol and resorcinol, as it exhibits a less positive potential when compared to lower pH values.
3.6 Individual determination of hydroquinone and catechol on the SiCNb electrode by differential pulse voltammetry
Fig. 5 shows the individual determination of (a) hydroquinone and (b) catechol by differential pulse voltammetry. Differential pulse voltammetry was used for determining hydroquinone and catechol because this technique offers good resolution and higher sensitivity when compared to cyclic voltammetry. As can be seen, the intensity of the current of the anodic peaks of hydroquinone and catechol were increased with an increase in concentration. This indicates that the phenols were electrooxidized on the SiCNb electrode surface.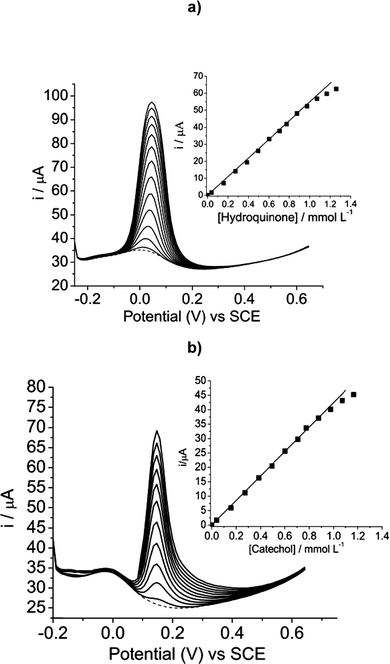 | ||
| Fig. 5 (a) Differential pulse voltammograms of hydroquinone with concentrations ranging from 3.98 × 10⁻⁵ to 1.25 × 10⁻³ mol L−1, in Tris–HCl, pH 7, containing KCl 1 mol L−1. Inset shows the plot of current intensity against concentration of hydroquinone. (b) Differential pulse voltammograms of catechol with concentrations ranging from 3.98 × 10⁻⁵ to 1.25 × 10⁻³ mol L−1, in Tris–HCl buffer, pH 7, containing KCl 1 mol L−1. Inset shows the plot of current intensity against concentration of catechol. | ||
The calibration curve for current (i) versus [hydroquinone] (inset Fig. 5a) indicated a linear relationship in the concentration range of 3.98 × 10⁻⁵ to 1.25 × 10⁻³ mol L−1, with a linear correlation of r = 0.999, n = 12, according to the following equation: i(A) = 0.00062 (±0.000372) + 54.5 (±0.58) [hydroquinone]/mmol L−1.
Similarly, the analytical curve current (i) × [catechol] (inset of Fig. 5b) also showed an excellent linear relationship in the concentration range of 3.98 × 10⁻⁵ to 1.25 × 10⁻³ mol L−1, with a correlation coefficient r = 0.999, n = 11, according to the following equation: i(A) = 0.0003 (±0.0001) + 42.31 (±0.51) [catechol]/mmol L−1.
The SiCNb electrode showed an excellent electrocatalytic response to individual determinations of hydroquinone and catechol at potentials of 0.043 V and 0.148 V, respectively. As can be seen, the SiCNb electrode showed good peak separation of hydroquinone and catechol with a difference of 105 mV between hydroquinone and catechol. This electrode could therefore be used for the simultaneous determination of hydroquinone and catechol.
3.7 Determination of a mixture of hydroquinone and catechol in the presence of resorcinol on the SiCNb electrode by differential pulse voltammetry
Taking into account the good peak separation between hydroquinone and catechol in individual determinations, a study was performed to test the versatility of the SiCNb electrode for the selective determination of hydroquinone in the presence of catechol and resorcinol and the determination of catechol in the presence of hydroquinone and resorcinol.Fig. 6 shows the determination of hydroquinone, keeping the concentrations of catechol and resorcinol constant at 2.2 × 10⁻⁴ mol L−1. As can be seen, the oxidation peak current intensities increased linearly with an increase in the concentration of hydroquinone in the range of 1.6 × 10⁻⁴ to 1.3 × 10⁻³ mol L−1. This indicates that the SiCNb electrode exhibits an excellent response to electrooxidation of hydroquinone in the presence of catechol and resorcinol. The results show that catechol and resorcinol did not interfere in the determination of hydroquinone.
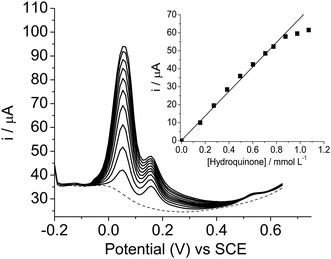 | ||
| Fig. 6 Differential pulse voltammograms of hydroquinone with concentrations ranging from 1.6 × 10⁻⁴ to 1.3 × 10⁻³ mol L−1, in the presence catechol and resorcinol of 2.1 × 10⁻⁴ mol L−1, in Tris–HCl, pH 7, containing KCl 1 mol L−1. Inset shows the plot of current intensity against concentration of hydroquinone. | ||
The inset in Fig. 6 shows that the analytical curve of current (i) versus [hydroquinone] in the presence of catechol and resorcinol exhibited a good linear relationship in the concentration range of 1.6 × 10⁻⁴ to 1.3 × 10⁻³ mol L−1, with a linear correlation coefficient r = 0.998, n = 9, according to the following equation: i(A) = 0.00095 (±0.00094) + 67.2 (±1.7) [hydroquinone]/mmol L−1.
Similarly, a study was performed for the determination of catechol, keeping the concentrations of hydroquinone and resorcinol constant at 2.1 × 10⁻⁴ mol L−1, as shown in Fig. 7. It can be seen that the anodic peak current intensities also increased with an increase in the catechol concentration ranging from 1.6 × 10⁻⁴ to 1.3 × 10⁻³ mol L−1, indicating that hydroquinone and resorcinol did not interfere in the determination of catechol. The inset in figure indicates that the analytical curve of current (i) versus [catechol] in the presence of hydroquinone and resorcinol showed a good linear relationship in the concentration range of 1.6 × 10⁻⁴ to 1.3 × 10⁻³ mol L−1, with a linear correlation coefficient r = 0.999, n = 9, according to the following equation: i(A) = 0.00055 (±0.00038) + 56.6 [catechol]/mmol L−1.
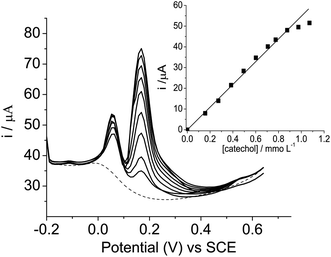 | ||
| Fig. 7 Differential pulse voltammograms of catechol with concentrations ranging from 1.6 × 10⁻⁴ to 1.3 × 10⁻³ mol L−1, in the presence to hydroquinone and resorcinol both at a concentration of 2.1 × 10⁻⁴ mol L−1, in Tris–HCl, pH 7, containing KCl 1 mol L−1. Inset shows the plot of current intensity against concentration of catechol. | ||
Considering the studies performed above, the good electrocatalytic response shown by the SiCNb electrode for the determination of hydroquinone in the presence of catechol and resorcinol and catechol in the presence of hydroquinone and resorcinol at pH 7 allows this electrode to be used in the simultaneous determination of these phenols.
3.8 Simultaneous determination of hydroquinone and catechol in the presence of resorcinol
Fig. 8 shows the simultaneous determination of hydroquinone (HQ) and catechol (CC) in the presence of a fixed concentration of resorcinol (RC) at 2.34 × 10⁻⁴ mol L−1 by the SiCNb electrode in Tris–HCl buffer, pH 7, containing 1 mol L−1 KCl. The oxidation peak currents for hydroquinone and catechol increased proportionally with the concentration; both ranging from 3.98 × 10⁻⁵ to 9.8 × 10⁻⁴ mol L−1, indicating that the SiCNb electrode can be used for the simultaneous determination of hydroquinone and catechol in the presence of resorcinol. It is crucial to note that the intensity of the peak current for resorcinol was practically unchanged due to the fixed concentration. Thus, the experimental results reported here clearly indicate that hydroquinone and catechol can be simultaneously determined in the presence of resorcinol without any interference.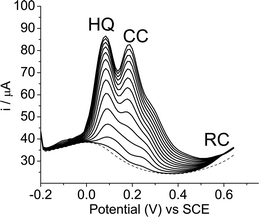 | ||
| Fig. 8 Simultaneous determination of hydroquinone (HQ) and catechol (CC) in the presence of resorcinol (RC) at the SiCNb electrode. Differential pulse voltammograms performed with different concentrations of isomers: hydroquinone and catechol from 3.98 × 10⁻⁵ to 1.3 × 10⁻³ mol L−1, keeping the concentration of resorcinol constant at 2.34 × 10⁻⁴ mol L−1. | ||
Fig. 9a and b show the analytical curves of current (i) versus [hydroquinone] and (i) versus [catechol], respectively. Fig. 7a shows that the anodic peak current was proportional to the concentration of hydroquinone and linear with the concentration range of 3.98 × 10⁻⁵ to 9.8 × 10⁻⁴ mol L−1. This can be expressed by the linear equation: i(A) = 0.000753 (±0.00045) + 52 (±1.24) [hydroquinone]/mmol L−1, with r = 0.998, n = 10. Similarly, as Fig. 7b shows, the increase in anodic peak current intensities with an increase in catechol concentration was found to be linear from 3.98 × 10⁻⁵ to 9.8 × 10⁻⁴ mol L−1. This relationship can be expressed by the linear equation: i(A) = 0.00076 (±0.000102) + 53 (±1.25)[catechol]/mmol L−1, r = 0.998, n = 10.
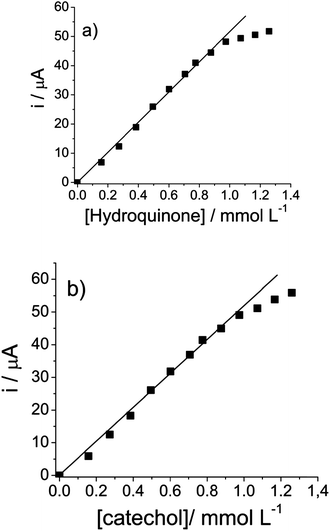 | ||
| Fig. 9 (a) Analytical curve for hydroquinone and (b) catechol. Measurements performed with different concentrations of isomers: hydroquinone and catechol from 3.98 × 10⁻⁵ to 1.3 × 10⁻³ mol L−1, keeping the concentration of resorcinol constant at 2.34 × 10⁻⁴ mol L−1. | ||
The limits of detection (LOD) for hydroquinone and catechol were found to be 1.2 μmol L−1 and 0.8 μmol L−1, respectively, determined by the formula (3× standard deviation of the blank divided by the slope of the calibration curve) in accordance with IUPAC recommendations.43
3.9 Reproducibility, durability and sensitivity of the SiCNb electrode
The modified SiCNb electrode exhibited convincing repeatability for the determination of hydroquinone and catechol, without significant loss of electrocatalytic activity with a relative standard deviation (rsd) of 2.1% for hydroquinone and 1.53% for catechol for 10 determinations at 2 × 10⁻⁴ mol L−1 for hydroquinone and catechol. Another important feature of the SiCNb electrode is that it exhibited considerable sensitivity in the simultaneous determination of hydroquinone and catechol in the presence of resorcinol (52 and 53 mmol μA L−1, respectively). Another positive characteristic is the electrode's durability: after nine months of continuous use, no detectable loss of efficiency or sensitivity was observed.Table 3 shows the efficiency for the simultaneous determination of hydroquinone and catechol at pH 7, using the SiCNb rigid disc electrode, in comparison with other modified electrodes reported in the literature. This electrode exhibits a less positive potential for the determination of hydroquinone and catechol in comparison with other modified materials. Another characteristic of this electrode is its higher sensitivity in the simultaneous determination of hydroquinone and catechol in the presence of resorcinol, as shown in Table 3.
| Modified materials | Limit of detection (mol L−1) | Potential | Sensitivity (μA L mmol−1) |
|---|---|---|---|
| a Ag/AgCl vs. SCE = −0.045 V. ECF = electrospun carbon nanofiber, PDDA-G = poly diallyldimethylammonium chloride. | |||
| SiO2/C/Nb2O5 (this work) | 1.2 × 10⁻⁶ HQ and 0.8 × 10⁻⁶ CC | 0.05 V HQ and 0.167 V CC vs. SCE | 52 HQ and 53 CC |
| ECF-CPE44 | 0.4 × 10⁻⁶ HQ and 0.2 × 10⁻⁶ CC | 0.09 V HQ and 0.2 V CC vs. Ag/AgCl | 59.4 HQ and 54.6 CC |
| Poly(acid chrome blue K carbon nanotube45) | 0.1 × 10⁻⁶ HQ and 0.1 × 10⁻⁶ CC | 0.099 V HQ and 0.179 V CC vs. SCE | 26.08 HQ and 27.58 CC |
| Activated glassy carbon electrode46 | 0.16 × 10⁻⁶ HQ and 0.11 × 10⁻⁶ CC | 0.09 V HQ and 0.19 V CC vs. Ag/AgCl | — |
| MWCNTs-IL-Gel/GCE47 (IL = ionic liquids) | 0.067 × 10⁻⁶ HQ and 0.06 × 10⁻⁶ CC | 0.153 V HQ and 0.262 V CC vs. SCE | 20.15 HQ and 11.78 CC |
| Carbon nanoparticle–chitosan composite electrode48 | 0.2 × 10⁻⁶ HQ and 0.2 × 10⁻⁶ CC | 0.1 V HQ and 0.19 V CC vs. SCE | — |
| PDDA-G-GCE49 | 0.25 × 10⁻⁶ HQ and 0.2 × 10⁻⁶ CC | 0.08 V HQ and 0.178 V CC vs. SCE | 8.7 HQ and 8.4 CC |
4. Interference of coexisting substances and water analysis
The possible interference of ascorbic acid (AA), dopamine (DP), uric acid (AU) and glucose in the detection of dihydroxybenzenes was also tested, Fig. 10 (each c = 1 x 10⁻⁴ mol L−1). It was observed that the oxidation of ascorbic acid and dopamine at the SiCNb electrode occur at −0.117 V and 0.27 V respectively, showing no influence on the detection of dihydroxybenzenes. Uric acid and glucose present no signal in the potential range studied and also does not affect the detection of dihydroxybenzenes.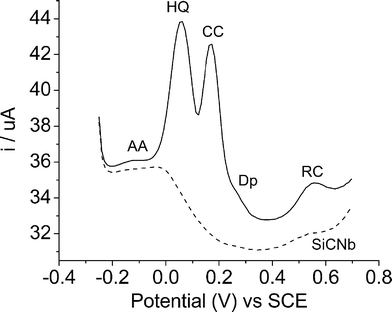 | ||
| Fig. 10 DPV curves of interferences Ascorbic acid (AA), Dopamine (DP), Uric acid (AU) and glucose (each c = 1 x 10⁻⁴ mol L−1) in presence of 0.20 mmol L−1 dihydroxybenzenes. | ||
Polluted samples were prepared by adding the standard solution of dihydroxybenzenes to tap water samples, followed by testing with the SiCNb electrode, in order to check the validity of the proposed analysis method. The water samples demonstrated that no dihydroxybenzene was detected in wastewater samples by the modified electrode, which meant that the dihydroxybenzene content was below the detection limits. The amount of hydroquinone and catechol in the presence of resorcinol in tap water samples was determined by the calibration method using differential pulse voltammetry; the results are summarized in Table 4.
As can be seen, when known amounts of hydroquinone and catechol were added to tap water samples in the presence of resorcinol at a fixed concentration of 2 × 10⁻⁴ mol L−1, the quantitative recoveries for hydroquinone and catechol were 96.3–101% and 97.5–104%, respectively. This suggests that the proposed SiCNb electrode could be used to determine the concentration of dihydroxybenzene isomers in real water samples.
4.1 Conclusions
The rigid disc SiCNb electrode showed an excellent electrocatalytic response for the determination of hydroquinone and catechol, both individually and simultaneously, without any interference from resorcinol, ascorbic acid, dopamine, uric acid, glucose during the analysis. Element mapping on the surface of the composite by the EDS technique shows a homogeneous distribution profile of Nb. Nb2O5 film formation on the surface of a rigid disk of SiO2/C was examined by XPS. Using theoretical calculations to explain the simultaneous determination of species by differential pulse voltammetry, it was possible to show that Nb2O5 minimizes the solvent effect on each compound facilitating the electron transfer into the SiCNb surface. These characteristics, associated with the excellent sensitivity and durability of the electrode, would make this material potentially useful for developing an electrochemical sensor for phenolic compounds.Acknowledgements
T.C.C. acknowledges CAPES for a doctoral fellowship. The authors are grateful to FAPESP for research grant 00/11103-5.References
- H. Truong, S. Lomnicki and B. Dellinger, Environ. Sci. Technol., 2010, 44, 1933 CrossRef CAS.
- H. Chen, J. Yao, F. Wang, M. M. F. Choib, E. Bramanti and G. Zaray, J. Hazard. Mater., 2009, 167, 846 CrossRef CAS.
- J. A. Zazo, C. B. Casas, A. Molina and J. J. R. Quintanilla, Environ. Sci. Technol., 2007, 41, 7164 CrossRef CAS.
- A. Asan and I. Isildak, J. Chromatogr., A, 2003, 988, 145 CrossRef CAS.
- A. Sun, J. Li and R. Liu, J. Sep. Sci., 2006, 29, 995 CrossRef CAS.
- S. Li, X. Li, J. Xu and X. Wei, Talanta, 2008, 75, 32 CrossRef CAS.
- M. R. HormoziNezhad, M. Alimohammadi, J. Tashkhourian and S. M. Razavian, Spectrochim. Acta, Part A, 2008, 71, 199 CrossRef.
- M. A. Ghanem, Electrochem. Commun., 2007, 9, 2501 CrossRef CAS.
- B. Nasr, G. Abdellatif, P. Canisares, C. Saäez, J. Lobato and M. Rodrigo, Environ. Sci. Technol., 2005, 39, 7234 CrossRef CAS.
- H. Yin, Q. Zhang, Y. Zhou, Q. Ma, T. Liu, L. Zhu and S. Ai, Electrochim. Acta, 2011, 56, 2748 CrossRef CAS.
- X. Zhang, S. Duan, X. Xu, S. Xu and C. Chou, Electrochim. Acta, 2011, 56, 1981 CrossRef CAS.
- Y. Quan, Z. Xue, H. Shi, X. Zhou, J. Du, X. Liu and X. Lu, Analyst, 2012, 137, 944 RSC.
- D.-W. Li, Y.-T. Li, W. Song and Y.-T. Long, Anal. Methods, 2010, 2, 837 RSC.
- J. Bai, L. Guo, J. C. Ndamanisha and B. J. Qi, J. Appl. Electrochem., 2009, 39, 2497 CrossRef CAS.
- X. Liu, L. Luo, Y. Ding and Y. Xu, Analyst, 2011, 136, 696 RSC.
- L. Wang, P. F. Huang, J. Y. Bai, H. J. Wang, L. Y. Zhang and Y. Q. Zhao, Microchim. Acta, 2007, 158, 151 CrossRef CAS.
- S. M. Mobin, B. J. Sanghavi, A. K. Srivastava, P. Mathur and G. K. Lahiri, Anal. Chem., 2010, 82, 5983 CrossRef CAS.
- Q. Yu, Y. Liu, X. Liu, X. Zeng, S. Luo and W. Wei, Electroanalysis, 2010, 22, 1012 CrossRef CAS.
- A. M. Turco, G. Bagnasco, G. Ramis, E. Santacesaria, M. Di Serio, E. Marenna, M. Bevilacqua, C. Cammarano and E. Fanelli, Appl. Catal., A, 2008, 347, 179 CrossRef.
- Q. X. Dai, H. Y. Xiao, W. S. Li, Y. Q. Na and X. P. Zhou, J. Comb. Chem., 2005, 7, 539 CrossRef CAS.
- M. P. S. Francisco, W. S. Cardoso, Y. Gushikem, R. Landers and Y. V. Kholin, Langmuir, 2004, 20, 8707 CrossRef CAS.
- F. A. Pavan, M. P. S. Francisco, Y. Gushikem and R. Landers, J. Braz. Chem. Soc., 2005, 16, 815 CrossRef CAS.
- S. Y. Denofre, Y. Gushikem, S. C. Castro and Y. Kawano, J. Chem. Soc., Faraday Trans., 1993, 89, 1057 RSC.
- M. S. P. Francisco, W. S. Cardoso, L. T. Kubota and Y. Gushikem, J. Electroanal. Chem., 2007, 602, 29 CrossRef CAS.
- T. Skeika, C. Marcovicz, S. Nakagaki, S. T. Fujiwara, K. Wohnrath, N. Nagata and C. A. Pessoa, Electroanalysis, 2007, 19, 2543 CrossRef CAS.
- L. Rabinovich and O. Lev, Electroanalysis, 2001, 13, 265 CrossRef CAS.
- A. Salimi, H. Mamkhezri and R. Hallaj, Talanta, 2006, 70, 826 CrossRef.
- L. T. Arenas, P. C. M. Villis, J. Arguello, R. Landers, E. V. Benvenutti and Y. Gushikem, Talanta, 2010, 83, 241 CrossRef CAS.
- D. A. Shirley, Phys. Rev. B: Condens. Matter Mater. Phys., 1972, 5, 4709 CrossRef.
- K. Raghavachari and L. A. Curtiss, G2, G3, and Associated Quantum Chemical Models for Accurate Theoretical Thermochemistry: Theory and Applications of Computational Chemistry – The First Forty YearsElsevier, Amsterdam, 2005 Search PubMed.
- L. A. Curtiss, K. Raghavachari, P. C. Redfern, V. Rassolov and J. A. Pople, J. Chem. Phys., 1998, 109, 7764 CrossRef CAS.
- D. H. Pereira, A. F. Ramos, N. H. Morgon and R. Custodio, J. Chem. Phys., 2011, 135, 034106 CrossRef.
- M. J. Frisch, G. W. Trucks, H. B. Schlegel, G. E. Scuseria, M. Robb, J. R. Cheeseman, J. Montgomery Jr, T. Vreven, K. N. Kudin, J. C. Burant, J. M. Millam, S. S. Iyengar, J. Tomasi, V. Barone, B. Mennucci, M. Cossi, G. Scalmani, N. Rega, G. Petersson, H. Nakatsuji, M. Hada, M. Ehara, K. Toyota, R. Fukuda, J. Hasegawa, M. Ishida, T. Nakajima, Y. Honda, O. Kitao, H. Nakai, M. Klene; X. Li, J. E. Knox, H. P. Hratchian, J. B. Cross, V. Bakken, C. Adamo, J. Jaramillo, R. Gomperts, R. E. Stratmann, A. J. Yazyev, R. Cammi, C. Pomelli, J. W. Ochterski, P. Y. Ayala, K. Morokuma, G. Voth, O. Salvador, J. J. Dannenberg, V. G. Zakrzewski, S. Dapprich, A. C. Daniels, M. C. Strain, O. Farkas, D. K. Malick, A. C. Rabuck, K. Raghavachari, J. B. Foresman, J. V. Ortiz, Q. Cui, G. Baboul; S. Clifford, J. Cioslowski, B. B. Stefanov, G. Liu, Liashenko, P. Piskorz, I. Komaromi, R. L. Martin, D. J. Fox, T. Keith, M. Al-Laham, C. Y. Peng, A. Nanayakkara, M. Challacombe, P. M. W. Gill, B. Johnson, W. Chen, M. W. Wong, C. Gonzalez and J. Pople, Gaussian 03, Revision B.05, Gaussian, Incorporation, Wallingford, CT, 2003 Search PubMed.
- N. Ozer, T. Barreto, T. Buyuklimanli and C. M. Lampert, Sol. Energy Mater. Sol. Cells, 1995, 36, 433 CrossRef CAS.
- I. Milosev, T. Kosec and H. H. Strehblowc, Electrochim. Acta, 2008, 53, 3547 CrossRef CAS.
- V. V. Atuchina, I. E. Kalabina, V. G. Keslerb and N. V. Pervukhinac, J. Electron Spectrosc. Relat. Phenom., 2005, 142, 129 CrossRef.
- S. A. O'Neill, I. P. Parkin, R. J. H. Clark, A. Mills and N. Elliott, J. Mater. Chem., 2003, 13, 2952 RSC.
- M. Ziolek, Catal. Today, 2003, 78, 47 CrossRef CAS.
- H. Kokusen, S. Matsuhara, Y. Nishino, S. Hasegawa and K. Kubono, Catal. Today, 1996, 28, 191 CrossRef CAS.
- M. S. P. Francisco, R. Landers and Y. Gushikem, J. Solid State Chem., 2004, 177, 2432 CrossRef CAS.
- A. J. Bard and L. R. Faulkner, Electrochemical Methods, Fundamentals and Applications, Wiley, New York, 2nd edn, 2001, p. 501 Search PubMed.
- M. Li, F. Ni, Y. Wang, S. Xu, D. Zhang, S. Chen and L. Wang, Electroanalysis, 2009, 21, 1521 CrossRef CAS.
- Analytical Methods Committee, Analyst, 1987, 112, 199 RSC.
- Q. Guo, J. Huang, P. Chen, Y. Liu, H. Hou and T. You, Sens. Actuators, B, 2012, 163, 179 CrossRef CAS.
- P. Yang, W. Wei and L. Yang, Microchim. Acta, 2007, 157, 229 CrossRef CAS.
- A. J. S. Ahammad, S. Sarker, M. A. Rahman and J. J. Lee, Electroanalysis, 2010, 22, 694 CrossRef CAS.
- C. Bu, X. Liu, Y. Zhang, L. Li, X. Zhou and X. Lu, Colloids Surf., B, 2011, 88, 292 CrossRef CAS.
- M. Amiri, S. Ghaffari, A. Bezaatpour and F. Marken, Sens. Actuators, B, 2012, 162, 194 CrossRef CAS.
- L. Wang, Y. Zhang, Y. Du, D. Lu, Y. Zhang and C. Wang, J. Solid State Electrochem., 2011, 1 Search PubMed.
| This journal is © The Royal Society of Chemistry 2013 |


