Using droplet-based microfluidic technology to study the precipitation of a poorly water-soluble weakly basic drug upon a pH-shift
Francine
Edwards
a,
Christina
Tsakmaka
a,
Stephan
Mohr
a,
Peter R.
Fielden
a,
Nick J.
Goddard
a,
Jonathan
Booth
b and
Kin Y.
Tam
*c
aSchool of Chemical Engineering and Analytical Science, The University of Manchester, PO Box 88, Sackville Street, Manchester M60 1QD, UK
bAstraZeneca, Charter Way, Macclesfield, Cheshire, SK10 2NA, UK
cAstraZeneca, Mereside, Alderley Park, Macclesfield, Cheshire SK10 4TG, UK. E-mail: kin_tam@hotmail.com
First published on 6th November 2012
Abstract
The purpose of this study is to develop a droplet-based microfluidic device capable of monitoring drug precipitation upon a shift from gastric pH (pH 1.5) to intestinal pH (pH 6.5–7.0). The extent of precipitation occurring in droplets over time was measured using a novel on-chip laser scattering technique specifically developed for this study. The precipitation of ketoconazole, a poorly water-soluble basic drug, was investigated under different concentrations and pH values. It has been shown that the drug precipitates rapidly under supersaturation. Two water-soluble aqueous polymers, namely, polyvinylpyrrolidone (PVP) and hydroxypropylmethylcellulose (HPMC) have been evaluated as precipitation inhibitors. HPMC was shown to be the most potent precipitation inhibitor. It is envisaged that the microfluidic pH-shift method developed in this study would form a proof-of-concept study, towards the development of a high throughput method for screening pharmaceutical excipients/precipitation inhibitors.
1 Introduction
The prevalence of high throughput and combinational methods in drug discovery has led to an increase in the number of new chemical entities with low aqueous solubility and/or poor dissolution properties.1 The oral absorption of drugs is driven by the concentration of dissolved drug present at the intestine wall. Consequently, poorly water-soluble compounds typically exhibit low (and variable) bioavailability, especially at high doses. Due to the low intraluminal concentration, the efficacy is expected to be compromised, as the compound concentration at the target site may not be sufficient to elicit a pharmacological response.A number of formulation methods have been reported for overcoming or mitigating low aqueous solubility of oral drugs.2 One proven approach is to maintain an intraluminal concentration that is above the intrinsic solubility of the active pharmaceutical ingredient (API). This strategy is referred to as a supersaturating drug delivery system,3 and can be de-convoluted into two stages: (1) rapid dissolution of the solid/solution formulation in the gastro-intestinal tract, e.g. in the stomach, to achieve a supersaturation, and (2) delay of API precipitation in the gastro-intestinal tract, e.g. in the small intestine to prolong supersaturation and maximize the chance of absorption through the intestinal epithelium cells. A broad range of strategies have been developed to achieve rapid drug dissolution, for example salts, high energy polymorphs, amorphous solid dispersions, nano-sized crystals, solid and liquid lipid based formulations.4 As for the delay of API precipitation, surfactants, such as sodium dodecyl sulphate, and water-soluble polymers, such as polyvinylpyrrolidone (PVP) and hydroxypropylmethylcellulose (HPMC), are commonly employed as precipitation inhibitors.3 It is believed that stabilization of a supersaturated state is accomplished via the kinetic control of API precipitation, typically through hydrophobic interactions and hydrogen bonding between the drug and excipient.5,6 However, the mechanisms of precipitation inhibition are not fully understood,6 and the search for suitable precipitation inhibitors for novel chemical entities rely mostly on trial-and-error experimental evaluation.
In the development of pharmaceutical formulations, screening methods to evaluate the compatibility between the API and precipitation inhibitors are of great interest.3,6,7 Typically, these methods involve monitoring API concentration as a function of time during incubation of the precipitation inhibitor with the API, which is initially in a supersaturated state. However, most of these methods allow only a limited number of excipients to be tested in one experiment, and concentration determination is usually accomplished using either UV-vis spectroscopy or HPLC after separation of solids by centrifugation or filtration.8,9 In this case there is clearly a time delay between sampling and solids separation, therefore the concentration determined will not necessarily reflect the in situ concentration at the time of sampling.
Microfluidic technology offers the advantage of studying the precipitation process with minimal sample consumption and precise control of temperature and concentrations. Moreover, the generation of monodisperse droplets in microfluidic channels allows numerous independent crystallization experiments to be performed without concern for cross-contamination. To date, research in this area has predominately focused on protein crystallisation. Examples include the optimisation of crystallisation conditions to obtain diffraction quality crystals using a concentration gradient,10 decoupling protein nucleation and growth kinetics through droplet-merging,11 and droplet concentration control through a permeable PDMS membrane.12 However, research examining the use of droplet-based microfluidics to study precipitation of smaller molecules is much more limited. Salmon et al. reported a microfluidic device on which hundreds of droplets of varying concentration could be stored under the application of a temperature gradient to investigate the solubility diagram of adipic acid.13 Droplet-based microfluidics have also been used to examine the crystal morphology of potassium nitrate.14 Ali et al. have applied a continuous phase microfluidic reactor to study the precipitation of prednisolone in the presence of anti-solvent to identify the variables affecting the precipitation process.15 Yalkowsky et al. have developed a dynamic in vitro assay to simulate the injection of a parenteral formulation into a vein, with the aim to assess drug precipitation upon dilution in a continuous phase.16,17 As far as we are aware, no work has been reported on the use of droplet-based microfluidic technology to investigate the precipitation of pharmaceuticals and the evaluation of precipitation inhibitors. We believe that this technology could offer a potentially more elegant, efficient and automatable approach to the analysis of precipitation phenomena.
In this work, we have developed a droplet-based microfluidic device to study the precipitation of a poorly water-soluble, weakly basic drug, ketoconazole. As a weak base, ketoconazole exhibits greater solubility in acidic media where ionization occurs, for example under gastric conditions (pH 1.5–2.0). At higher pHs (5.0–8.0), corresponding to gastric emptying into the small intestine, the solubility of the drug decreases and precipitation can occur. Rapid precipitation of the drug in the intestine results in low and variable oral bioavailability.18 In our microfluidic implementation, the drug is pre-dissolved as supersaturated solutions in gastric pH, to simulate rapid dissolution in a gastric environment. These solutions are then mixed with a basic buffer solution of appropriate concentration to simulate the change of pH upon gastric emptying into the small intestine. We refer to this as the pH-shift method.3 Following the pH-shift, precipitation occurring in the droplets was monitored as a function of time using an on-chip light scattering technique specifically developed for this study. With the same microfluidic device, we report the effects of precipitation inhibitors on the extent of precipitation of ketoconazole using the same pH-shift method.
2 Experimental
2.1 Chemicals
Latex bead solutions were obtained from Sigma (460, 600, 800 nm diameter). Ketoconazole was obtained from Fisher Scientific. Polyvinylpyrrolidone was obtained from BASF (Kollidon 30,![[M with combining macron]](https://www.rsc.org/images/entities/i_char_004d_0304.gif) n ∼ 12
n ∼ 12![[thin space (1/6-em)]](https://www.rsc.org/images/entities/char_2009.gif) 000). Hydroxylpropylmethylcellulose (
000). Hydroxylpropylmethylcellulose (![[M with combining macron]](https://www.rsc.org/images/entities/i_char_004d_0304.gif) n ∼ 10
n ∼ 10![[thin space (1/6-em)]](https://www.rsc.org/images/entities/char_2009.gif) 000) and phosphoric acid were obtained from Aldrich. Perfluorodecalin was obtained from Fluorochem, and trisodium phosphate from Acros Organics. All materials were used as received.
000) and phosphoric acid were obtained from Aldrich. Perfluorodecalin was obtained from Fluorochem, and trisodium phosphate from Acros Organics. All materials were used as received.
2.2 Microfabrication
Fig. 1a illustrates the chip design. A rectangular spiral channel 730 μm wide, 700 μm deep and 828.4 mm in length, with a T-junction with dimensions of 400 × 400 μm was milled into a poly(methyl methacrylate) (PMMA) substrate using a CAT3D-M6 Computer Numerical Control (CNC) milling machine (Datron Technologies Ltd, Milton Keynes, UK). The microfluidic device contains one organic inlet, two aqueous inlets and one outlet. The microfluidic chip was sealed using sterile optical sealing tape (Corning Inc., USA) and a hydrophobic coating applied to the channels by infusing a hydrofluoroether solvent containing a surface modifying fluorinated polymer (Certonal FC732, Acota Ltd, Shrewsbury, UK).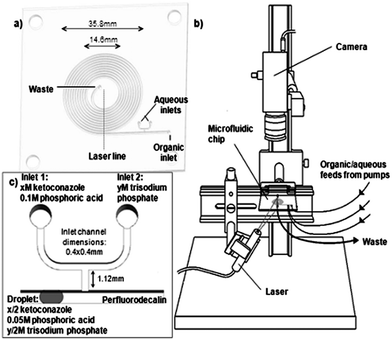 | ||
| Fig. 1 The microfluidic chip (a), the experimental configuration (b), and a schematic of droplet formation and composition (c) used to study ketoconazole precipitation. | ||
2.3 On-chip light scattering technique
Drug precipitation on chip was measured using a laser light scattering technique. The experimental setup is shown in Fig. 1b. A laser line generator (RS Components Ltd, Corby, UK) (3 mW) with a wavelength of 635 nm illuminated successive areas of the spiral channel. The amount of this light scattered was measured using a camera (Pixelink PL-A741, Ottawa, Canada) using ViMicroCam software (ViMicro Corporation, Beijing, China). The intensity of scattered light from the aqueous solution, in the form of a droplet travelling through the spiral channel (see below), was recorded as a function of time, up to 7 minutes. Measurement was undertaken at eleven time points, corresponding to the droplet reaching the laser-illuminated sections of the channel. The scattered intensity of each section was background subtracted (with same phosphate buffer droplet without precipitates) and calibrated using an aqueous solution containing different concentrations of latex bead. In this way, the response of the system was evaluated to different particle diameters (460–800 nm) and particle concentrations up to 4.0 × 10⁸ particles per mL corresponding to 0.002% w/w.2.4 The pH-shift method
Fig. 1c shows the schematic of the pH-shift experiment carried out in the microfluidic chip. Ketoconazole was dissolved in dilute phosphoric acid (0.1 M, pH 1.5) to simulate gastric conditions. The acidic solution of ketoconazole was mixed with sodium phosphate solution to achieve a pH representative of the small intestine and generate a supersaturated solution. Syringe pumps (Kloehn Inc., Las Vegas, USA) were used to infuse the aqueous solutions at flow rates of 10 μL min−1 and the organic phase at 40 μL min−1via polytetrafluoroethylene (PTFE) tubing. Monodisperse aqueous plugs, approximately 500 nL in volume, containing 50% of a solution of ketoconazole dissolved in 0.1 M phosphoric acid and 50% sodium phosphate solution were generated in perfluorodecalin which served as an immiscible “continuous phase”. Different concentrations of ketoconazole were used (x = 0.56, 0.75, 0.94, 1.13, 1.32, 1.51, 1.69, 1.88 mM, see Fig. 1c). The concentration of the sodium phosphate solution (y M, see Fig. 1c) was varied so as to produce a buffered solution of desired pH upon droplet formation. Precipitation of ketoconazole at pH 6.5 (y = 0.19 M) and pH 7.0 (y = 0.62 M) was investigated in this study. The pH values of the mixed solutions were cross-checked using a digital pH meter (model 211, Hanna Instruments, Leighton Buzzard, UK).2.5 Excipient effects
Two water-soluble polymers, namely, polyvinylpyrrolidone (PVP) and hydroxylpropylmethylcellulose (HPMC) were studied. The water-soluble polymers were dissolved in the sodium phosphate solution at various concentrations (0.84, 1.68, 2.54, 3.40 mM of PVP, and 0.10, 0.20, 0.30 mM of HPMC). The pH-shift experiment as described in Section 2.4 was repeated for each of these concentrations to study the effect of each polymer on ketoconazole precipitation. Light scattering due to the presence of dissolved polymer was investigated by infusing solutions of 5 mM PVP and 5 mM HPMC, corresponding to concentrations greater than those used in the precipitation experiments.2.6 Solubility determination
A known mass of ketoconazole (ca. 1 mg) was added to 0.1 M pH 7.4 aqueous phosphate buffer or pH 6.5 Fasted State Simulated Intestinal Fluid (FaSSIF)19 to achieve a concentration of 1 mg mL−1, and then stirred for 24 hours using parylene coated discs (5.3 mm) and a magnetic stirrer (model VP710E, V&P Scientific, San Diego, USA). The stirring was carried out at room temperature for the pH 7.4 buffer experiment and at 37 °C for the FaSSIF experiment. The resulting mixture was centrifuged (Jouan Centrifuge, model Kr 4i, Thermo Electron, UK) twice at 3800 rpm to remove any un-dissolved material. The supernatant was analyzed with an HPLC (Waters 2790, Waters Ltd, UK) coupled with a UV diode array detector (Waters 996, Waters Ltd, UK) and the solubility was determined by comparing the peak area with that of a standard solution of known concentration.2.7 Dynamic light scattering (DLS)
DLS studies of neat ketoconazole precipitation at 25 °C were undertaken using a BI-9000 instrument (Brookhaven Instruments, Holtsville, USA) using a 200 nm detector slit width, a detection angle of 90°, and a wavelength of 514 nm. Equal volumes of the ketoconazole solution and trisodium phosphate solution were combined in a vial to produce the desired concentration and pH. The samples were then briefly vortexed and DLS measurements were taken over a 13-minute period, corresponding to a duration that was in excess of that which the precipitation of ketoconazole was tracked in the microfluidics experiments. Particle size was calculated assuming a refractive index of 1.590 for ketoconazole.3 Results and discussion
3.1 Physicochemical properties of ketoconazole
Ketoconazole is a synthetic broad-spectrum antifungal agent, which is formulated as a 200 mg tablet for oral administration.20 The drug is weakly basic with pKa values of 2.9 and 6.5,21 corresponding to the ionizations of the piperazine and the imidazole groups, respectively. As shown in Fig. 2 the solubility of ketoconazole decreases with increasing pH. At pH 6.5 in FaSSIF media, the solubility of ketoconazole was measured at 11.9 μg mL−1, which is approximately 2.5-fold greater than the solubility in pH 6.5 aqueous buffer (4.7 μg mL−1). Given the therapeutic dose of 200 mg, the minimum intraluminal concentration is expected to be in the region of 121 μg mL−1 (calculated by dividing the dose by the volume of the small intestine of 1650 mL (ref. 24)). Ignoring any convective dilutions within the lumen, the maximum intraluminal concentration is likely to be around 800 μg mL−1 (calculated by dividing the dose by a 250 mL glass of water). Defining supersaturation, S, as: | (1) |
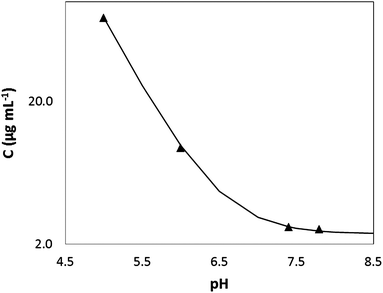 | ||
| Fig. 2 Measured solubility (C) of ketoconazole as a function of pH (symbols). The line represents the calculated solubility profile: C = C0(1 + 10(pKa−pH)) where C and C0 represent the solubility and intrinsic solubility (2.4 μg mL−1) respectively. Solubility data at pH 5.0, 6.0 and 7.8 were quoted from ref. 22 and 23. | ||
3.2 Characterisation of the on-chip light scattering system
The response of the detector was evaluated using latex suspensions. The intensity of scattered light of different diameter latex beads (460, 600, 800 nm), diameters typical of ketoconazole precipitates measured in DLS experiments discussed later, was plotted as a function of concentration (see Fig. 3). Here, the latex bead concentrations used (particles per mL) can be translated to a concentration range of 0.0002–0.002% w/w, which is consistent with the concentrations of ketoconazole (0.0001–0.0005% w/w) used in the pH-shift experiments. The intensity of scattered light was found to be responsive with both the latex particle concentration and size, under the experimental conditions adopted in the present study.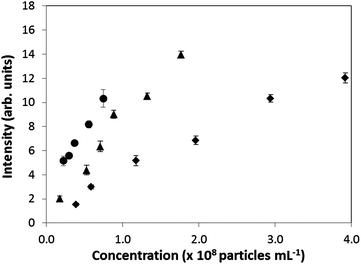 | ||
| Fig. 3 Scattered light intensity (arbitrary units) by latex bead solutions as a function of concentration. (♦ 460 nm, ▲ 600 nm, ● 800 nm bead diameter.) | ||
3.3 Effect of supersaturation on precipitation
Next we turned our attention to the pH-shift experiments using ketoconazole. The precipitation process was monitored at pH 6.5 and 7.0. Fig. 4 shows the scattered light intensity measured at a range of ketoconazole supersaturations. It can be seen that an increase in supersaturation led to an increase of scattering intensity, which is probably due to a combination of an increase in drug precipitated and particle growth (see Fig. 3 and 7). This is expected as higher supersaturation increases the driving force for precipitation. Our results clearly suggest that the on-chip light scattering detection is very sensitive to changes in supersaturation, and provides high temporal resolution to detect the onset of the precipitation processes.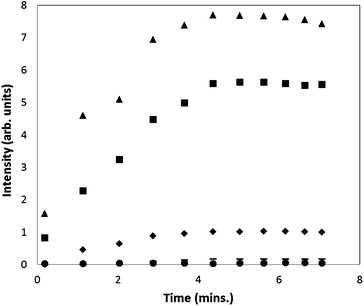 | ||
| Fig. 4 Scattered light intensity as a function of time for the precipitation of ketoconazole after a pH-shift to pH 7.0. (▲ S = 161, ■ S = 97, ♦ S = 48, – S = 32, ● blank.) | ||
As shown in Fig. 4, the scattered light intensity approaches its maximum after five minutes. This enabled us to measure the average maximum intensity for a particular experiment, which we define as the average maximum intensity values from 5 to 7 minutes. As revealed from ex situ DLS measurements carried out at a supersaturation of 48 (see Section 3.4, Fig. 7), the effective particle diameter shows little growth beyond 8 minutes, which is consistent with the on-chip light scattering data as shown in Fig. 4. Additional ex situ DLS measurements at different supersaturations (data not shown) suggested that particle sizes appear to reach steady levels beyond 8 minutes. Interestingly, the particle growth rates were found to be slower at lower supersaturations, resulting in smaller particle diameters. It is envisaged that both the particle size and particle concentrations contribute to the scattering signal. However an unambiguous delineation of these two components from the scattering signal is beyond the scope of this preliminary study, and would merit further investigation.
Fig. 5 shows the average maximum intensity against the supersaturations of ketoconazole. It can be seen that the average maximum intensity increases with supersaturation in a linear fashion (up to a supersaturation of 110), as expected if all the drug in a supersaturated state has precipitated, suggesting the average maximum intensity can be used to study drug precipitation using our microfluidic system. At higher supersaturations, the average maximum intensity begins to show a negative deviation from linearity. The linear supersaturation of 110 in our microfluidic system is well above the supersaturations of ketoconazole at FaSSIF media, and pH 6.5 buffer, corresponding to the expected minimum intraluminal concentrations for a 200 mg dose of ketoconazole (see Section 3.1). It is noted that the maximum intraluminal concentrations (correspond to supersaturations of 67 and 170, in FaSSIF and pH 6.5 aqueous buffer, respectively) represent the worst cases as the estimates were derived by neglecting any convective dilution in the lumen. Nevertheless, the linear supersaturation of 110 is still above the maximum intraluminal concentration at FaSSIF, which is a more physiologically relevant matrix. The slight negative deviation from linear beyond a supersaturation of 110 does not preclude the use of average maximum intensity for detecting drug precipitation. This is illustrated in Fig. 4, where the data obtained at a supersaturation of 160 still permits a clear identification of precipitation.
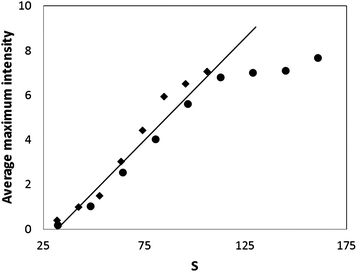 | ||
| Fig. 5 Average maximum light scattering intensity as a function of supersaturation (S): ♦ pH 6.5, ● pH 7.0. The line represents the linear regression line (R2 = 0.96) generated using data up to a supersaturation of 110. | ||
3.4 Effect of precipitation inhibitors
To evaluate the effect of water-soluble polymers on the precipitation of ketoconazole, we have studied polyvinylpyrrolidone (PVP) and hydroxylpropylmethylcellulose (HPMC) in the pH-shift experiments. The ability of these polymers to stabilize the supersaturation has been studied,3 but the potency of these polymers as precipitation inhibitors often depends on the compatibility and the molecular interactions between the drug and the polymer.5,6 In the present study, the water-soluble polymer was dissolved in the sodium phosphate solution (inlet 2, see Fig. 1c) so comes into contact with the drug upon droplet formation. Fig. 6 shows the maximum average intensity as a function of polymer concentration for PVP and HPMC at a ketoconazole supersaturation of 48.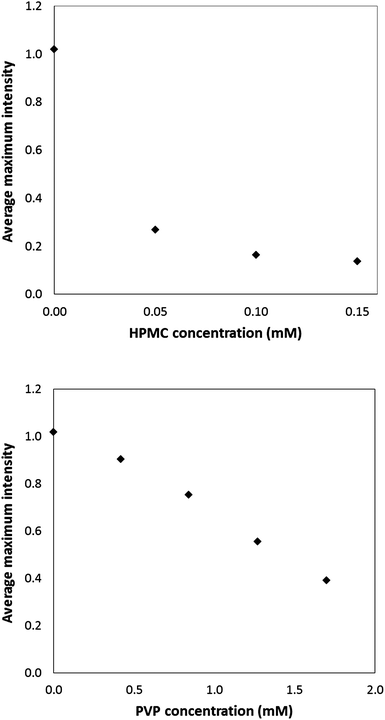 | ||
| Fig. 6 Average maximum light scattering intensity as a function of HPMC (top) and PVP (bottom) concentration, after a shift to pH 7.0 using a ketoconazole supersaturation of 48. | ||
As shown in Fig. 6, the average maximum intensities decrease in the presence of HPMC and PVP, suggesting both polymers are able to inhibit precipitation. However, the potency of precipitation inhibition is considerably better for HPMC than that of PVP. For example, with 0.05 mM HPMC, the drop in the average maximum intensity and hence precipitation inhibition was shown to outperform that of 1.7 mM PVP. Ketoconazole has eight hydrogen bond acceptors but no hydrogen bond donors. It is expected that greater interaction with the drug would be observed for a polymer capable of forming hydrogen bonds such as HPMC than a polymer which itself contains no proton bond donor, like PVP. The ex situ DLS data in Fig. 7 shows a marked decrease in effective diameter of the precipitated particles in the presence of both 0.8 mM PVP and 0.1 mM HPMC. The effect of HPMC was more pronounced resulting in a lower rate of particle growth (approximately 400 nm versus 600 nm after 10 minutes for HPMC and PVP, respectively). No scattering signal was measured from 5 mM polymer solutions (greater than the highest concentration used in the precipitation experiments), indicating the intensities observed in Fig. 7 result from precipitated drug. It is evident that HPMC is more effective at inhibiting particle growth than that of PVP in the case of ketoconazole. This finding is consistent with data reported by Taylor et al. showing that HPMC is more effective at maintaining supersaturation than PVP for the two model drugs, felodipine and indomethacin.25
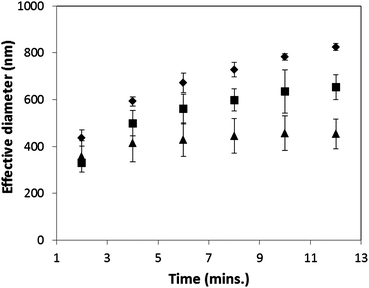 | ||
| Fig. 7 DLS measurements to illustrate the effect of HPMC and PVP on the effective diameter of the precipitated ketoconazole particles. Data obtained at pH 7.0 with a ketoconazole supersaturation of 48. (♦ no polymer, ■ 0.8 mM PVP, ▲ 0.1 mM HPMC.) | ||
This work has demonstrated the potential of the microfluidic pH-shift method for screening candidate precipitation inhibitors in the development of pharmaceutical formulations. Further work to develop this concept for the simultaneous screening of multiple precipitation inhibitors is being carried out in our laboratories, and will be reported in a future publication.
4 Conclusions
We have developed a droplet-based microfluidic device to study the precipitation of a weakly basic drug, ketoconazole, in a pH-shift experiment. The pH-shift method has been designed to mimic the change in pH environment upon gastric emptying into the small intestine at pH 6.5–7.0, where precipitation is likely to occur. An on-chip light scattering technique has been developed to monitor the precipitation. We have shown that the on-chip light scattering technique is very sensitive to drug precipitation and the scattered light intensity, was found to be linearly correlated with drug supersaturation. This trend persists up to a high supersaturation of 110. We have applied the technique to evaluate the potency of PVP and HPMC as precipitation inhibitors. Our results clearly demonstrate that HPMC is the more effective precipitation inhibitor than PVP for ketoconazole.The microfluidic pH-shift experiment developed in this study offers a novel way for precisely controlled in situ monitoring of drug precipitation. This is a step forward compared to traditional approaches that require solid separation and off-line sample quantification. We envisage that our methodology is amenable to further develop into a high throughput screen for selecting optimal pharmaceutical excipients/precipitation inhibitors, which would improve the speed and quality for the development of pharmaceutical formulations with the potential to become supersaturated during gastro-intestinal transit.
Acknowledgements
F.E. gratefully acknowledges financial support from the EPSRC/AstraZeneca for a CASE studentship. We thank Mr Rod Kittlety (AstraZeneca) for helpful discussions.Notes and references
- C. A. Lipinski, F. Lombardo, B. W. Dominy and P. J. Feeney, Adv. Drug Delivery Rev., 2001, 46, 3–26 CrossRef CAS.
- Water-Insoluble Drug Formulation, ed. R. Liu, CRC Press LLC, 2000 Search PubMed.
- J. Brouwers, M. E. Brewster and P. Augustijns, J. Pharm. Sci., 2009, 98, 2549–2572 Search PubMed.
- D. J. Hauss, Adv. Drug Delivery Rev., 2007, 59, 667–676 Search PubMed.
- H. Suzuki and H. Sunada, Chem. Pharm. Bull., 1998, 46, 482–487 Search PubMed.
- D. A. Miller, J. C. DiNunzio, W. Yang, J. W. McGinity and R. O. Williams, Drug Dev. Ind. Pharm., 2008, 34, 890–902 Search PubMed.
- E. S. Kostewicz, M. Wunderlich, U. Brauns, R. Becker, T. Bock and J. B. Dressman, J. Pharm. Pharmacol., 2004, 56, 43–51 Search PubMed.
- R. Vandecruys, J. Peeters, G. Verreck and M. E. Brewster, Int. J. Pharm., 2007, 342, 168–175 Search PubMed.
- W.-G. Dai, L. C. Dong, X. Shi, J. Nguyen, J. Evans, Y. Xu and A. A. Creasey, J. Pharm. Sci., 2007, 96, 2957–2969 Search PubMed.
- C. J. Gerdts, M. Elliott, S. Lovell, M. B. Mixon, A. J. Napuli, B. L. Staker, P. Nollert and L. Stewart, Acta Crystallogr., Sect. D: Biol. Crystallogr., 2008, 64, 1116–1122 CrossRef.
- C. J. Gerdts, V. Tereshko, M. K. Yadav, I. Dementieva, F. Collart, A. Joachimiak, R. C. Stevens, P. Kuhn, A. Kossiakoff and R. F. Ismagilov, Angew. Chem., Int. Ed., 2006, 45, 8156–8160 CrossRef CAS.
- J.-u. Shim, G. Cristobal, D. R. Link, T. Thorsen and S. Fraden, Cryst. Growth Des., 2007, 7, 2192–2194 CrossRef CAS.
- P. Laval, N. Lisai, J.-B. Salmon and M. Joanicot, Lab Chip, 2007, 7, 829–834 RSC.
- P. Laval, A. Crombez and J.-B. Salmon, Langmuir, 2009, 25, 1836–1841 CrossRef CAS.
- H. S. M. Ali, N. Blagden, P. York, A. Amania and T. Brook, Eur. J. Pharm. Sci., 2009, 37, 514–522 CrossRef CAS.
- S. H. Yalkowsky and S. C. Valvani, Drug Intell. Clin. Pharm., 1977, 11, 417–419 Search PubMed.
- J. L. H. Johnson, Y. He and S. H. Yalkowsky, J. Pharm. Sci., 2003, 92, 1574–1581 Search PubMed.
- J. G. Baxter, C. Brass, J. J. Schentag and R. L. Slaughter, J. Pharm. Sci., 1986, 75, 443–447 Search PubMed.
- J. B. Dressman, G. L. Amidon, C. Reppas and V. P. Shah, Pharm. Res., 1998, 15, 11–22 CrossRef CAS.
- Physician's Desk Reference, PDR Network LLC, 2009 Search PubMed.
- K. Walter and H. Kurz, J. Pharm. Pharmacol., 1988, 40, 689–693 Search PubMed.
- A. Diakidou, M. Vertzoni, J. Dressman and C. Reppas, Biopharm. Drug Dispos., 2009, 30, 318–325 Search PubMed.
- M. Vertzoni, A. Diakidou, M. Chatzilias, E. Söderlind, B. Abrahamsson, J. B. Dressman and C. Reppas, Pharm. Res., 2010, 27, 2187–2196 Search PubMed.
- B. Davies and T. Morris, Pharm. Res., 1993, 10, 1093–1095 CrossRef CAS.
- D. E. Alonzo, Y. Gao, D. Zhou, H. Mo, G. G. Z. Zhang and L. S. Taylor, J. Pharm. Sci., 2011, 100, 3316–3331 Search PubMed.
| This journal is © The Royal Society of Chemistry 2013 |
