DOI:
10.1039/C3BM60095E
(Paper)
Biomater. Sci., 2013,
1, 1091-1100
Synergistic effect of released dexamethasone and surface nanoroughness on mesenchymal stem cell differentiation
Received
11th April 2013
, Accepted 19th June 2013
First published on 17th July 2013
Abstract
Stem cells can alter their shapes and functions in response to the physical cues at the cell–substrate interface or the chemical signals in the culture environment. In this study, the surface nanoroughness, as a physical cue in the form of the beads-on-string features on polymer nanofibers, was fabricated through an electrospinning technology, and simultaneously dexamethasone (DEX), an osteogenic differentiation factor as a chemical signal, was incorporated into these nanofibers during this process. The morphology of the DEX-loaded nanofibers was observed with scanning electron microscopy (SEM). In vitro DEX release was carried out in PBS over a period of 29 days. The combination of the physical and chemical signals was also used to investigate the differentiation capability of rat bone marrow mesenchymal stem cells (rBMSCs) through SEM and fluorescence microscopy observation, alkaline phosphatase (ALP) activity assay, Alizarin Red S staining, quantification of mineral deposition and quantitative real-time PCR analysis. The results indicate that the DEX gradually released into the culture medium played a dominant role in promoting rBMSCs’ differentiation towards osteoblast-like cells, and the surface nanoroughness could play a supporting role in the differentiation. Therefore, this DEX-loaded polymer nanofiber scaffold with moderate surface nanoroughness has great potential application in bone tissue regeneration.
Introduction
Stem cell fate is determined by a number of factors, including soluble and matrix-bound factors, cell–cell contact and the interaction of the cells with substrate topography.1 Cells that adhere to the substrate matrix can sense the interfacial physical features of the matrix and chemical factors in the living environment. Surface topography is one of the physical features of the adhesive surface, which plays an important role in regulating survival, self-renewal, and differentiation of multipotent stem cells.2–8 Currently, numerous techniques have been employed for creating artificial substrates with a controlled nanotopographical feature on different materials.9–13 In 2012, we also attained nanoscale topographical features on the surface of polymer nanofibers fabricated by an electrospinning technology, and found that moderate surface nanoroughness could modulate and facilitate cellular functions compared with a smooth surface.14 The electrospinning approach has been widely used for fabricating polymer fiber scaffolds for tissue engineering due to the applicability of the process to a wide range of materials, as well as its simple set-up and low operating costs.15–17
Simultaneously, apart from the physical cues of material surfaces, the chemical signals in the culture environment also exert an extensive influence on the multilineage differentiation of stem cells.18,19 The differentiation of stem cells can be directly mediated by presenting appropriate chemical signals in their microenvironment.20 For instance, incubation of mesenchymal stem cells (MSCs) with dexamethasone (DEX), ascorbate and β-glycerophosphate can promote their differentiation towards osteogenic lineage.21 However, the molecular mechanisms underlying these chemical-induced regulatory signals remain mostly unknown. Generally, these chemicals are directly added into the culture medium, which can supply an induced environment for cells. The direct use of DEX has been limited mainly due to toxic side effects; therefore, the development of an novel carrier that can effectively deliver the DEX to stimulate MSCs towards osteogenic differentiation and minimize toxic side effects in vitro and in vivo has been widely studied.22–25 More recently these chemical molecules have been widely encapsulated or incorporated into the scaffold in a variety of ways during the scaffold fabrication process.26,27 Kim et al. demonstrated that the drug-loaded poly(lactic-co-glycolic acid) (PLGA) scaffold can induce osteogenic differentiation of hMSCs in vitro, and osteogenic differentiation and osteogenesis in vivo.28 Here, we use dexamethasone, a synthetic glucocorticoid, as a model drug to study the influence of chemicals on the differentiation of MSCs.
In this study, we investigated the synergistic effect of released DEX from electrospun biodegradable nanofibers and the surface nanoroughness on MSCs differentiation on the basis of our previous study.14 The surface nanoroughness on the electrospun fibers can be achieved easily and controlled conveniently by the electrospinning approach. The DEX release was investigated by adjusting the drug loading content in biodegradable polylactic (PLA) fiber matrix. The surface nanoroughness, in the form of beads-on-string features, was tuned through changing the electrospun polymer solution. To date, bone tissue trauma and diseases result in severe pain and disability for millions of people worldwide, and therapeutic repair of skeletal tissues by tissue engineering has attracted great attention.29 Therefore, the osteogenic differentiation capacity of MSCs into osteoblast-like cells was investigated by combining the released DEX and the surface nanoroughness. We anticipate that the incorporation of the chemical and physical cues can be more beneficial in promoting MSCs differentiation.
Experimental
Materials
Poly-D,L-lactide (PLA, Mw: 140 kDa) was synthesized by ring-opening polymerization of cyclic D,L-lactide monomer according to our previous report.30 The weight-average molecular weight (Mw) and its distribution (d: 1.2) were determined by Gel Permeation Chromatography (GPC, Waters 2695 and 2414, America). Dexamethasone (DEX) was purchased from Sigma-Aldrich, Germany. All other chemicals and solvents were purchased from Chengdu Kelong Chemical Reagent Factory and were of reagent grade or better, and used without further purification.
Fabrication of DEX-loaded electrospun nanofibers with moderate surface nanoroughness.
PLA with a concentration of 10% (w/v) was dissolved in acetone, and mixed with DEX with different contents (0, 1, 5, and 10 wt% PLA) at room temperature under stirring for 24 h before electrospinning. The electrospinning process was performed as follows. Briefly, the resultant mixed solution was poured separately into a 5 mL syringe attached to a circular shaped metal capillary through a polyethylene catheter (1.5 m). The circular orifice of the capillary has an inner diameter of 0.7 mm. A tension of 23 kV, a needle tip-to-ground collector distance of 12 cm and a flow rate of 2.7 mL h−1 were defined as optimized processing conditions for electrospinning. Randomly orientated nanofiber membranes were collected by the drum wrapped with aluminum foil at 50 rpm. The collected fiber meshes were dried under vacuum at room temperature for 3 days to completely remove solvent residue and then stored at 4 °C. Herein, the so-called DEX-0, DEX-1, DEX-5, DEX-10 correspond to the PLA fiber meshes with DEX contents of 0%, 1%, 5%, 10%, respectively.
Characterization of the surface nanoroughness
Scanning electron microscopy (SEM).
The electrospun nanofiber meshes were gold-coated using sputter coating to observe the surface topographies by SEM (FEI, Quanta 200, Philips, Netherlands). Micrographs were recorded at 20.0 kV with magnifications ranging from 1000 to 5000 times. The electron accelerating voltage for SEM was 20.0 kV. Micrographs from the SEM analyses were digitized and analyzed with Image Tool Pro Plus 6.0 to determine the average aspect ratio (length/width) of beads and number of beads per 100 μm length of a single fiber (bead density).
Atomic force microscopy (AFM).
Atomic force microscopy (AFM) (CSPM5000, Beijing, China) was used for deriving the surface roughness profiles. All the measurements were performed in a dry environment at room temperature in contact mode over a sampling area of 50 × 50 μm2 for each rough substrate. The AFM sample was prepared by electrospun nanofibers deposited on silica wafers, which was then dried under vacuum. Δh values measured through surface roughness scanning line represented the half-height of beads, which was calculated from the top to the nanofiber surface (not to the substrate surface).
In vitro DEX release.
The DEX release profile from the electrospun fibers was studied as follows. The fiber meshes with a weight of 50 mg were placed into individual test tubes containing 30.0 mL of phosphate buffered saline (PBS) at pH 7.4 and incubated in an air oscillatory bath at 37 °C. At predetermined intervals, 3 mL of release medium was taken out and the same volume of fresh PBS was added back into the test tube. The amount of drug released at various times, up to 696 h, was determined using UV-vis spectrophotometry (Shimadzu UV-2551, Japan) at 242 nm for DEX with the aid of the calibration curves of the drug in the same release medium. These experiments were done in triplicate for each sample.
Expansion, seeding and osteogenic differentiation of rBMSCs.
Rat bone marrow mesenchymal stem cells (rBMSCs) were obtained from 10 day-old newborn mice by a whole bone marrow culture method. Bone marrow cavity was washed with the complete medium, then bone marrow cell suspensions were collected and cultured. By changing the medium at a selected time to remove the hematopoietic cells, and strictly controlling the passage time, rBMSCs were purified. Before in vitro studies, PLA nanofiber meshes were cut into small round pieces with areas of approximately 1.5 cm2, and sterilized with ultraviolet irradiation using UV lamps. Then the fiber meshes were placed in a 24-well tissue culture plate, and tissue culture plate polystyrene (TCP) acted as a control. Finally the meshes were immersed in primary culture media for 30 min prior to cell seeding. Confluent rBMSCs at passage 4 were harvested for seeding onto the nanofiber meshes at a density of 1.0 × 10⁵ cells per well of the fiber meshes. The cells on the DEX-loaded fiber meshes were cultured in DEX-absent osteogenic differentiation media (basal medium supplemented with 50 μg mL−1 ascorbic acid and 10 mM β-glycerophosphate). The cells on TCP were supplied with standard osteogenic differentiation media (basal medium supplemented with 50 μg mL−1 ascorbic acid, 10 mM β-glycerophosphate and 100 nM dexamethasone).
Cell proliferation and morphology assessment.
The cell proliferation on the surface of fiber meshes and TCP was determined by means of the Alamar blue assay as specified by the manufacturer (Biosource, Nivelles, Belgium). Here, cell suspension was pipetted directly into the wells with an initial seeding density of 2 × 10⁴ cells per well, and supplemented with the standard growth medium media (Dulbecco's Modified Eagle's Medium-high glucose with 10% calf serum and 1% penicillin–streptomycin). At 1, 3, 5 and 7 days post cell seeding, culture medium was replaced with the working Alamar blue solution (10% Alamar blue, 80% media 199, Gibcos, and 10% FBS; v/v). After that, 200 μL samples of the supernatant from each well were collected and read at 570 nm (excitation)/600 nm (emission) in a enzyme linked immunosorbent assay (ELISA) microplate reader (Molecular Devices, Sunnyvale, CA, USA). Results are defined as mean ± standard deviation, and each sample was performed in triplicate. Cells cultured on the nanofiber meshes were analyzed by SEM (FEI, Quanta 200, Philips, Netherlands) after 3 days seeding to characterize cell morphology, spreading, elongation, and growth. For SEM observation, the samples were washed twice with PBS and fixed with 2.5% glutaraldehyde overnight at 4 °C. After that, the specimens were further dehydrated through a series of graded alcohol solutions and then left to dry overnight.31,32 The dry cellular meshes were finally sputter coated with palladium and observed under the SEM at an accelerating voltage of 20.0 kV. Similarly, in order to be observed by fluorescence microscopy (DMIL, Leica, Germany), rBMSCs cultured on the nanofiber meshes and TCP were firstly fixated by 2.5% glutaraldehyde overnight, and then stained by Rhodamine 123 (Sigma America) and 4′,6-diamidino-2-phenylindole (DAPI) (Sigma America) for cytoplasm and nuclei, respectively. High resolution images were obtained using a confocal laser scanning microscope (FV1000, Olympus, Japan). The cell surface area was calculated by Imag-Pro Plus 6 through randomly choosing 20 cells from the fluorescence microscope images per sample.
Alkaline phosphatase (ALP) quantification
ALP activity was assayed by a colorimetric method using p-nitrophenol assay,33 in which p-nitrophenylphosphate (pNPP), a colorless organic phosphate ester substrate, is hydrolysed to a yellow product, p-nitrophenol, and phosphate by the ALP. The reaction was stopped by addition of 2 M NaOH and the absorbance read at 405 nm in an ELISA microplate reader (Molecular Devices, Sunnyvale, CA, USA). The amount of ALP was calculated against a predetermined standard curve.
Mineralization analysis
Calcium deposition was determined by Alizarin Red S staining in 24-well plates. Alizarin Red S is a dye that selectively binds calcium salts and is widely used for mineral staining. The rBMSCs were cultured on the fiber meshes and TCP for 14 days or 21 days. The samples were then washed three times with PBS, fixed in ice-cold 70% ethanol for 1 h (4 °C) and then washed thrice with distilled water. After that, the ethanol-fixed samples were stained with 0.1% Alizarin Red S for 1 h at room temperature and washed several times with dH2O. These samples were observed under an optical microscope (SM11-XP) and photographed. Later, the stain was extracted with 10% cetylpyridinium chloride in 10 mM sodium phosphate buffer (pH 7.0) for 15 min at room temperature. The optical density at 545 nm of the collected dye was measured using a UV-vis spectrophotometer (Shimadzu UV-2551, Japan). Results are the mean ± standard deviation of three experiments performed in triplicate.
RNA isolation and real-time quantitative polymerase chain reaction (RT-PCR).
At determined time points (14 days), total RNA from the scaffolds was extracted using the Trizol (Sigma) method and cDNA synthesis was performed by RevertAid First Strand cDNA Synthesis Kit (Thermo, USA). Amplification of the target cDNA for real-time PCR quantification was performed according to the manufacturer, using 2 μL RT cDNA products, 0.8 μL each primer (0.4 μM) (bone-specific primer sets listed in Table 1, 10 μL SYBR Primix Ex Taq II (2×) and ddH2O, in a final volume of 20 mL. Forty-four cycles of denaturation (95 °C, 5 s), annealing (55 °C, 30 s) and extension (72 °C, 30 s) were carried out in the gradient MiniOpticon real-time PCR system (Pikoreal 96, Thermo, USA) for all genes. β-Actin was chosen as a housekeeping gene to normalize gene expression using the ΔΔCT method.34 Here, all levels of expression were normalized by the level of expression of TCP positive control (rBMSCs cultured with standard osteogenic differentiation media).
Table 1 Primer list of osteogenic markers for RT-PCR
| Gene |
Forward primers (5′–3′) |
Reverse primers (5′–3′) |
| RUNX2 |
GCT TCT CCA ACC CAC GAA TG |
GAA CTG ATA GGA CGC TGA CGA |
| OPN |
AAG CCT GAC CCA TCT CAG AA |
GCA ACT GGG ATG ACC TTG AT |
| OCN |
AAA CAT GGC AAG GTG TGT GA |
AGG TGA CCA GGA CGT TTT TG |
Results and discussion
Characterization of the DEX-loaded electrospun PLA nanofibers with nanoroughness
As depicted above, DEX, one of the typical osteogenic induction factors, was dissolved at different concentrations (0, 1, 5 and 10 wt% PLA) in the polymeric solution to be electrospun. Previously we successfully fabricated the electrospun nanofiber meshes with suitable surface nanoroughness using an optimized polymer solution of 10% (w/v).14 The nanoroughness on fibers with beads-on-string features was characterized mainly by the half-height of beads which was calculated from the top to the nanofiber surface, the aspect ratio and average number of beads. Herein, we also fixed the concentration of the electrospun polymer solution to 10% and only altered the content of the added DEX to acquire the electrospun nanofiber meshes with a similar nanoroughness to those in our previous report.14Fig. 1A shows the SEM images of the surface morphology of the randomly orientated electrospun nanofibers loaded with different concentrations of DEX. It can be observed that all the electrospun nanofibers displayed the beads-on-string feature and most of the beads on the fibers were homogeneous. The diameter of the fibers is about 400 nm. The addition of DEX has little effect on the shape of the beads. However, both the size of the beads and the diameter of fibers show a slight increase upon increasing DEX content from 0 to 10%. From the corresponding SEM photos, the aspect ratio and the average number of beads per 100 μm length of a single nanofiber can also be calculated as shown in Fig. 1B. There is no statistical difference for the aspect ratio and the average number of beads on a single fiber between every pair of samples. The important parameter of the surface nanoroughness, half-height of beads on all fibers, can be characterized with AFM. The half-heights are similar, and the typical AFM photo of DEX-5 is shown in Fig. 1C. We can find that the Δh of beads is about 710 nm.
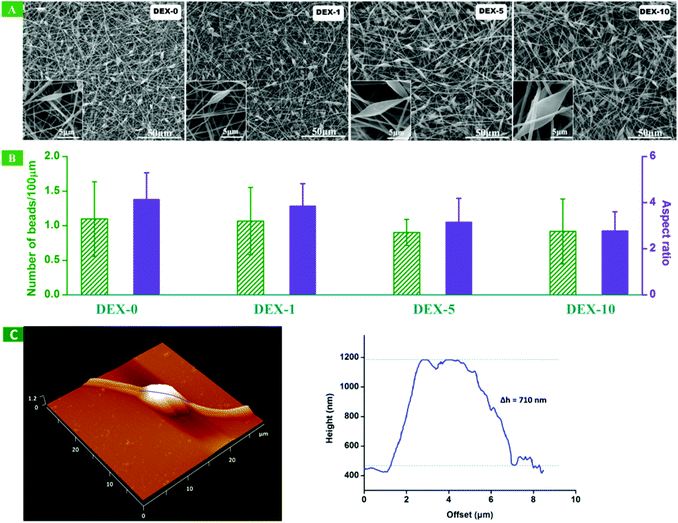 |
| | Fig. 1 (A) Scanning electron microscopy images of randomly orientated nanofibers with different DEX loading content. (B) Histograms illustrating the aspect ratio and the number of beads per 100 μm length of the randomly orientated nanofibers. (C) Typical atomic force microscopy images of DEX-5. Left: 3D image; right: the surface roughness scanning of fibers along the blue line in the left image. Δh represents the half-height of beads. | |
In vitro release of DEX from electrospun nanofiber meshes
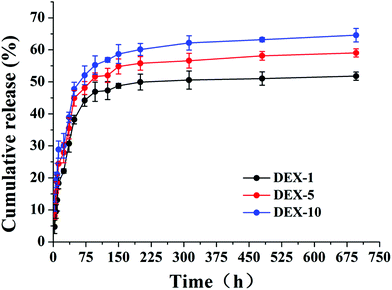
The release profile of DEX was followed over 29 days in order to maintain consistency with the culture time usually required to observe a complete osteogenic differentiation of MSCs in vitro. As shown in Fig. 2, all the curves showed a significant initial burst release of DEX during the original 2 days. At this time point, the percentages of accumulative release were 38.22%, 44.90% and 47.76% for DEX-1, DEX-5 and DEX-10, respectively. This initial quick release may derive from the diffusion of DEX distributed at or close to the surface of nanofibers. It was noticed that a higher drug loading led to a faster release rate. After 72 h, a slow sustained release of DEX was observed for all systems.
 |
| | Fig. 2
In vitro DEX release from the electrospun PLA nanofiber meshes with different DEX loading content in PBS at pH 7.4 at 37 °C. | |
Cell viability and morphology assessment
The cytotoxicity evaluation of DEX-loaded fiber meshes was performed by means of the Alamar blue assay at 1, 3, 5 and 7 days. The proliferation result of rBMSCs cultured on the fiber meshes was shown in Fig. 3A. For all the fiber meshes, rBMSCs continued proliferation during the cell culturing time. There is no significant difference among these experimental groups on the 1st and 3rd day. However, the rBMSCs viability in DEX-10 sample was obviously lower compared with TCP on day 5 and day 7. It indicates that the incorporation of 10% (w/w) DEX has a slightly negative effect on the growth of rBMSCs. In the study by Jaiswal et al., the optimal concentration of DEX for the osteogenic differentiation of MSCs should be 0.4 μg, at which concentration the expression of osteogenic markers and the formation of mineralized ECM was proved to be the most effective.21 However, when the concentration of DEX reached 4 μg, it may have an adverse effect for cultured cells. In other words, it requires about 0.4 μg (100 nM) DEX to be supplemented into the standard osteogenic medium every other day in the process of the osteogenic differentiation of MSCs. According to the release profile of DEX (Fig. 2), about 60 μg DEX released from DEX-10 nanofiber meshes into the growth medium after 24 h cell culture, which released 150 times higher than the standard osteogenic medium. After the burst release, the dosage of approximately 18 μg of DEX released from the DEX-10 nanofibers was maintained every day, which was still greatly higher than the standard concentration and could bring slight adverse effects to these cultured cells as previously reported.35 From the DEX release profile of DEX-5, we can also calculate that the accumulative release amount of DEX in the initial 24 h was 25 μg, which is temporally negative to cell growth; however, after that, the DEX released every day was maintained at about 4 μg, which was close to the standard concentration. Therefore, the cells cultured on DEX-5, DEX-1 and DEX-0 almost maintained healthy growth.
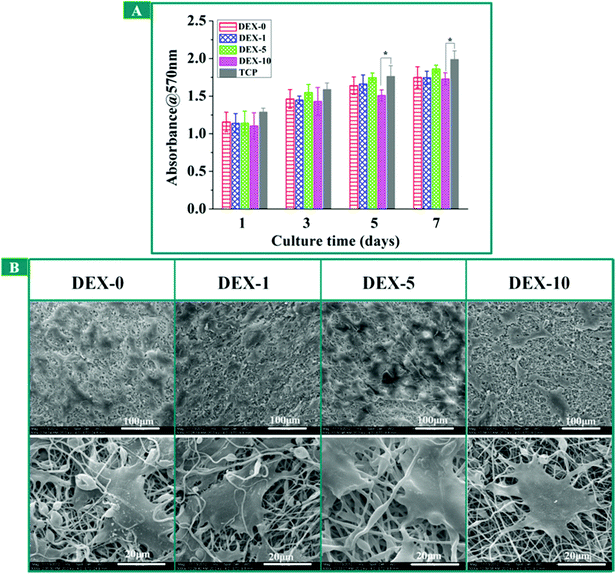 |
| | Fig. 3 (A) Cell viability determined by means of the Alamar blue assay at day 1, 3, 5 and 7. Results are presented as the mean ± SD, and experiments were performed in triplicate. * Indicates the data that has significant difference (p < 0.05, n = 3) to the blank control group, TCP at the same time point. (B) Scanning electron microscope images of rBMSCs cultured on fiber meshes for 3 days. | |
To verify the Alamar blue analysis, the morphologies of rBMSCs cultured on the fiber meshes for 3 days were observed by SEM as shown in Fig. 3B. It can be seen that rBMSCs showed normal morphology, which were polygonal and spread well on all the fiber meshes. Meanwhile, we can observe the lamellipodium and filopodium protruding from cells in SEM images. In order to further confirm the results from the Alamar blue assay, the fluorescent microscopic images of rBMSCs cultured on the fiber meshes were taken as a supplement to optical microscope images (Fig. 4A). Finally, the confocal microscopy images of rBMSCs cultured on DEX-5 was displayed so as to observe the actin cytoskeleton (Fig. 4B). It can be seen that cell proliferation on the DEX-5 sample was the best among all the samples. Furthermore, the morphology of rBMSCs on fiber meshes apparently had a larger cell area, more branching than those on TCP. As depicted in Fig. 4B, the F-actin staining on day 7 showed the formation of an actin cytoskeleton for rBMSCs cultured on DEX-5 samples. The excellent adhesion and spreading of a single rBMSC on the surface nanoroughness were also illustrated in Fig. 4C. The quantitative analysis of cell surface area was shown in Fig. 5. The incorporation of the suitable DEX dosage and moderate surface nanoroughness could promote the rBMSCs adhesion and spreading. In addition, cells cultured on the meshes can adhere to the nanofibers and develop elongated and highly branched morphology due to the presence of the DEX and the surface nanoroughness as previously reported.36
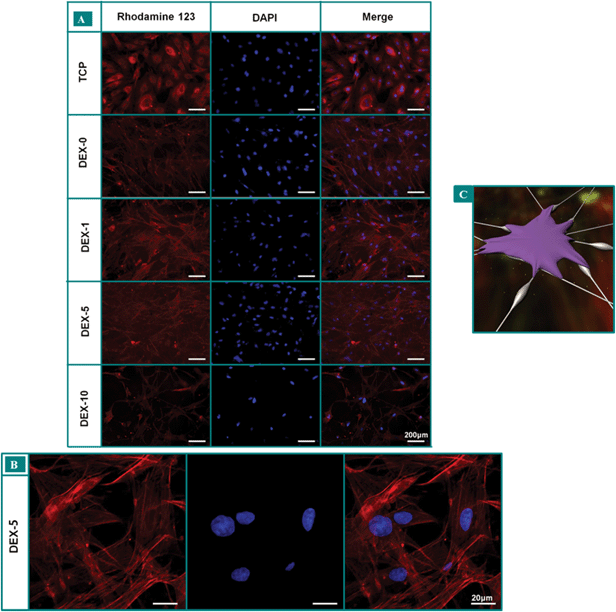 |
| | Fig. 4 (A) Fluorescence microscope images of rBMSCs cultured on fiber meshes for 7 days. The nucleus was stained by DAPI (blue) and the cytoplasm was stained by Rhodamine 123 (red). All the scale bars are 200 μm. (B) Confocal microscopy images of rBMSCs cultured on DEX-5 for 7 days. (C) Schematic representation of rBMSCs adhering to the beads-on-string nanofibers through focal adhesion, white dots indicate the DEX released from nanofibers. | |
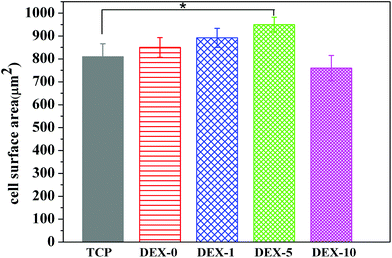 |
| | Fig. 5 The quantitative analysis of cell surface area of rBMSCs cultured on fiber meshes for 7 days. * Indicates the data that has significant difference (p < 0.05, n = 3) to TCP. | |
Alkaline phosphatase (ALP) activity
Alkaline phosphatase (ALP) is an enzyme, which was secreted from normal bone cells during the early matrix formation and maturation period. Lian et al. demonstrated that cells usually proliferate until 7 or 14 days and then start to secrete ECM proteins and produce early differentiation markers, such as ALP.37 Therefore, ALP can act as an early marker of osteogenic differentiation of hMSCs. The expression of ALP from rBMSCs cultured with TCP and all types of fiber meshes for 7, 14, and 21 days is shown in Fig. 6A. rBMSCs seeded on the fiber meshes were cultured up to 21 days and supplied with dexamethasone-absent osteogenic differentiation media and cells cultured on TCP in standard osteogenic differentiation media acted as control. As shown in Fig. 6A, we find that rBMSCs seeded on all the samples started to secrete ALP on day 7, increased continuously to day 14, and decreased on day 21. On day 7, the ALP activities of the cells that grew on the surfaces of TCP were significantly higher than those on the fiber substrates. Because ALP is triggered by cellular contact, cells on the TCP firstly reached confluence, which have been confirmed by the results of Alamar blue analysis above. However, on day 14 and day 21 the DEX-loaded fibers showed more efficient ALP activity, especially for the DEX-5 sample. The ALP activity of rBMSCs cultured on DEX-5 sample for 14 days is 0.37 nmol min−1 per 104 cells. In our previous study, we confirmed that the ALP activity of rBMSCs on day 14 was about 0.31 nmol min−1 per 104 cells under the stimulation of both the same surface nanoroughness and osteogenic inducer.14 Therefore, it is indicated that the DEX sustained release from nanofibers coupled with the surface nanoroughness on the fiber meshes could promote the differentiation of rBMSCs towards osteoblasts. Moreover, the released DEX played a dominant role in rBMSCs differentiation.
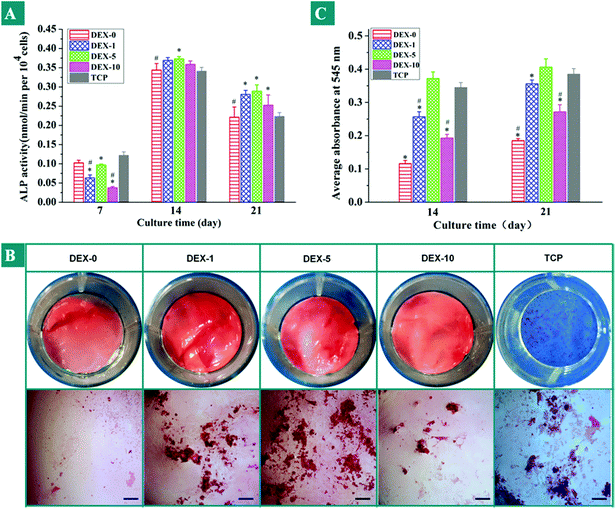 |
| | Fig. 6 (A) Alkaline phosphatase activities of rBMSCs seeded on the substrates loaded with different DEX content for 7, 14 and 21 days. (B) Photographic images of Alizarin Red S staining on day 21 after being cultured on the surfaces of TCP and various types of fiber meshes (scale bar = 200 μm). (C) The corresponding quantitative analyses of the mineralization of rBMSCs on the samples. * Significance at p < 0.05 with respect to TCPS. # Significance at p < 0.05 with respect to the sample DEX-10. | |
Mineralization
To confirm the matrix mineralization, calcium deposition was analyzed qualitatively and quantitatively by Alizarin Red S staining. Fig. 6B displays the photographic and optical images of the Alizarin Red S staining for the mineralization on rBMSCs cultured on the different surfaces for 21 days. In Fig. 6B, the red or orange-red dots dispersed in the images correspond to the mineralized nodules, and the intensity of the Alizarin Red S staining indicated the degree of mineralization. It can be seen that cells cultured on all the fiber meshes stained positively for Alizarin Red S, which indicated that rBMSCs were successfully osteogenically induced. rBMSCs cultured on the DEX-5 samples exhibited the greatest intensity, followed by those that cultured on TCP. Fig. 6C showed that the quantification of calcium deposition produced by rBMSCs that had been cultured on all types of fiber meshes for 14 and 21 days under DEX-absent osteogenic differentiation medium. Here, cells cultured on TCP under standard osteogenic differentiation medium act as a positive control. According to the obtained results, the calcium deposition on DEX-0 sample was significantly less than other samples, which can be attributed to the lack of the important osteoblast induction factor, DEX. The DEX-5 nanofibers exhibited the highest calcium content at all the time points, which was in good agreement with Fig. 5A and B. These results also indicated that the DEX released has a key influence on the differentiation of the rBMSCs to osteoblast-like cells.
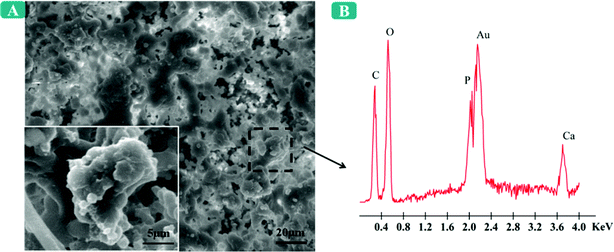
The mineralization of the extracellular matrix on the DEX-5 nanofiber meshes on the 21st day was also analyzed by SEM-EDS (Fig. 7A). As shown in Fig. 7A, a large number of bone minerals on the cellular surfaces were formed and bone nodules were apparently observed. By using energy dispersive spectrometry (EDS) (Fig. 7B), the elemental composition of the minerals deposited on the DEX-5 fiber meshes was identified. The EDS result demonstrated the presence of calcium and phosphorous deposition on the nanofiber meshes. These results demonstrated that MSCs were successfully induced to osteogenic phenotype by the released DEX and the surface nanoroughness of these nanofibers.
Real-time quantitative polymerase chain reaction (RT-PCR)
To further support the mineralization results described above, osteoblast gene expression (RUNX2, Runt-related transcription factor 2; OPN, osteopontin; and OCN, osteocalcin) was also studied by quantitative real-time PCR analysis after 14 days of incubation (Fig. 8). RUNX2 is an early marker, which can regulate bone development by G protein-coupled signaling pathway in the differentiation process of hMSCs into osteogenesis.38 OPN is a middle marker, the highest expression of which determines the end of the matrix deposition phase and the beginning of the mineralization phase. OCN is considered as the essential marker for the late stage of osteogenic differentiation, and plays an important role in the mineralization phase.39 In the DEX-absent osteogenic differentiation medium, rBMSCs cultured on DEX-5 and DEX-1 electrospun scaffolds demonstrated various levels of osteogenic up-regulation and displayed a significantly higher level of expression than those on other scaffolds. For DEX-0 sample without DEX in the DEX-absent osteogenic differentiation medium, OCN also represented an increase compared with TCP in standard osteogenic differentiation media. These results also suggested that the surface nanoroughness could play a minor role during the rBMSCs differentiation to osteoblasts, but the role of the sustained released DEX was dominant in prompting the differentiation. From the results of DEX released in vitro (Fig. 2) and cell viability (Fig. 3A), we can find that high concentrations of DEX released from DEX-10 fibers in the culture medium caused the poor adhesion of cells, which led to the down-regulated expression of the osteoblast gene. In addition, the DEX-5 sample showed the highest up-regulation level of the selected osteoblast gene among all the samples after 14 days culturation, which even exceeded the TCP (positive control). The reason is mainly due to the fact that the DEX dosage of 4 μg per day released from DEX-5 nanofibers was close to the standard osteogenic concentration, which could promote cell excellent adhesion and spreading on the surface of the nanofiber meshes, and in turn promote the rBMSCs differentiation.
 |
| | Fig. 8 Quantitative PCR analysis for osteoblast gene expression (RUNX2, OPN and OCN) by rBMSCs cultured on the substrates loaded with different DEX contents for 14 days. There were significant differences among the samples with different DEX contents for each osteoblast gene expression. | |
Conclusions
In summary, in this study we successfully fabricated the DEX-loaded nanofibers with a surface nanoroughness through an electrospinning approach. By altering the DEX loading content in these fibers the DEX release could be adjusted. The Alamar blue assay demonstrated that these electrospun nanofibers with a loading content of DEX less than or equal to 5% displayed excellent biocompatibility. The incorporation of the suitable DEX dosage and moderate surface nanoroughness could facilitate the rBMSCs adhesion and spreading. From the analysis of ALP activity, calcium deposition and the expression of osteoblast gene, we could find that the sustained released DEX from electrospun nanofibers into the culture medium played a dominant role in improving the differentiation capacity of the rBMSCs towards osteoblast-like cells, and the surface nanoroughness could play a supporting role in the differentiation in the absence of osteogenic inducer. The combination of the chemical signal and the physical cue is critical in improving the osteoinductive performance of the tissue engineering scaffold. Therefore, the multifunctional electrospun nanofibers can be used as a potential scaffold for stem cell based bone tissue regeneration.
Acknowledgements
This work was partially supported by National Basic Research Program of China (973 Program, 2012CB933600), National Natural Science Foundation of China (No. 51173150), National Key Project of Scientific and Technical Supporting Programs Funded by MSTC (2012BAI17B06), and Fundamental Research Funds for The Central Universities (SWJTU11ZT10).
Notes and references
- D. E. Discher, D. J. Mooney and P. W. Zandstra, Science, 2009, 324, 1673 CrossRef CAS.
- M. J. Dalby, N. Gadegaard, R. Tare, A. Andar, M. O. Riehle, P. Herzyk, C. D. W. Wilkinson and R. O. C. Oreffo, Nat. Mater., 2007, 6, 997 CrossRef CAS.
- M. P. Lutolf, P. M. Gilbert and H. M. Blau, Nature, 2009, 462, 433 CrossRef CAS.
- R. A. Marklein and J. A. Burdick, Adv. Mater., 2009, 22, 175 CrossRef.
- S. Oh, K. S. Brammer, Y. S. J. Li, D. Teng, A. J. Engler, S. Chien and S. Jin, Proc. Natl. Acad. Sci. U. S. A., 2009, 106, 2130 CrossRef CAS.
- H. B. Zhu, B. R. Cao, Z. P. Zhen, A. A. Laxmi, D. Li, S. S. Liu and C. B. Mao, Biomaterials, 2011, 32, 4744 CrossRef CAS.
- K. S. Park, K. J. Cha, I. B. Han, D. A. Shin, D. W. Cho, S. H. Lee and D. S. Kim, Macromol. Biosci., 2012, 12, 1480 CrossRef CAS.
- W. Q. Chen, L. G. Villa-Diaz, Y. B. Sun, S. N. Weng, J. K. Kim, R. H. W. Lam, L. Han, R. Fan, P. H. Krebsbach and J. P. Fu, ACS Nano, 2012, 6, 4094 CrossRef CAS.
- R. A. Gittens, T. McLachlan, R. Olivares-Navarrete, Y. Cai, S. Berner, R. Tannenbaum, Zvi. Schwartzb, K. H. Sandhage and B. D. Boyana, Biomaterials, 2011, 32, 3395 CrossRef CAS.
- J. J. Norman and T. A. Desai, Ann. Biomed. Eng., 2006, 34, 89 CrossRef.
- H. G. Sundararaghavan, R. B. Metter and J. A. Burdick, Macromol. Biosci., 2009, 10, 265 CrossRef.
- S. Kruss, T. Wolfram, R. Martin, S. Neubauer, H. Kessler and J. P. Spatz, Adv. Mater., 2010, 22, 5499 CrossRef CAS.
- R. Gristina, E. D'Aloia, G. S. Senesi, A. Milella, M. Nardulli, E. Sardella, P. Favia and R. d'Agostino, J. Biomed. Mater. Res., Part B, 2009, 88, 139 CrossRef.
- C. Luo, L. Li, J. R. Li, G. Yang, S. Ding, W. Zhi, J. Weng and S. B. Zhou, J. Mater. Chem., 2012, 22, 15654 RSC.
- N. Bhardwaj and S. C. Kundu, Biotechnol. Adv., 2010, 28, 325 CrossRef CAS.
- A. Nandakumar, H. Fernandes, J. de Boer, L. Moroni, P. Habibovic and C. A. van Blitterswijk, Macromol. Biosci., 2010, 10, 1365 CrossRef CAS.
- J. J. Shi, A. R. Votruba, O. C. Farokhzad and R. Langer, Nano Lett., 2010, 10, 3223 CrossRef CAS.
- C. E. Murry and G. Keller, Cell, 2008, 132, 661 CrossRef CAS.
- E. Dawson, G. Mapili, K. Erickson, S. Taqvi and K. Roy, Adv. Drug Delivery Rev., 2008, 60, 215 CrossRef CAS.
- Z. J. Liu, Y. Zhuge and O. C. Velazquez, J. Cell. Biochem., 2009, 106, 984 CrossRef CAS.
- N. Jaiswal, S. E. Haynesworth, A. I. Caplan and S. P. Bruder, J. Cell. Biochem., 1998, 64, 295 CrossRef.
- N. S. Hwang, S. Varghese and J. Elisseeff, Adv. Drug Delivery Rev., 2008, 60, 199 CrossRef CAS.
- G. T. Lim, J. E. Puskas, D. H. Reneker, A. Jákli and W. E. Horton-Jr., Biomacromolecules, 2011, 12, 1795 CrossRef CAS.
- L. T. H. Nguyen, S. S. Liao, C. K. Chan and S. Ramakrishna, J. Biomater. Sci., Polym. Ed., 2012, 23, 1771 CAS.
- A. Martins, A. R. C. Duarte, S. Faria, A. P. Marques, R. L. Reis and N. M. Neves, Biomaterials, 2010, 31, 5875 CrossRef CAS.
- C. Marianecci, D. Paolino, C. Celia, M. Fresta, M. Carafa and F. Alhaique, J. Controlled Release, 2010, 147, 127 CrossRef CAS.
- X. Zhang, X. H. Gao, L. Jiang and J. H. Qin, Langmuir, 2012, 28, 10026 CrossRef CAS.
- H. Kim, H. Suh, S. A. Jo, H. W. Kim, J. M. Lee, E. H. Kim, Y. Reinwald, S. H. Park and B. H. Min, Biochem. Biophys. Res. Commun., 2005, 332, 1053 CrossRef CAS.
- M. Ehrbar, M. P. Lutolf, S. C. Rizzi, J. A. Hubbell and F. E. Weber, Bone, 2008, 42, 72 CrossRef.
- S. B. Zhou, X. M. Deng and H. Yang, Biomaterials, 2003, 24, 3563 CrossRef CAS.
- Z. G. Chen, P. W. Wang, B. Wei, X. M. Mo and F. Z. Cui, Acta Biomater., 2010, 6, 374 Search PubMed.
- G. J. Dahe, R. S. Teotia, S. S. Kadam and J. R. Bellare, Biomaterials, 2011, 32, 353 CrossRef.
- M. A. Tabatabai and J. M. Bremner, Soil Biol. Biochem., 1969, 1, 301 CrossRef CAS.
- T. D. Schmittgen and K. J. Livak, Nat. Protoc., 2008, 3, 1101 CrossRef CAS.
- N. M. Vacanti, H. Cheng, P. S. Hill, J. D. Guerreiro, T. T. Dang, M. Ma, S. Watson, N. S. Hwang, R. Langer and D. G. Anderson, Biomacromolecules, 2012, 13, 3031 CrossRef CAS.
- G. Kumar, C. K. Tison, K. Chatterjee, P. S. Pine, J. H. McDaniel, M. L. Salit, M. F. Young and C. G. Simon Jr., Biomaterials, 2011, 32, 9188 CrossRef CAS.
- J. B. Lian and G. S. Stein, Endocr. Rev., 1993, 14, 424 Search PubMed.
- N. M. Teplyuk, M. Galindo, V. I. Teplyuk, J. Pratap, D. W. Young, J. L. Stein, J. B. Lian and A. J. van Wijnen, J. Biol. Chem., 2008, 283, 27585 CrossRef CAS.
- J. B. Lian and G. S. Stein, Crit. Rev. Oral. Biol. Med., 1992, 3, 269 CAS.
Footnote |
| † Co-first authors. |
|
| This journal is © The Royal Society of Chemistry 2013 |
Click here to see how this site uses Cookies. View our privacy policy here. 


