DOI:
10.1039/C2CE26120K
(Paper)
CrystEngComm, 2013,
15, 86-99
Lanthanide coordination compounds with 1H-benzimidazole-2-carboxylic acid: syntheses, structures and spectroscopic properties†
Received
10th July 2012
, Accepted 26th September 2012
First published on 3rd October 2012
Abstract
A flexible multidentate ligand, 1H-benzimidazole-2-carboxylic acid, was synthesized to construct a series of lanthanide coordination polymers [Ln(HBIC)3]n (Ln = Eu (1), Tb (2), Gd (3), Pr (4), Nd (5); H2BIC = 1H-benzimidazole-2-carboxylic acid) under hydrothermal conditions. All the compounds were fully characterized by elemental analysis, IR spectroscopy, single-crystal X-ray diffraction, thermal analysis and various spectroscopic techniques. Structural analyses reveal that they are isostructural and feature a 2D wave-like layer structure with distorted grids, in which the adjacent Ln3+ centers are bridged by the HBIC− ligands with two kinds of new coordination modes and the adjacent HBIC− ligands are tightly bound by two types of distinct intra-layer hydrogen bonds. The adjacent 2D layers are further interconnected by strong inter-layer hydrogen bond ring motifs R22(10) to generate a 3D supramolecular architecture. Optical studies indicate that the compounds 1, 2, 4 and 5 exhibit characteristic luminescence emission bands of the corresponding lanthanide ions in the visible or near-infrared regions at room temperature. In particular, compound 2 displays bright green luminescence in the solid state with a satisfactory 5D4 lifetime of 1.2 ms and a high overall quantum yield of 31%, due to an ideal energy gap between the lowest triplet state energy level of H2BIC ligand and the 5D4 state energy level of Tb3+. The energy transfer mechanisms in compounds 1 and 2 were also described and discussed.
Introduction
Over the past decade, the rational design and synthesis of lanthanide-based metal–organic frameworks (Ln-MOFs) have provoked great interest for their fascinating architectures and potential technological application as functional materials.1 Especially, owing to their unique photophysical properties (characteristic sharp emission and high color purity, long excited-state luminescence lifetimes up to milliseconds) as a result of transitions within the partially-filled 4f shells of the trivalent lanthanide ions, Ln-MOFs are excellent candidates for the development of optical devices.2 However, the lanthanide ions usually give weak luminescence because of the low molar absorption coefficient (less than 10 M−1 cm−1) of the Laporte forbidden f–f transitions.3 An effective approach to circumvent this problem is to efficiently transfer the energy from the ligand-centered triplet excited states of an adjacent strongly absorbing chromophore to the lanthanide metal centers.4 Therefore, searching for suitable organic antenna chromophores with high absorption in the UV/near-UV spectral region is an attractive task.
Given that lanthanide ions have high affinities for hard donor atoms such as the oxygen of carboxylic groups5 and a delocalized π-electric system could provide a strongly absorbing chromophore.6 Aromatic multidentate ligands with oxygen or hybrid oxygen–nitrogen atoms might be a good sensitizer to stimulate lanthanide ion luminescence. Recently, we have focused on a multidentate ligand, 1H-benzimidazole-2-carboxylic acid (H2BIC), in which the large π-conjugated system of the benzimidazole moiety is expected as an effective chromophore for lanthanide luminescence. The H2BIC ligand possesses four potential metal binding sites and shows flexible and various coordination modes (Scheme 1), wherein the oxygen atoms of the carboxylic group could coordinate with the lanthanide ions in terminal monodentate or diverse bridging motifs, or chelate Ln3+ with the help of the N atoms from the benzimidazole group. Meanwhile, depending on the degree of deprotonation, the H2BIC ligand can act as a hydrogen bond acceptor and donor to benefit the formation of stable supramolecular structures. On the other hand, it was found that the presence of water molecules in the first coordination sphere of the lanthanide ion is prone to quench the emission due to the activation of nonradiative decay pathways.7 So ancillary ligands with excellent chelating ability such as oxalate are widely used to prevent solvent and water molecules from entering the lanthanide coordination sphere.8 For the deprotonated HBIC− or BIC2− ligands, the sufficiently strong chelate ability like C2O42− makes them excellent candidates to form stable Ln-MOFs without coordinated water or solvent molecules.9
 |
| | Scheme 1 Diverse coordination modes of H2BIC (M = metal). | |
It is worth noting that lanthanide coordination polymers based on 1H-benzimidazole-2-carboxylic acid ligands have not been explored.10 In this contribution, five new two-dimensional Ln-MOFs based on H2BIC ligands, [Ln(HBIC)3]n (Ln = Eu (1), Tb(2), Gd(3), Pr(4) and Nd(5)), were hydrothermally synthesized and structurally characterized. The photophysical properties and thermal stability of them were also investigated. To the best of our knowledge, 1–5 are the first instances of Ln-MOFs constructed with H2BIC ligands.
Experimental
Materials and analytical methods
The 1H-benzimidazole-2-carboxylic acid (H2BIC) ligand was prepared using o-phenylenediamine as the starting material by oxidizing 2-(hydroxymethyl)benzimidazole in alkaline conditions (Scheme 2). Other chemicals and reagents were obtained from commercial sources and used without further purification. Elemental analyses for C, H, and N were performed on an Elementar Vario EL III analyzer. IR spectra were recorded on a Tensor 27 spectrometer (Bruker Optics, Ettlingen, Germany) as KBr pellets in the range of 4000–400 cm−1. 1H NMR spectrum was recorded on an INOVA-400 Varian 400 MHz instrument in DMSO-d6 solution at room temperature. Chemical shifts are reported in ppm relative to TMS. TG-DTG-DSC experiments were carried out in a simulated air atmosphere (N2: 80 mL min−1, O2: 20 mL min−1) using a NETZSCH STA 449F3 equipment at a heating rate of 10 °C min−1 from 30 to 1000 °C, an empty Al2O3 crucible was used as a reference. Powder X-ray diffraction (PXRD) data were recorded on a Bruker D8 ADVANCE X-ray powder diffractometer (Cu Kα, 1.5418 Å). Optical diffuse reflectance and UV absorption studies were carried out with a Shimadzu UV-2450 spectrophotometer. The solid-state photoluminescence analyses and lifetime measurements were performed on an Edinburgh FLSP920 fluorescence spectrometer.
 |
| | Scheme 2 Synthetic procedures for the ligand 1H-benzimidazole-2-carboxylic acid. | |
Synthesis of H2BIC
2-(Hydroxymethyl)benzimidazole.
A mixture of o-phenylenediamine (16.2 g, 0.15 mol), sodium glycolate (35.2 g, 0.6 mol) in 300 mL HCl (4 mol L−1) was stirred at 120 °C for 2 h. The reaction mixture was cooled to room temperature and filtered. The filtrate was adjusted to pH ≈ 7 by saturated sodium hydroxide solution and finally filtered to give a large amount of white microcrystals of 2-(hydroxymethyl)benzimidazole. Yield: 19.0 g (85.7%). M.p.: 131–132 °C. Anal. Calc. For C8H8N2O (Mr = 148.16): C, 64.85 H, 5.44 N, 18.91. Found: C, 64.22 H, 5.88 N, 19.01%. 1H NMR (400 MHz, DMSO-d6): δ, ppm: 12.344 (s, 1 H), 7.484–7.491 (d, 2 H), 7.110–7.151 (m, 2 H), 5.744 (s, 1 H), 4.705 (s, 2H) (see Fig. S1, ESI†). IR (KBr, v/cm−1): 3270(m), 2918(s), 2850(s), 1623(w), 1580(w), 1490(m), 1452(s), 1439(s), 1380(m), 1351(m), 1274(m), 1207(m), 1106(w), 1055(s), 1034(s), 1002(s), 995(m), 958(w), 871(w), 828(w), 769(w), 750(s), 740(s), 639(w), 451(w).
1H-Benzimidazole-2-carboxylic acid (H2BIC).
A mixture of 2-(hydroxymethyl)benzimidazole (7.40 g, 0.05 mol) and sodium hydroxide (4.00 g, 0.1 mol) in H2O (180 mL) was allowed to be stirred at 100 °C for 2 h, to which potassium permanganate (11.9 g, 0.075 mol) was added while kept stirring at 100 °C for 10 h. Then the reaction mixture was cooled to room temperature and filtered, and the filtrate was acidified with dilute hydrochloric acid to pH = 5. Upon being filtered off, washed with water, and air-dried, a large quantity of yellow solid was obtained. Yield: 7.15 g (64.9%, based on o-phenylenediamine). M.p.: 166–167 °C. Anal. Calc. For C8H6N2O2 (Mr = 162.15): C, 59.26 H, 3.73 N, 17.28. Found: C, 60.01 H, 3.81 N, 17.03%. 1H NMR (400 MHz, DMSO-d6): δ, ppm: 7.66–7.62 (m, 2 H), 7.37–7.34 (m, 2 H) (see Fig. S2, ESI†). IR (KBr, v/cm−1): 2923(m), 2842(m), 1653(s), 1530(m), 1495(s), 1388(s), 1352(s), 1279(w), 1151(w), 1020(w), 905(m), 847(m), 802(w), 766(m), 731(m), 635(m), 585(m). After several days, colorless crystals of dihydrated 1H-benzimidazol-2-carboxylate were obtained by slow evaporation of an ethanol solution of H2BIC, which was determined by single X-ray diffraction analysis (Fig. 1 and Table 1).10d
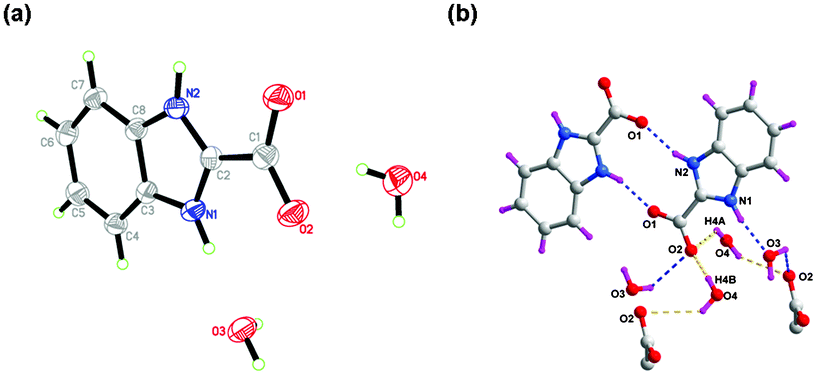 |
| | Fig. 1 (a) Perspective view of H2BIC·2H2O. (b) The intermolecular H-bonding interactions in H2BIC·2H2O. | |
Table 1 Crystal data and structure refinement summary for H2BIC·2H2O and compounds 1–5
| |
H2BIC·2H2O |
1
|
2
|
3
|
4
|
5
|
|
R
1 = ∑||Fo| − |Fc||/∑|Fo|.
wR2 = [∑w(Fo2 − Fc2)2/∑w[(Fo2)2]1/2.
|
| Empirical formula |
C8H10N2O4 |
C24H15N6O6Eu |
C24H15N6O6Tb |
C24H15N6O6Gd |
C24H15N6O6Pr |
C24H15N6O6Nd |
| Formula weight |
198.18 |
635.38 |
642.34 |
640.67 |
624.33 |
627.66 |
| Crystal system |
Monoclinic |
Monoclinic |
Monoclinic |
Monoclinic |
Monoclinic |
Monoclinic |
| Space group |
P21/c |
P21/n |
P21/n |
P21/n |
P21/n |
P21/n |
|
a (Å) |
6.860(2) |
9.7575(10) |
9.7089(14) |
9.7434(11) |
9.8425(7) |
9.853(2) |
|
b (Å) |
7.368(2) |
8.9776(9) |
8.9276(13) |
8.9656(10) |
9.0698(7) |
9.073(2 |
|
c (Å) |
18.967(5) |
26.005(3) |
25.930(4) |
26.000(3) |
26.084(2) |
26.152(6) |
|
α (°) |
90 |
90 |
90 |
90 |
90 |
90 |
|
β (°) |
109.738(9) |
91.113(1) |
91.090(2) |
91.179(2) |
91.216(1) |
91.153(4) |
|
γ (°) |
90 |
90 |
90 |
90 |
90 |
90 |
|
V (Å3) |
902.4(4) |
2277.5(4) |
2247.1(6) |
2270.8(4) |
2327.9(3) |
2337.3(10) |
|
Z
|
4 |
4 |
4 |
4 |
4 |
4 |
|
D
c (g cm−3) |
1.459 |
1.853 |
1.899 |
1.874 |
1.781 |
1.784 |
|
T (K) |
296(2) |
296(2) |
296(2) |
296(2) |
296(2) |
296(2) |
|
μ (mm−1) |
0.119 |
2.810 |
3.204 |
2.977 |
2.147 |
2.276 |
|
F(000) |
416 |
1248 |
1256 |
1252 |
1232 |
1236 |
| Reflections collected/unique |
4373/1596 |
11![[thin space (1/6-em)]](https://www.rsc.org/images/entities/char_2009.gif) 759/4461 759/4461 |
10![[thin space (1/6-em)]](https://www.rsc.org/images/entities/char_2009.gif) 687/3983 687/3983 |
11![[thin space (1/6-em)]](https://www.rsc.org/images/entities/char_2009.gif) 088/4012 088/4012 |
11![[thin space (1/6-em)]](https://www.rsc.org/images/entities/char_2009.gif) 382/4131 382/4131 |
11![[thin space (1/6-em)]](https://www.rsc.org/images/entities/char_2009.gif) 228/4141 228/4141 |
|
R(int) |
0.0750 |
0.0316 |
0.0452 |
0.0535 |
0.0329 |
0.0716 |
| Data/restraints/parameters |
1596/0/127 |
4461/0/334 |
3983/0/334 |
4012/0/334 |
4131/0/338 |
4141/0/334 |
| GOF on F2 |
1.015 |
1.097 |
1.066 |
1.033 |
1.037 |
1.009 |
|
R
1
[I > 2σ(I)] |
0.0696 |
0.0250 |
0.0410 |
0.0373 |
0.0290 |
0.0549 |
| wR2b (all data) |
0.2105 |
0.0785 |
0.1021 |
0.0774 |
0.0661 |
0.1249 |
Synthesis of [Eu(HBIC)3]n (1)
A mixture of EuCl3·6H2O (0.0366 g, 0.1 mmol), H2BIC (0.0162 g, 0.1 mmol), NaOH (0.0040 g, 0.1 mmol) and NaN3 (0.0065 g, 0.1 mmol) was dissolved in 6 mL distilled water. The resulting solution was stirred for about 30 min at room temperature, sealed in a 10 mL Teflon-lined stainless steel autoclave, and heated at 110 °C for 3 days under autogenous pressure. The reaction system was then cooled to room temperature at a rate of 5 °C h−1. Colorless flaky crystals of 1 were collected in 48% yield (based on Eu). Anal. Calcd. for C24H15EuN6O6 (Mr = 635.38): C, 45.37 H, 2.38 N, 13.23. Found: C, 45.81 H, 2.64 N, 12.99%. IR (KBr, v/cm−1): 3141(br, m), 1652(s), 1616(s), 1521(m), 1497(m), 1466(s), 1398(s), 1331(s), 1299(m), 1228(w), 1027(w), 988(w), 849(m), 821(m), 779(w), 739(s), 631(m), 580(m).
Synthesis of [Tb(HBIC)3]n (2)
An identical procedure with 1 was followed to prepare 2 except EuCl3·6H2O was replaced by TbCl3·6H2O (0.0374 g, 0.1 mmol) or Tb2(SO4)3·6H2O (0.0357 g, 0.05 mmol). Colorless flaky crystals of 2 were collected in 54% yield (based on Tb). Anal. Calcd. for C24H15TbN6O6 (Mr = 642.35): C, 44.88 H, 2.35 N, 13.08. Found: C, 44.61 H, 2.58 N, 13.01%. IR (KBr, v/cm−1): 3128(br, m), 1650(s), 1611(s), 1528(m), 1499(m), 1467(s), 1399(s), 1335(s), 1308(m), 1235(w), 1025(w), 987(w), 860(m), 825(m), 777(w), 748(s), 638(m), 584(m).
Synthesis of [Gd(HBIC)3]n (3)
An identical procedure with 1 was followed to prepare 3 except EuCl3·6H2O was replaced by GdCl3·6H2O (0.0372 g, 0.1 mmol). Colorless flaky crystals of 3 were collected in 61% yield (based on Gd). Anal. Calcd. for C24H15GdN6O6 (Mr = 640.67): C, 44.99 H, 2.36 N, 13.12. Found: C, 45.21 H, 2.88 N, 12.92%. IR (KBr, v/cm−1): 3137(br, m), 1653(s), 1606(s), 1525(m), 1491(m), 1461(s), 1398(s), 1329(s), 1300(m), 1231(w), 1020(w), 986(w), 858(m), 820(m), 776(w), 743(s), 633(m), 585(m).
Synthesis of [Pr(HBIC)3]n (4)
An identical procedure with 1 was followed to prepare 4 except EuCl3·6H2O was replaced by Pr(NO3)3·6H2O (0.0435 g, 0.1 mmol) or PrCl3·6H2O (0.0355 g, 0.1 mmol). Light-green flaky crystals of 4 were collected in 33% yield (based on Pr). Anal. Calcd. for C24H15PrN6O6 (Mr = 624.33): C, 46.17 H, 2.42 N, 13.46. Found: C, 46.67 H, 2.50 N, 13.98%. IR (KBr, v/cm−1): 3133(br, m), 1657(s), 1609(s), 1531(m), 1500(m), 1463(s), 1401(s), 1325(s), 1302(m), 1238(w), 1027(w), 990(w), 854(m), 822(m), 779(w), 741(s), 635(m), 581(m).
Synthesis of [Nd(HBIC)3]n (5)
An identical procedure with 1 was followed to prepare 5 except EuCl3·6H2O was replaced by Nd(NO3)3·6H2O (0.0438 g, 0.1 mmol). Light-purple flaky crystals of 5 were collected in 39% yield (based on Nd). Anal. Calcd. for C24H15NdN6O6 (Mr = 627.66): C, 45.93 H, 2.41 N, 13.39. Found: C, 45.51 H, 2.44 N, 13.11%. IR (KBr, v/cm−1): 3132(br, m), 1652(s), 1604(s), 1528(m), 1489(m), 1466(s), 1402(s), 1330(s), 1303(m), 1238(w), 1029(w), 988(w), 851(m), 823(m), 779(w), 741(s), 634(m), 580(m).
X-ray crystallography
Single-crystal X-ray diffraction data for H2BIC·2H2O and compounds 1–5 were collected on a Bruker SMART APEXII CCD diffractometer, equipped with graphite-monochromatized Mo Kα radiation (λ = 0.71073 Å) using ω and φ scan mode. All the structures were solved by direct methods and refined with full-matrix least-squares refinements based on F2 using SHELXS-97 and SHELXL-97.11 All non-hydrogen atoms were refined anisotropically. Hydrogen atoms were placed in geometrically calculated positions. The detailed crystallographic data and the structure refinement parameters of H2BIC·2H2O and1–5 are listed in Table 1. Selected bond distances, angles and hydrogen bonds are given in Tables S1 and S2 (see ESI†).
Results and discussion
Synthesis
As well known, the hydro/solvothermal method used to be a non-ignorable “hero” in the preparation of metal–organic coordination frameworks with fascinating architectures and function. It gives a more convenient and effective route to synthesize high-quality single crystals of MOFs over other methods.12 However, because of the limitation of unintuitive reaction phenomenon and hard-to-monitor reaction process, the research on the complex mechanism of reaction process in the reaction vessel is still in the primary exploration phase at present, and many possible mechanisms could only be deduced by the intuitive results. Therefore, according to the reaction conditions and results of isolating 1–5, it is not difficult to find that the different anions of lanthanide salts (Cl−, SO42− or NO3−) have no effects on the formation of 1–5. Moreover, it should be noted that the presence of a molar equivalent of NaN3 as the structure-directing agent was a prerequisite for the preparation of 1–5.
Structural description
Fig. 1a depicts that the ligand 1H-benzimidazole-2-carboxylic acid crystallizes as the dihydrate, and the organic molecule exists in a zwitterionic form with the carboxyl group deprotonated and the benzimidazole group protonated,10d which has a significant advantage for the formation of abundant hydrogen bonds. As shown in Fig. 1b, both the benzimidazole N atoms are involved in forming hydrogen bonds as donors: one gives N2–H2⋯O1 hydrogen bonds to connect two parallel adjacent 1H-benzimidazole-2-carboxylate molecules, yielding a centro-symmetric hydrogen-bond motif R22(10); and the other N atom (N1) is attracted by O3 from a lattice water molecule to give a intermolecular N1–H1⋯O3 hydrogen bond. Notably, the carboxyl O atom (O2) exhibits a three-connected hydrogen-bond motif, in which O2 is employed as accepter to form three kinds of different hydrogen bonds with lattice water molecules (Table S2, ESI†). In the crystal, molecules are packed into a three-dimensional network (Fig. 2a) via these hydrogen bonds and two distinct π–π stacking interactions between the benzimidazole groups of adjacent molecules [centroid–centroid distances = 3.7602(10) and 3.6135(10) Å] (Fig. 2b). It is of interest to note that a helical chain generated by the hydrogen-bond interactions between carboxyl oxygen atoms (O2) and lattice water molecules is observed (Fig. 2c).
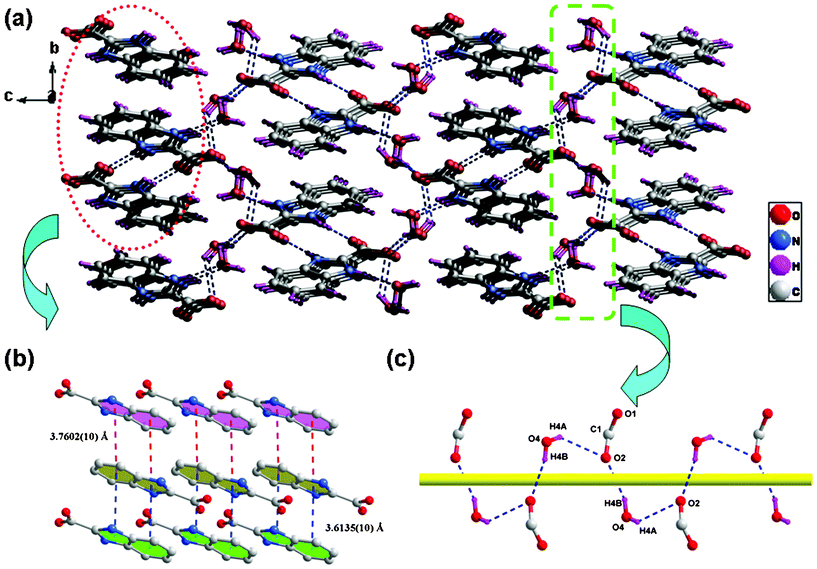 |
| | Fig. 2 (a) 3D supramolecular network of H2BIC·2H2O formed by intermolecular hydrogen-bonding and π–π stacking interactions. (b) The two distinct π–π stacking interactions in H2BIC·2H2O. (c) Helical chain structure generated by the hydrogen-bond interactions between carboxyl oxygen atoms and lattice water molecules. | |
X-ray analyses performed on single crystals of compounds 1–5 reveal an isostructural mode possessing one 2D wave-like layer structure with distorted grids. Hence, only the structure of 1 is described in detail. Compound 1 crystallizes in the monoclinic space group P21/n, and the asymmetric unit consists of one crystallographically independent Eu3+ ion and three HBIC− ligands. As illustrated in Fig. 3a, the central Eu3+ cation is eight-coordinated by five carboxyl oxygen atoms (O1, O3–O6) and three nitrogen atoms (N1, N3 and N5) from five HBIC− ligands, resulting in a distorted bicapped triangle prism coordination geometry (Fig. 3b). The Eu–O bond distances range from 2.338(3) to 2.487(3) Å with the mean of 2.415(3) Å, which is slightly shorter than the average Eu–N distance, 2.549(3) Å. The average O–Eu–O bond angle is 105.56(10)°, similar to that of N–Eu–N [105.43(10)°], but much lager than the mean O–Eu–N bond angle value, 94.87(11)°. All of the bond lengths and angles in 1 are within normal ranges and comparable with those observed in other reported Eu3+-carboxylates (Table S1, ESI†).13
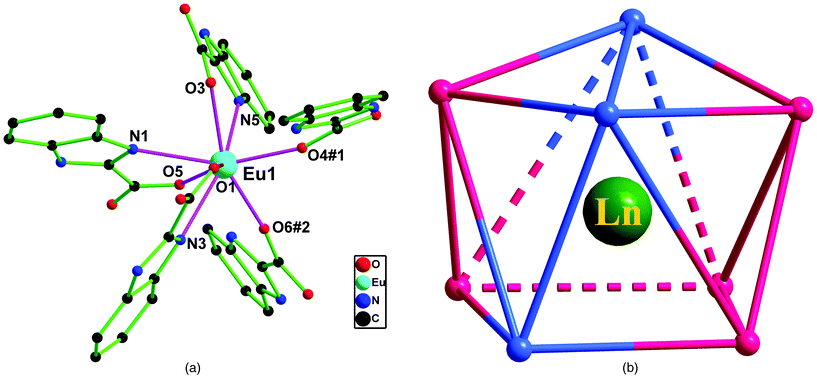 |
| | Fig. 3 (a) Coordination environment of Eu3+ in 1, H atoms are omitted for clarity. Symmetry code: #1, 1/2 − x, −1/2 + y, 1/2 − z; #2, 3/2 − x, −1/2 + y, 1/2 − z. (b) Coordination polyhedron geometry of Ln3+ in 1–5. | |
Due to the effect of lanthanide contraction, the Ln3+ ions radii are very close [Shannon's ionic radii of Ln3+ in 1–5: 1.126 Å (Pr3+), 1.109 Å (Nd3+), 1.066 Å (Eu3+), 1.053 Å (Gd3+), and 1.04 Å (Tb3+)]. Comparing the geometries of isomorphic 1–5 (Table 2), it is evident to find out that the differences on the Ln–O/N bond lengths and correlative bond angles are very subtle, and the variation of some geometry in 1–5 shows dependency on the respective Shannon's effective ionic radii. For example, the average length of Ln–O decreases along with reducing of the Ln3+ radii (Ln–O: Pr3+ > Nd3+ > Eu3+ > Gd3+ > Tb3+), and the average bond angle of N–Ln–N increases accordantly with the Ln3+ radii increasing (∠N–Ln–N: Pr3+ < Nd3+ < Eu3+ < Gd3+ < Tb3+). However, because the final formation of lanthanide compounds may be influenced by many complicated factors, not all the geometry variations in 1–5 are in line with the consistent tendency, there are also some exceptions. The average lengths of Ln–N in these compounds are 2.618(7), 2.549(3), 2.541(5) and 2.526(5) Å for compounds 5, 1, 3 and 2, steadily decreasing from Nd3+ to Tb3+, respectively. Yet the average Pr–N distance [2.612(3) Å] is shorter than the average Nd–N length, which is not in good agreement with the radii of the two Ln3+ ions. Meanwhile, the situation of average O–Ln–N bond angle is similar: ∠O–Pr–N [94.78(9)°] < ∠O–Nd–N [94.79(6)°] < ∠O–Eu–N [94.87(11)°] < ∠O–Tb–N [94.87(16)°], just ∠O–Gd–N [94.90(13)°] > ∠O–Tb–N [94.87(16)°], while the average O–Ln–O bond angles in 1–5 seemingly look random in the changing tendency: ∠O–Nd–O [105.66(5)°] > ∠O–Pr–O [105.65(8)°] > ∠O–Tb–O [105.57(15)°] > ∠O–Eu–O [105.56(10)°] > ∠O–Gd–O [105.51(12)°].
Table 2 The geometry comparison for compounds 1–5
| |
1 (Eu3+) |
2 (Tb3+) |
3 (Gd3+) |
4 (Pr3+) |
5 (Nd3+) |
|
Range of bond length or bond angle.
Average bond length or bond angle.
|
| Ln–Oa (Å) |
2.338(3)–2.487(3) |
2.318(4)–2.467(4) |
2.326(4)–2.480(4) |
2.376(3)–2.524(3) |
2.370(5)–2.522(5) |
| Ln–Ob (Å) |
2.415(3) |
2.394(4) |
2.405(4) |
2.455(2) |
2.451(5) |
| Ln–Na (Å) |
2.519(3)–2.567(3) |
2.493(6)–2.546(5) |
2.514(5)–2.557(5) |
2.593(3)–2.631(3) |
2.586(7)–2.656(7) |
| Ln–Nb (Å) |
2.549(3) |
2.526(5) |
2.541(5) |
2.612(3) |
2.618(7) |
| O–Ln–Oa (°) |
70.63(9)–157.00(10) |
70.36(15)–157.36(16) |
70.70(12)–156.80(14) |
70.64(8)–157.05(9) |
70.48(19)–157.2(2) |
| O–Ln–Ob (°) |
105.56(10) |
105.57(15) |
105.51(12) |
105.65(8) |
105.66(5) |
| O–Ln–Na (°) |
63.63(9)–152.20(11) |
63.99(16)–152.26(16) |
64.09(13)–152.23(13) |
63.14(9)–152.29(9) |
62.97(19)–152.5(2) |
| O–Ln–Nb (°) |
94.87(11) |
94.87(16) |
94.90(13) |
94.78(9) |
94.79(6) |
| N–Ln–Na (°) |
70.80(11)–152.32(11) |
71.00(18)–152.56(18) |
70.67(16)–152.53(15) |
70.02(10)–151.46(10) |
70.2(2)–151.7(2) |
| N–Ln–Nb (°) |
105.43(10) |
105.67(17) |
105.60(15) |
104.53(10) |
104.76(6) |
| Grid size (Å × Å) |
6.9561(5) × 6.7012(5) |
6.9219(8) × 6.6662(8) |
6.9443(7) × 6.6949(6) |
7.0167(4) × 6.7600(4) |
7.0234(12) × 6.7663(11) |
In compound 1, all H2BIC ligands are present in the mono-deprotonated form, HBIC−. Two kinds of new coordination modes of HBIC− (Modes I and II in Scheme 1) are first observed. One is the HBIC− ligand chelating one Eu3+ center with one carboxyl oxygen atom and one imidazole nitrogen atom first, and the other carboxyl oxygen atom further bridges another Eu3+ ion, leading to a chelating-bridging μ2-κN, O: κO coordination fashion (Mode I); the other is the HBIC− ligand chelating the Eu3+ center with a simple μ1-κN, O coordination fashion (Mode II). The adjacent Eu3+ centers are bridged by the HBIC− ligands in Mode I into 1D infinite chains (Fig. 4), and these chains are further interweaved each other, generating a 2D wave-like layered structure in the ab plane (Fig. 5a). In this 2D network, each Eu3+ center is coordinated by four HBIC− ligands in Mode I, and the remaining two sites are occupied by another HBIC− ligand in Mode II. From the viewpoint of network topology, the structure of 1 can be simplified as a four-connected 2D (4,4) network with the Eu3+ ions as nodes (Fig. 5b), in which each distorted grid has a size of 6.7012(5) Å × 6.9561(5) Å, slight larger than those in compounds 2 [6.9219(8) × 6.6662(8)] and 3 [6.9443(7) × 6.6949(6)], and smaller than those in compounds 4 [7.0167(4) × 6.7600(4)] and 5 [7.0234(12) × 6.7663(11)] (Table 2).
 |
| | Fig. 4 1D infinite chain structure in compound 1. | |
 |
| | Fig. 5 (a) A wave-like 2D network in compound 1, H atoms are omitted for clarity. (b) A schematic view of the topology framework of 1. | |
It is worth mentioning that the deprotonated carboxylate and protonated benzimidazole N atom of the HBIC− ligand make the amphoteric HBIC− ligand a good candidate to be involved in the construction of strong hydrogen bonds as a donor or acceptor. As can be seen from Fig. 6a, each grid in the 2D layer is formed by four HBIC− ligands bridging four Eu3+ centers with Mode I, and the grid is further twisted by two types of distinct intra-layer hydrogen bonds [N2–H2⋯O5#1 = 2.718(4) Å and N6–H6⋯O1#2 = 2.782(4) Å. Symmetry code: #1, −x + 3/2, y + 1/2,−z + 1/2; #2 −x + 1/2, y + 1/2, −z + 1/2], where the adjacent HBIC− ligands are tightly bound together like the bis(chelating)-bridging oxalate, thus resulting in a wave-like 2D layer. Moreover, the HBIC− ligands with Mode II are arranged face to face between two adjacent layers, and the exposed carboxylic O atoms and H atoms participate in constructing the strong inter-layer hydrogen bond R22(10) ring motifs [N4–H4⋯O2#3 = 2.824(5) Å, #3: −x + 1, −y + 1, −z] (Fig. 6b), which finally bridges the adjacent layers into a 3D supramolecular architecture (Fig. 6c).
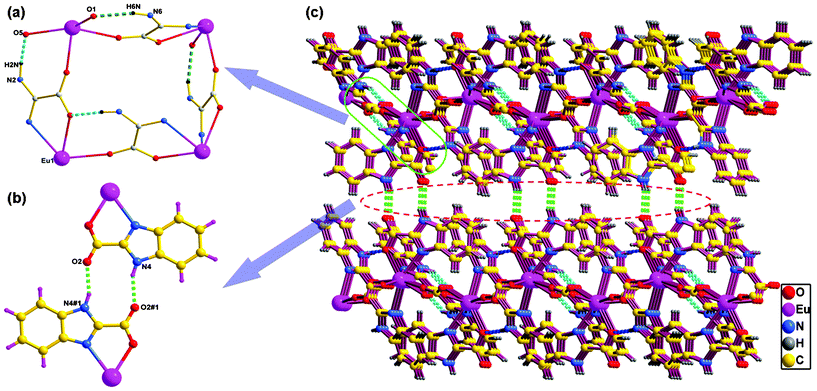 |
| | Fig. 6 (a) Intra-layer hydrogen-bonding interactions in 1, the benzene rings of the benzimidazole groups are omitted for clarity. (b) Inter-layer hydrogen-bonding interactions in 1. (c) 3D supramolecular architecture assembled via intra-layer and inter-layer hydrogen bonds in 1, where pink and green dashed lines denote intra-layer and inter-layer hydrogen-bonding interactions, respectively. | |
Thermal analysis
To examine the thermal stability of 1–5, the thermogravimetric analyses for crystal samples of 1–5 were performed under a simulated air atmosphere with a heating rate of 10 °C min−1 from ambient temperature up to 1000 °C. As shown in Fig. S3, ESI,† TG analyses indicate that all these compounds have high thermal stability and exhibit similar thermal behavior due to their isostructural nature. Herein, only the thermal stability of 1 was taken as a representative example for discussion. The TG curve depicted in Fig. 7 reveals that 1 remains stable up to 354.7 °C, which could be ascribed to the abundant intra-layer and inter-layer hydrogen bonds occurring in framework 1. Then the compound experiences almost one-step weight loss of 71.85% from 354.7 to 528.3 °C, which is attributed to the thermal decomposition of the organic components. The final mass of the residue is 28.15% of the initial weight, which agrees well with that expected value for the formation of a stoichiometric quantity of Eu2O3 (calcd. 27.69%). The end product was identified as the body-centered cubic Eu2O3 by PXRD (Fig. S4, ESI;† JCPDS NO. 34-0392).
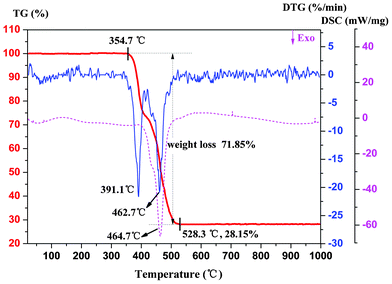 |
| | Fig. 7 TG-DTG-DSC curves of compound 1 with a heating rate of 10 °C min−1. | |
The DTG curve for 1 shows that the whole process of weight loss consists of two sequential thermal decomposition processes, and the sharp peaks located at 391.1 °C and 462.7 °C, respectively, represent the fastest decomposition of the two processes, which may caused by the two distinct binding fashions between Eu3+ ions with ligands in 1. In addition, the broad exothermic peak of the DSC curve shows that the compound decomposes with a large heat of 7002 J g−1.
The DSC experiments were also carried out from room temperature to 1000 °C under a simulated air atmosphere to investigate the heat variation of the lanthanide compound system. As illustrated in Fig. 8, the DSC curves of 1–5 are similar, and each of them shows a broad downward band with two consecutive exothermic peaks, corresponding to the two sequential thermal decomposition processes. There are also some significant differences on the heat release and the decomposition peak temperature. As can be seen from Fig. 8, all the five compounds display high heats, the maximum 2 (7697 J g−1) outputs about 1330 J g−1 more than the minimum 5 (6361 J g−1). Correspondingly, the greatest decomposition peak temperature occurred in 2 (480.6 °C) is approximately 25 °C higher than that in 5 (454.4 °C). It should be noted that the variation tendency of both heat release and decomposition peak temperature are consistent with that of the average Ln–N/O lengths, that is, the decomposition heat and peak temperature decrease with the increase of average Ln–N/O lengths. This finding confirms that the shorter distance between Ln3+ ion and O/N atom, the greater the heat yielded by thermo-decomposition.
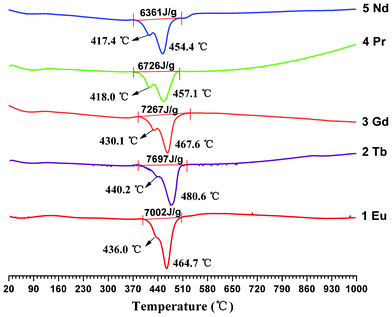 |
| | Fig. 8 DSC plots of compounds 1–5 with a heating rate of 10 °C min−1. | |
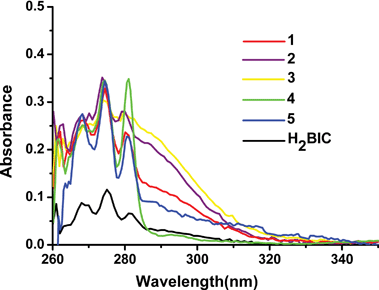 |
| | Fig. 9 UV-vis absorption spectra of H2BIC and compounds 1–5 in DMSO solution (2 × 10⁻⁵ M). | |
Energy transfer between the H2BIC ligand and Ln3+ (Ln = Eu, Tb)
For lanthanide coordination compounds, the trivalent lanthanide ion luminescence generally needs to be stimulated by a strong chromophore ligand via the “antenna effect”, and the details can be described as the following steps: the chromophore ligand is first excited from ground state into the first excited singlet state due to the UV absorption, immediately nonradiative intersystem crossing of the ligand from the singlet to the triplet state occurs; and the intramolecular energy is further transferred from the ligand-centered triplet state to the excited 4f states of lanthanide ion, followed by internal conversion to the lower emitting states simultaneously; finally, the characteristic lanthanide emission is generated by the radiative transition from the lanthanide ion emissive states to the lower different energy states.14 So it can be seen that the intramolecular energy migration efficiency from the organic ligand to the central Ln3+ ions plays a key role in the luminescence property of the lanthanide coordination compound.
The choice of a suitable sensitizer is very important. According to Reinhoudt's empirical rule, the intersystem crossing process becomes effective when energy gap ΔE [singlet energy level (1ππ*) – triplet energy level (3ππ*)] is at least 5000 cm−1.15 Thus, the singlet and triplet energy levels of the H2BIC ligand should be firstly determined. The 1ππ* of H2BIC is estimated by reference to the wavelength of the UV-vis higher absorption edge of Gd3+ compound 3, and the pertinent value is 286 nm (34![[thin space (1/6-em)]](https://www.rsc.org/images/entities/char_2009.gif) 965 cm−1) (see Fig. 9). Because the first excited state of Gd3+ (about 32
965 cm−1) (see Fig. 9). Because the first excited state of Gd3+ (about 32![[thin space (1/6-em)]](https://www.rsc.org/images/entities/char_2009.gif) 000 cm−1), 6P7/2, is too high to accept any energy from the first excited triplet state of the ligand through intramolecular ligand-to-metal energy transfer, the phosphorescence spectrum of the corresponding Gd3+ compound could actually reveal the triplet energy level of the ligand.16 As shown in Fig. S5, ESI,† the triplet energy level (3ππ* = 24
000 cm−1), 6P7/2, is too high to accept any energy from the first excited triplet state of the ligand through intramolecular ligand-to-metal energy transfer, the phosphorescence spectrum of the corresponding Gd3+ compound could actually reveal the triplet energy level of the ligand.16 As shown in Fig. S5, ESI,† the triplet energy level (3ππ* = 24![[thin space (1/6-em)]](https://www.rsc.org/images/entities/char_2009.gif) 630 cm−1) of H2BIC is determined by the lower wavelength emission edge (406 nm) from the low-temperature phosphorescence spectrum of the Gd3+ compound 3.
630 cm−1) of H2BIC is determined by the lower wavelength emission edge (406 nm) from the low-temperature phosphorescence spectrum of the Gd3+ compound 3.
Fig. 10 shows the diverse energy-level states of H2BIC, Eu3+ and Tb3+ and possible energy transfer pathways among them. The energy gap for the H2BIC ligand ΔE (1ππ* − 3ππ* = 10![[thin space (1/6-em)]](https://www.rsc.org/images/entities/char_2009.gif) 335 cm−1) is significantly higher than 5000 cm−1, which suggests that the intersystem crossing process is effective for the H2BIC ligand.15,17 Further, the triplet energy level of H2BIC is also obviously higher than the 5D0 level of Eu3+ (17
335 cm−1) is significantly higher than 5000 cm−1, which suggests that the intersystem crossing process is effective for the H2BIC ligand.15,17 Further, the triplet energy level of H2BIC is also obviously higher than the 5D0 level of Eu3+ (17![[thin space (1/6-em)]](https://www.rsc.org/images/entities/char_2009.gif) 300 cm−1) and 5D4 level of Tb3+ (20
300 cm−1) and 5D4 level of Tb3+ (20![[thin space (1/6-em)]](https://www.rsc.org/images/entities/char_2009.gif) 500 cm−1), giving rise to an advantageous energy-transfer condition in 1 or 2. Of course, this does not mean that the higher the better, and the energy gap between the lowest triplet state of the H2BIC ligand and the 5D0 state (Eu3+) or the 5D4 state (Tb3+) must be appropriate. The gap may be too large or too small to get satisfactory luminescence efficiency; a large gap always yields an inefficient energy transfer and a small gap is beneficial to a back-energy transfer.18 Latva's empirical rule states that an optimal ligand-to-metal energy transfer process for Ln3+ requires ΔE (3ππ* − 5DJ) = 2500–4000 cm−1 for Eu3+ and 2500–4500 cm−1 for Tb3+.19 Given that the energy gap between the triplet state and 5D0 state of Eu3+ is 7330 cm−1, the H2BIC ligand is not in an ideal situation for the sensitization of Eu3+ luminescence. Whereas the energy gap between the triplet state and 5D4 state of Tb3+ is 4130 cm−1, suggesting that the H2BIC ligand could strongly sensitize Tb3+ emission in 2.
500 cm−1), giving rise to an advantageous energy-transfer condition in 1 or 2. Of course, this does not mean that the higher the better, and the energy gap between the lowest triplet state of the H2BIC ligand and the 5D0 state (Eu3+) or the 5D4 state (Tb3+) must be appropriate. The gap may be too large or too small to get satisfactory luminescence efficiency; a large gap always yields an inefficient energy transfer and a small gap is beneficial to a back-energy transfer.18 Latva's empirical rule states that an optimal ligand-to-metal energy transfer process for Ln3+ requires ΔE (3ππ* − 5DJ) = 2500–4000 cm−1 for Eu3+ and 2500–4500 cm−1 for Tb3+.19 Given that the energy gap between the triplet state and 5D0 state of Eu3+ is 7330 cm−1, the H2BIC ligand is not in an ideal situation for the sensitization of Eu3+ luminescence. Whereas the energy gap between the triplet state and 5D4 state of Tb3+ is 4130 cm−1, suggesting that the H2BIC ligand could strongly sensitize Tb3+ emission in 2.
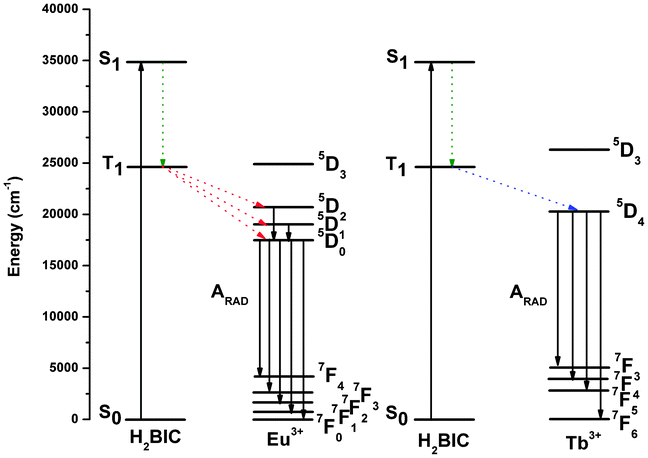 |
| | Fig. 10 Schematic energy level diagrams and energy transfer mechanisms for compounds 1 and 2. S1 represents the first excited singlet state and T1 represents the first excited triplet state. | |
Photophysical property
Photoluminescence properties of 1 and 2
Considering that the H2BIC ligand is an adequate light-harvesting chromophore, and expected to be used for sensitizing lanthanide ion luminescence. The solid-state luminescence properties of 1–2 were studied at room temperature. The solid-state excitation and emission spectra of the Eu3+ compound 1 recorded at room temperature are displayed in Fig. 11. The excitation spectrum (Fig. 11a) monitored around the intense 5D0 → 7F2 transition of the Eu3+ exhibits a broad and relatively weak band between 250 and 350 nm (λmax = 331 nm), which can be assigned to the π–π* electronic transition of the H2BIC ligand. A series of sharp characteristic f–f transitions of the Eu3+ at 361 (7F0 → 5G6), 380 (7F0 → 5H4) and 394 nm (7F0,1 → 5L6) are also evident, which can be reasonably assigned to the transitions between the 7F0,1 and the 5L6 and 5D2,1 levels.20 The more intense 4f absorption of Eu3+ suggests that the luminescence sensitization via excitation of the H2BIC ligand is not very promising in 1.
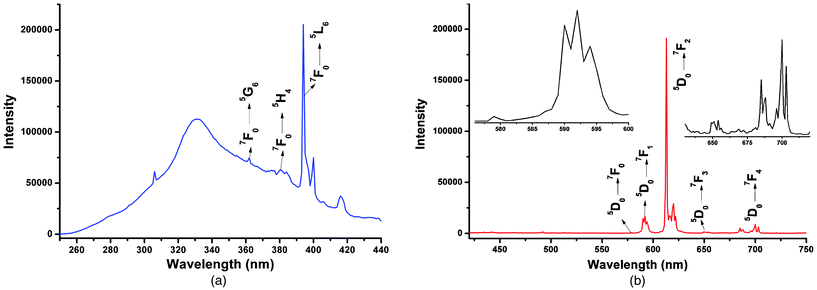 |
| | Fig. 11 Room-temperature excitation (a) and emission (b) spectra for 1 (λex = 394 nm) with emissions monitored at approximately 613 nm. | |
Under excitation at 394 nm, the ambient temperature emission spectrum of 1 displays characteristic sharp emission bands of Eu3+ in the spectral range of 570–750 nm. As shown in Fig. 11b, the five anticipated transitions from the excited 5D0 state to the 7FJ ground-state multiplet are well resolved, that is, 5D0 → 7F0 at 579 nm, 5D0 → 7F1 at 593 nm, 5D0 → 7F2 at 613 nm, 5D0 → 7F3 at 654 nm, and 5D0 → 7F4 at 700 nm.20a,20b,21 Compared with others, the maximum intensities at 579 and 654 nm are much weaker, because their corresponding 5D0 → 7F0 and 5D0 → 7F3 transitions are both strictly forbidden in magnetic and electric dipole schemes.14c,21c The 5D0 → 7F1 transition is relatively stronger, which is a magnetic dipole. The 5D0 → 7F0 and 5D0 → 7F1 transitions consist of only one peak at 579 nm and three split peaks at 593 nm, respectively, which suggests the existence of a single chemical environment around the Eu3+ ion in 1.16a,22 It is clear that the hypersensitive 5D0 → 7F2 transition (electric dipole) shows the highest intensity at 613 nm, pointing to a highly polarizable chemical environment around the Eu3+ ion. The luminescent intensity ratio of the (5D0 → 7F2)/(5D0 → 7F1) is 11.53, which indicates that compound 1 exhibits bright red light emission and the Eu3+ ion in it is not located in a site with inversion center symmetry.23
Fig. 12 summarizes the room-temperature excitation and emission spectra of Tb3+ compound 2 in the solid state. The excitation spectrum of 2 (Fig. 12a) monitored around the hypersensitive 5D4 → 7F5 transition (545 nm) of Tb3+ reveals a broad band between 280 and 350 nm with a maximum at approximately 333 nm, which can be attributable to the π–π* electronic transition of the H2BIC ligand. Because this broad band overlaps the absorption spectrum of the H2BIC ligand in the region of 280–350 nm, the energy transfer from the ligand to Tb3+ is operative. In addition, a series of faint f–f transitions 7F5 → 5L9 (359 nm), 7F5 → 5L10 (369 nm) and 7F5 → 5G6 (378 nm) are also observed in the excitation spectrum of 2,24 which are much weaker than the absorptions owing to the organic ligands. Apparently, luminescence sensitization via ligand excitation is significantly more efficient than the direct excitation of the Tb3+ absorption level.
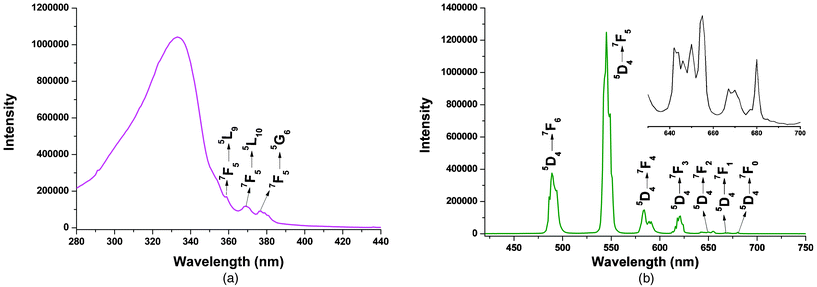 |
| | Fig. 12 Room-temperature excitation (a) and emission (b) spectra for 2 (λex = 333 nm) with emissions monitored at approximately 545 nm. | |
Being excited by UV light (λex = 333 nm), the solid-state emission spectrum of 2 recorded at room temperature (Fig. 12b) exhibits the characteristic narrow emission bands of Tb3+, which results from deactivation of the 5D4 excited state to the corresponding ground state 7FJ (J = 6, 5, 4, 3) of the Tb3+ ion centered at 489, 545, 584, and 621 nm.20a–d The most intense emission centered at 545 nm represents the hypersensitive 5D4 → 7F5 transition, which shows the strongest green emission of 2. Furthermore, the emission band from the H2BIC ligand is not detected, implying efficient energy transfer from the ligand to the central Tb3+ ion in 2, which is further confirmed by the very high emission intensity of Tb3+.
For a deeper research on the photophysical behaviors of the compounds 1–2, the lifetime values for the 5D0 level of 1 and 5D4 level of 2 (τobs) were measured at ambient temperature based on the corresponding luminescent decay profiles by fitting with monoexponential functions (Fig. S6 and S7, ESI†), and the relevant values are summarized in Table 3. The typical decay profiles indicate that single chemical environments exist around the emitting Eu3+/Tb3+ ions. The ideal luminescence lifetimes for 1 (0.952 ms) and 2 (1.207 ms) could be due to the strong chelating coordination ability and rational steric stabilization of the HBIC− ligand, which effectively prevented the solvent guest molecules from entering the coordination sphere of the lanthanide ion and greatly reduced the energy loss caused by the O–H vibrations.
Table 3 The radiative (ARAD) and nonradiative (ANR) decay rates, 5D0/5D4 lifetime (τobs), intrinsic quantum yield (ΦLn), radiative lifetimes (τRAD), energy transfer efficiency (Φsen), and overall quantum yield (Φoverall) for compounds 1–2 in the solid state
| Photophysical parameters |
Compound 1 (Eu3+) |
Compound 2 (Tb3+) |
|
A
RAD (s−1) |
343 |
— |
|
A
NR (s−1) |
706 |
— |
|
τ
obs (μs) |
952 ± 1 |
1207 ± 1 |
|
τ
RAD (μs) |
2911 ± 1 |
1380 ± 1 |
|
Φ
Ln (%) |
33 |
87 |
|
Φ
sen (%) |
8 |
36 |
|
Φ
overall (%) |
2 ± 1 |
31 ± 3 |
In addition, to clearly explain the sensitization efficiency of the H2BIC ligand (Φsen), it should be necessary to determine the overall luminescence quantum yields (Φoverall) of 1 and 2 first. In compliance with the method described by Bril et al.,18b,25 the overall quantum yields of 1 and 2 were respectively estimated to be 2% and 31% through the following expression:
| |  | (1) |
where
rx and
rst represent the diffuse reflectance of the compounds (with respect to a fixed wavelength) and the standard phosphor, respectively (Fig. S8, ESI
†), and BaSO
4 was used as a reflecting standard to acquire absolute intensity values.
Ax and
Ast are the areas under the compounds and the standard emission spectra, respectively.
Φst is the quantum yield of the standard phosphor, peprylene (purchased from Aldrich), whose
emission spectrum consists of an intense broad band with a maximum at around 580 nm and a constant
Φ value (98%) for excitation wavelength at 436 nm.
26 The final calculated
Φoverall value for each sample was taken from the average of three measurement values, and the corresponding test errors were estimated to be ±10%.
25b,c
As is well-known, when the internal process in the system (usually treated as a “black box”) is not considered explicitly, the overall quantum yield (Φoverall) for a lanthanide compound can be defined as the product of the intrinsic quantum yield of Ln3+ ion (ΦLn) and the efficiency of energy transfer from the ligand to Ln3+ ion (Φsen),18a,27 which can be depicted as:
Hence, ΦLn can be used for calculating the sensitization efficiency of the ligand (Φsen). Eqn (3) shows the calculating formula of ΦLn, in which ARAD, ANR, τobs and τRAD correspond to the radiative decay rate, nonradiative decay rate, 5D0/5D4 lifetimes and radiative lifetimes, respectively.
| |  | (3) |
For Eu3+ compound 1, the ARAD, ANR and τRAD are finally calculated to be 343 s−1, 706 s−1 and 2911 μs viaeqn (4), here, the energy of the 5D0 → 7F1 transition (MD) and its oscillator strength are assumed to be constant, and AMD,0 (14.65 s−1) represents the spontaneous emission probability of the 5D0 → 7F1 transition in vacuo,6c,28n (1.5) is the average refractive index of the medium,14bITOT/IMD represents the ratio of the total area of the corrected Eu3+ emission spectrum to the area of the 5D0 → 7F1 band. Combined with the measured 5D0 lifetime value (952 μs), ΦEu of compound 1 is finally determined to be 33%.
| |  | (4) |
In comparison with the complicated measurement and calculation of Eu3+ compound 1, the intrinsic quantum yield of Tb3+ (ΦTb) in 2 can be directly estimated by means of eqn (5) using the assumption that the decay process at 77 K in deuterated solvents is purely radiative (Fig. S9, ESI†).29
| |  | (5) |
The correlative photophysical parameters of compounds 1–2 are presented in Table 3, the lower sensitization efficiency of the ligand (ηsen = 8%) in 1 indicates that the energy transfer from the first excited triplet state of ligand to the excited 5D0 level of Eu3+ is not an optimal process. It is also evident from Table 3 that the overall luminescence quantum yield of 2 is much higher than that of 1, though both of them have satisfactory luminescence lifetime. This could be due to the weak sensitization efficiency of the H2BIC ligand and smaller intrinsic quantum yield of the Eu3+ ion in 1. On the other hand, because of the smaller energy gap between the ligand triplet and Tb3+ ion excited states (4130 cm−1), the Tb3+ compound 2 exhibits good luminescence efficiency with a overall quantum yield of 31% in the solid state, thus rendering it as a promising candidate for use in various photonic applications.
In summary, the coordinated solvent molecules, the conjugation effect of chromophores and/or co-ligands, and the energy gap between the ligand triplet state and the lowest-lying excited state of Ln3+ ion play cooperative roles in the photoluminescence properties of Ln-MOFs, as evidenced by some monomeric Ln-MOFs (Table S3, ESI†).
Photoluminescence properties of 4 and 5
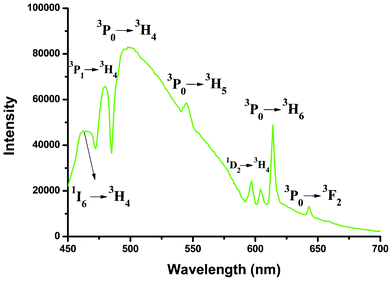
Compared with the extensively studied europium and terbium compounds, less effort has been devoted to the investigation of Nd3+/Pr3+-containing compounds. Actually, they also exhibit good luminescent properties in both visible and near-infrared (800–1400 nm) regions, and especially the advantages of signal transmittance of near-infrared radiation enable widespread application in areas such as laser systems, medical diagnosis and telecommunications.2c,30 Therefore, the photoluminescence properties of 4 and 5 were investigated in the solid state at room temperature. As shown in Fig. 13, compound 5 displays the characteristic emission bands of Nd3+ ion in the near-infrared region upon 354 nm radiation excitation: two moderate-intensity emission bands at 869 and 893 nm (4F3/2 → 4I9/2), a very strong emission band at 1060 nm (4F3/2 → 4I11/2), and a series of weak bands around 1329 nm (4F3/2 → 4I13/2). The splitting of the 4F3/2 → 4I9/2 transition band is mainly due to the “crystal field effect” of the Nd3+ ion located at a C1 site.31 The decay curves are well fitted with a monoexponential function. The lifetime of the excited 4F3/2 state of Nd3+ ion at room temperature for 5 was measured to be 1.21 μs (Fig. S11, ESI†). Because Pr3+ can show emission lines originating from three different levels (3P0, 1D2 and 1G4) which span the visible and NIR regions, the luminescence spectrum of Pr3+ compound is much more complex in comparison to that of other Ln3+ systems, leading to far fewer studies of Pr3+ emission spectra.32Fig. 14 depicts the room temperature emission spectrum of 4. Unlike 5, no characteristic emission bands of Pr3+ in the NIR region were detected, whereas compound 4 exhibits a series of characteristic emission bands for Pr3+ ion in the visible region with a 399 nm excitation source. The emissions at 462 and 479 nm can be respectively assigned to 1I6 → 3H4 and 3P1 → 3H4 transitions. A series of emission bands centered at approximately 499, 545, and 614 nm correspond to the 3P0 → 3HJ (J = 4, 5 and 6, respectively) transitions. The two peaks observed at 597 and 604 nm are attributed to the 1D2 → 3H4 transition, and the weak signal with a maxima at 643 nm can be referred to the 3P0 → 3F2 transition.33 All the observed transitions in Fig. 14 suggest that the triplet state of the H2BIC ligand is located in a suitable level and there is enough intramolecular energy transferred from the ligand-centered triplet state to the excited 1D2, 3P0, even the higher 3P1 and 1I6 levels. Therefore, the energy transfer from the H2BIC ligands to the Pr3+ ions is effective.
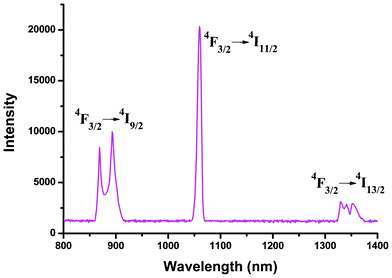 |
| | Fig. 13 Solid-state emission spectrum for 5 (λex = 354 nm) in the near-infrared region at room temperature. | |
Conclusions
In this paper, a series of lanthanide frameworks involving 1H-benzimidazole-2-carboxylic acid ligands (1–5) have been hydrothermally synthesized and structurally characterized for the first time. The isostructural compounds 1–5 exhibit 2D (4,4) networks with distorted grids constructed by zwitterionic HBIC− ligands with two kinds of unprecedented coordination modes. The thermal analyses indicate that their frameworks exhibit good thermal stability and release a large amount of heat during the decompositions. The detailed optical properties investigations reveal that: 1 and 2 exhibit remarkable lanthanide-centered luminescence emissions in the visible region showing luminescence lifetimes at millisecond order and intrinsic quantum yields of 33% and 87%, respectively; compound 5 emits strong characteristic luminescence in the near-infrared region. The results suggest that the strong chelating-bridging ligand HBIC−, which could efficiently occupy the first coordination sphere of the lanthanide ion, is an excellent chromophore for constructing luminescence materials. In addition, the more efficient energy migration [ΔE (3ππ* − 5D4) = 4130 cm−1] in 2 gives rise to a larger overall quantum yield of 31% over a poor value of 2% in 1, demonstrating that the suitable energy gap between the ligand triplet state and the lowest-lying excited state of Ln3+ ion plays a crucial role in the efficient sensitization of Ln3+ ion emission, and the HBIC− ligand is preferable for the sensitization of Tb3+-centered luminescence.
Acknowledgements
This work was supported by the National Natural Science Foundation of China (Nos. 21073142, 21173168 and 21127004), the Natural Science Foundation of the Department of Education of Shaanxi Province (Nos. 2010JK882, 2010JQ2007, 11JK0578 and 11JS110).
References
-
(a) F. N. Shi, L. Cunha-Silva, R. A. S. Ferreira, L. Mafra, T. Trindade, L. D. Carlos, F. A. A. Paz and J. Rocha, J. Am. Chem. Soc., 2008, 130, 150 CrossRef CAS;
(b) Z. Chen, B. Zhao, Y. Zhang, W. Shi and P. Cheng, Cryst. Growth Des., 2008, 8, 2291 CrossRef CAS;
(c) S. V. Eliseeva and J. C. G. Bünzli, Chem. Soc. Rev., 2010, 39, 189 RSC;
(d) A. de Bettencourt-Dias, Dalton Trans., 2007, 2229 RSC;
(e) V. Chandrasekhar, B. M. Pandian, R. Azhakar, J. J. Vittal and R. Clérac, Inorg. Chem., 2007, 46, 5140 CrossRef CAS;
(f) D. Parker, Coord. Chem. Rev., 2000, 205, 109 CrossRef CAS;
(g) M. N. Bochkarev, Chem. Rev., 2002, 102, 2089 CrossRef CAS.
-
(a) R. A. Poole, G. Bobba, M. J. Cann, J. C. Frias, D. Parker and R. D. Peacock, Org. Biomol. Chem., 2003, 1, 905 RSC;
(b) J. Kido and Y. Okamoto, Chem. Rev., 2002, 102, 2357 CrossRef CAS;
(c) J. C. G. Bünzli, Chem. Rev., 2010, 110, 2729 CrossRef;
(d) D. Y. Liu, K. Z. Tang, W. S. Liu, C. Y. Su, X. H. Yan, M. Y. Tan and Y. Tang, Dalton Trans., 2010, 39, 9763 RSC;
(e) B. Chen, L. Wang, Y. Xiao, F. R. Fronczek, M. Xue, Y. Cui and G. Qian, Angew. Chem., Int. Ed., 2009, 48, 500 CrossRef CAS.
-
(a) S. I. Klink, G. A. Hebbink, L. Grave, P. G. B. Oude, F. C. J. M. van Veggel and M. H. V. Werts, J. Phys. Chem. A, 2002, 106, 3681 CrossRef CAS;
(b)
Lanthanide Probes in Life, Chemical and Earth Sciences: Theory and Practice, ed. J. C. G. Bünzli and G. R. Choppin, Elsevier, Amsterdam, 1989 Search PubMed.
-
(a) C. Yang, L. M. Fu, Y. Wang, J. P. Zhang, W. T. Wong, X. C. Ai, Y. F. Qiao, B. S. Zou and L. L. Gui, Angew. Chem., Int. Ed., 2004, 43, 5010 CrossRef CAS;
(b) R. V. Deun, P. Nockemann, P. Fias, K. V. Hecke, L. V. Meervelt and K. Binnemans, Chem. Commun., 2005, 590 RSC;
(c) A. D'Aléo, J. Xu, E. G. Moore, C. J. Jocher and K. N. Raymond, Inorg. Chem., 2008, 47, 6109 CrossRef;
(d) S. Petoud, S. M. Cohen, J. C. G. Bünzli and K. N. Raymond, J. Am. Chem. Soc., 2003, 125, 13324 CrossRef CAS;
(e) M. D. Allendorf, C. A. Bauer, R. K. Bhakta and R. J. T. Houk, Chem. Soc. Rev., 2009, 38, 1330 RSC;
(f) D. Parker, R. S. Dickins, H. Puschmann, C. Crossland and J. A. K. Howard, Chem. Rev., 2002, 102, 1977 CrossRef CAS;
(g) J. C. G. Bünzli and C. Piguet, Chem. Soc. Rev., 2005, 34, 1048 RSC.
-
(a) S. K. Ghosh and P. K. Bharadwaj, Inorg. Chem., 2005, 44, 3156 CrossRef CAS;
(b) S. Q. Su, W. Chen, C. Qin, S. Y. Song, Z. Y. Guo, G. H. Li, X. Z. Song, M. Zhu, S. Wang, Z. M. Hao and H. J. Zhang, Cryst. Growth Des., 2012, 12, 1808 CrossRef CAS.
-
(a) X. J. Wang, Z. M. Cen, Q. L. Ni, X. F. Jiang, H. C. Lian, L. C. Gui, H. H. Zuo and Z. Y. Wang, Cryst. Growth Des., 2010, 10, 2960 CrossRef CAS;
(b) A. de Bettencourt-Dias and S. Viswanathan, Dalton Trans., 2006, 4093 RSC;
(c) S. Viswanathan and A. de Bettencourt-Dias, Inorg. Chem., 2006, 45, 10138 CrossRef CAS.
-
(a) B. Zhao, L. Yi, Y. Dai, X. Y. Chen, P. Cheng, D. Z. Liao, S. P. Yan and Z. H. Jiang, Inorg. Chem., 2005, 44, 911 CrossRef CAS;
(b) Y. L. Lu, J. Y. Wu, M. C. Chan, S. M. Huang, C. S. Lin, T. W. Chiu, Y. H. Liu, Y. S. Wen, C. H. Ueng, T. M. Chin, C. H. Hung and K. L. Lu, Inorg. Chem., 2006, 45, 2430 CrossRef CAS.
-
(a) J. Xu, J. W. Cheng, W. P. Su and M. C. Hong, Cryst. Growth Des., 2011, 11, 2294 CrossRef CAS;
(b) X. Feng, J. S. Zhao, B. Liu, L. Y. Wang, S. W. Ng, G. Zhang, J. G. Wang, X. G. Shi and Y. Y. Liu, Cryst. Growth Des., 2010, 10, 1399 CrossRef CAS;
(c) X. P. Zhou, W. X. Ni, S. Z. Zhan, D. Li and Y. G. Yin, Inorg. Chem., 2007, 46, 2345 CrossRef CAS;
(d) J. G. Mao, Coord. Chem. Rev., 2007, 251, 1493 CrossRef CAS.
- S. R. Zheng, S. L. Cai, J. Fan, T. T. Xiao and W. G. Zhang, Inorg. Chem. Commun., 2011, 14, 818 CrossRef CAS.
-
(a) J. Fan, S. L. Cai, S. R. Zheng and W. G. Zhang, Acta Crystallogr., Sect. C: Cryst. Struct. Commun., 2011, 67, m346 Search PubMed;
(b) F. Sączewski, E. Dziemidowicz-Borys, P. J. Bednarski, R. Grünert, M. Gdaniec and P. Tabin, J. Inorg. Biochem., 2006, 100, 1389 CrossRef;
(c) L. L. Di, Y. Wang, G. W. Lin and T. Lu, Acta Crystallogr., Sect. E: Struct. Rep. Online, 2010, 66, m610 Search PubMed;
(d) X. J. Yao and Q. Yuan, Acta Crystallogr., Sect. E: Struct. Rep. Online, 2011, 67, o1399 Search PubMed.
-
(a)
G. M. Sheldrick, SHELXS-97, Program for Solution of Crystal Structures, University of Göttingen, Germany, 1997 Search PubMed;
(b)
G. M. Sheldrick, SHELXL-97, Program for Refinement of Crystal Structures, University of Göttingen, Germany, 1997 Search PubMed.
-
(a) G. X. Liu, K. Zhu, H. M. Xu, S. Nishihara, R. Y. Huang and X. M. Ren, CrystEngComm, 2010, 12, 1175 RSC;
(b) D. S. Li, Y. P. Wu, P. Zhang, M. Du, J. Zhao, C. P. Li and Y. Y. Wang, Cryst. Growth Des., 2010, 10, 2037 CrossRef CAS.
-
(a) H. B. Zhang, N. Li, C. B. Tian, T. F. Liu, F. L. Du, P. Lin, Z. H. Li and S. W. Du, Cryst. Growth Des., 2012, 12, 670 CrossRef CAS;
(b) H. Wang, S. J. Liu, D. Tian, J. M. Jia and T. L. Hu, Cryst. Growth Des., 2012, 12, 3263 CrossRef CAS;
(c) F. N. Dai, D. Sun and D. F. Sun, Cryst. Growth Des., 2011, 11, 5670 CrossRef CAS.
-
(a) P. J. M. Lehn, Angew. Chem., Int. Ed. Engl., 1990, 29, 1304 CrossRef;
(b) G. F. de Sá, O. L. Malta, C. de Mello Donegá, A. M. Simas, R. L. Longo, P. A. Santa-Cruz and E. F. da Silva Jr, Coord. Chem. Rev., 2000, 196, 165 CrossRef;
(c) D. B. Ambili Raj, S. Biju and M. L. P. Reddy, Inorg. Chem., 2008, 47, 8091 CrossRef CAS.
- F. J. Steemers, W. Verboom, D. N. Reinhoudt, E. B. van der Tol and J. W. Verhoeven, J. Am. Chem. Soc., 1995, 117, 9408 CrossRef CAS.
-
(a) M. Shi, F. Y. Li, T. Yi, D. Q. Zhang, H. M. Hu and C. H. Huang, Inorg. Chem., 2005, 44, 8929 CrossRef CAS;
(b) H. Xin, M. Shi, X. C. Gao, Y. Y. Huang, Z. L. Gong, D. B. Nie, H. Cao, Z. Q. Bian, F. Y. Li and C. H. Huang, J. Phys. Chem. B, 2004, 108, 10796 CrossRef CAS.
-
J. C. G. Bünzli and C. Piguet, in Encylopedia of Materials: Science and Technology, ed. K. H. J. Buschow, R. W. Cahn, M. C. B. Flemings, B. Ilschner, E. J. Kramer and S. Mahajan, Elsevier Science Ltd, Oxford, 2001. ch. 1.10.4, p. 4465 Search PubMed.
-
(a) S. Biju, M. L. P. Reddy, A. H. Cowley and K. V. Vasudevan, Cryst. Growth Des., 2009, 9, 3562 CrossRef CAS;
(b) D. B. Ambili Raj, S. Biju and M. L. P. Reddy, Dalton Trans., 2009, 7519 RSC.
- M. Latva, H. Takalo, V. M. Mukkala, C. Matachescu, J. C. Rodriguez-Ubis and J. Kanakare, J. Lumin., 1997, 75, 149 CrossRef CAS.
-
(a)
W. T. Carnall, in Handbook on the Physics and Chemistry of Rare Earths, ed. K. A. Gschneidner and L. Eyring, Elsevier, Amsterdam, The Netherlands, 1987, ch. 24, vol. 3, p. 171 Search PubMed;
(b)
G. H. Dieke, Spectra and Energy levels of Rare Earth Ions in Crystals, Interscience, New York, 1968 Search PubMed;
(c) G. Zucchi, O. Maury, P. Thuéry, F. Gumy, J. C. G. Bünzli and M. Ephritikhine, Chem.–Eur. J., 2009, 15, 9686 CrossRef CAS;
(d) J. Xia, B. Zhao, H. S. Wang, W. Shi, Y. Ma, H. B. Song, P. Cheng, D. Z. Liao and S. P. Yan, Inorg. Chem., 2007, 46, 3450 CrossRef CAS.
-
(a) J. Q. Chen, Y. P. Cai, H. C. Fang, Z. Y. Zhou, X. L. Zhan, G. Zhao and Z. Zhang, Cryst. Growth Des., 2009, 9, 1605 CrossRef CAS;
(b) L. Fu, R. A. Sá Ferreira, N. J. O. Silva, A. J. Fernandes, P. Ribeiro-Carlo, I. S. Gonalves, V. de Zea Bermudez and L. D. Carlos, J. Mater. Chem., 2005, 15, 3117 RSC;
(c) M. H. V. Werts, R. T. F. Jukes and J. W. Verhoeven, Phys. Chem. Chem. Phys., 2002, 4, 1542 RSC;
(d) S. Biju, D. B. Ambili Raj, M. L. P. Reddy and B. M. Kariuki, Inorg. Chem., 2006, 45, 10651 CrossRef CAS.
-
(a) H. Xin, F. Y. Li, M. Shi, Z. Q. Bian and C. H. Huang, J. Am. Chem. Soc., 2003, 125, 7166 CrossRef CAS;
(b) J. Kai, D. F. Parra and H. F. Brito, J. Mater. Chem., 2008, 18, 4549 RSC;
(c) M. S. Liu, Q. Y. Yu, Y. P. Cai, C. Y. Su, X. M. Lin, X. X. Zhou and J. W. Cai, Cryst. Growth Des., 2008, 8, 4083 CrossRef CAS.
- D. B. Ambili Raj, B. Francis, M. L. P. Reddy, R. R. Butorac, V. M. Lynch and A. H. Cowley, Inorg. Chem., 2010, 49, 9055 CrossRef.
- S. Raphael, M. L. P. Reddy, A. H. Cowley and M. Findlater, Eur. J. Inorg. Chem., 2008, 4387 CrossRef CAS.
-
(a) A. Bril and A. W. De Jager-Veenis, J. Electrochem. Soc., 1976, 123, 396 CrossRef CAS;
(b) C. De Mello Donegá, S. Alves Jr and G. F. De Sá, Chem. Commun., 1996, 1199 RSC;
(c) L. D. Carlos, C. De Mello Donegá, R. Q. Albuquerque, S. Alves Jr, J. F. S. Menezes and O. L. Malta, Mol. Phys., 2003, 101, 1037 CrossRef CAS.
- W. H. Melhuish, J. Opt. Soc. Am., 1964, 54, 183 CrossRef CAS.
-
(a) S. Comby, D. Imbert, C. Anne-Sophie, J. C. G. Bünzli, L. J. Charbonnière and R. F. Ziessel, Inorg. Chem., 2004, 43, 7369 CrossRef CAS;
(b) S. Quici, M. Cavazzini, G. Marzanni, G. Accorsi, N. Armaroli, B. Ventura and F. Barigelletti, Inorg. Chem., 2005, 44, 529 CrossRef CAS;
(c) M. Xiao and P. R. Selvin, J. Am. Chem. Soc., 2001, 123, 7067 CrossRef CAS.
- Y. H. Kim, N. S. Baek and H. K. Kim, ChemPhysChem, 2006, 7, 213 CrossRef CAS.
-
(a) N. Sabbatini, M. Guardigli and J. M. Lehn, Coord. Chem. Rev., 1993, 123, 201 CrossRef CAS;
(b) I. Nasso, S. Bedel, C. Galaup and C. Picard, Eur. J. Inorg. Chem., 2008, 2064 CrossRef CAS.
-
(a) J. Rocha, L. D. Carlos, F. A. Almeida Paz and D. Ananias, Chem. Soc. Rev., 2011, 40, 926 RSC;
(b) J. C. G. Bünzli and S. V. Eliseeva, J. Rare Earths, 2010, 28, 824 CrossRef;
(c) M. H. V. Werts, J. W. Hofstraat, F. A. J. Geurts and J. W. Verhoeven, Chem. Phys. Lett., 1997, 276, 196 CrossRef CAS;
(d) Y. Hasegawa, T. Ohktbo, K. Sogabe, Y. Kawamura, Y. Wada, H. Nakashima and S. Yanagida, Angew. Chem., Int. Ed., 2000, 39, 357 CrossRef CAS;
(e) K. Driesen, R. V. Deun, R. C. Görller-Walrand and K. Binnemans, Chem. Mater., 2004, 16, 1531 CrossRef CAS;
(f) M. D. Ward, Coord. Chem. Rev., 2007, 251, 1663 CrossRef CAS.
-
(a) J. L. Song, C. Lei and J. G. Mao, Inorg. Chem., 2004, 43, 5630 CrossRef CAS;
(b) G. A. Hebbink, L. Grave, L. A. Woldering, D. N. Reinhoudt and F. C. J. M. van Veggel, J. Phys. Chem. A, 2003, 107, 2483 CrossRef CAS;
(c) W. K. Wong, H. Liang, J. Guo, W. Y. Wong, W. K. Lo, K. F. Li, K. W. Cheah, Z. Zhou and W. T. Wong, Eur. J. Inorg. Chem., 2004, 829 CrossRef CAS;
(d) Y. F. Yuan, T. Cardinaels, K. Lunstroot, K. V. Hecke, L. V. Meervelt, C. Görller-Walrand, K. Binnemans and P. Nockemann, Inorg. Chem., 2007, 46, 5302 CrossRef CAS;
(e) S. Faulkner and S. J. A. Pope, J. Am. Chem. Soc., 2003, 125, 10526 CrossRef CAS;
(f) S. J. A. Pope, A. M. Kenwright, V. A. Boote and S. Faulkner, Dalton Trans., 2003, 3780 RSC;
(g) E. Galdecka, Z. Galdecki, P. Gawryszewska and J. Legendziewicz, New J. Chem., 2000, 24, 387 RSC.
-
(a) G. M. Davies, R. J. Aarons, G. R. Motson, J. C. Jeffery, H. Adams, S. Faulkner and M. D. Ward, Dalton Trans., 2004, 1136 RSC;
(b) A. I. Voloshin, N. M. Shavaleev and V. P. Kazakov, J. Lumin., 2001, 93, 199 CrossRef CAS.
-
(a) Y. X. Chi, S. Y. Niu and J. Jin, Inorg. Chim. Acta, 2009, 362, 3821 CrossRef CAS;
(b) Y. L. Huang, M. Y. Huang, T. H. Chan, B. C. Chang and K. H. Lii, Chem. Mater., 2007, 19, 3232 CrossRef CAS.
|
| This journal is © The Royal Society of Chemistry 2013 |
Click here to see how this site uses Cookies. View our privacy policy here. 


![[thin space (1/6-em)]](https://www.rsc.org/images/entities/char_2009.gif) 759/4461
759/4461![[thin space (1/6-em)]](https://www.rsc.org/images/entities/char_2009.gif) 687/3983
687/3983![[thin space (1/6-em)]](https://www.rsc.org/images/entities/char_2009.gif) 088/4012
088/4012![[thin space (1/6-em)]](https://www.rsc.org/images/entities/char_2009.gif) 382/4131
382/4131![[thin space (1/6-em)]](https://www.rsc.org/images/entities/char_2009.gif) 228/4141
228/4141


![[thin space (1/6-em)]](https://www.rsc.org/images/entities/char_2009.gif) 965 cm−1) (see Fig. 9). Because the first excited state of Gd3+ (about 32
965 cm−1) (see Fig. 9). Because the first excited state of Gd3+ (about 32![[thin space (1/6-em)]](https://www.rsc.org/images/entities/char_2009.gif) 000 cm−1), 6P7/2, is too high to accept any energy from the first excited triplet state of the ligand through intramolecular ligand-to-metal energy transfer, the phosphorescence spectrum of the corresponding Gd3+ compound could actually reveal the triplet energy level of the ligand.16 As shown in Fig. S5, ESI,† the triplet energy level (3ππ* = 24
000 cm−1), 6P7/2, is too high to accept any energy from the first excited triplet state of the ligand through intramolecular ligand-to-metal energy transfer, the phosphorescence spectrum of the corresponding Gd3+ compound could actually reveal the triplet energy level of the ligand.16 As shown in Fig. S5, ESI,† the triplet energy level (3ππ* = 24![[thin space (1/6-em)]](https://www.rsc.org/images/entities/char_2009.gif) 630 cm−1) of H2BIC is determined by the lower wavelength emission edge (406 nm) from the low-temperature phosphorescence spectrum of the Gd3+ compound 3.
630 cm−1) of H2BIC is determined by the lower wavelength emission edge (406 nm) from the low-temperature phosphorescence spectrum of the Gd3+ compound 3.![[thin space (1/6-em)]](https://www.rsc.org/images/entities/char_2009.gif) 335 cm−1) is significantly higher than 5000 cm−1, which suggests that the intersystem crossing process is effective for the H2BIC ligand.15,17 Further, the triplet energy level of H2BIC is also obviously higher than the 5D0 level of Eu3+ (17
335 cm−1) is significantly higher than 5000 cm−1, which suggests that the intersystem crossing process is effective for the H2BIC ligand.15,17 Further, the triplet energy level of H2BIC is also obviously higher than the 5D0 level of Eu3+ (17![[thin space (1/6-em)]](https://www.rsc.org/images/entities/char_2009.gif) 300 cm−1) and 5D4 level of Tb3+ (20
300 cm−1) and 5D4 level of Tb3+ (20![[thin space (1/6-em)]](https://www.rsc.org/images/entities/char_2009.gif) 500 cm−1), giving rise to an advantageous energy-transfer condition in 1 or 2. Of course, this does not mean that the higher the better, and the energy gap between the lowest triplet state of the H2BIC ligand and the 5D0 state (Eu3+) or the 5D4 state (Tb3+) must be appropriate. The gap may be too large or too small to get satisfactory luminescence efficiency; a large gap always yields an inefficient energy transfer and a small gap is beneficial to a back-energy transfer.18 Latva's empirical rule states that an optimal ligand-to-metal energy transfer process for Ln3+ requires ΔE (3ππ* − 5DJ) = 2500–4000 cm−1 for Eu3+ and 2500–4500 cm−1 for Tb3+.19 Given that the energy gap between the triplet state and 5D0 state of Eu3+ is 7330 cm−1, the H2BIC ligand is not in an ideal situation for the sensitization of Eu3+ luminescence. Whereas the energy gap between the triplet state and 5D4 state of Tb3+ is 4130 cm−1, suggesting that the H2BIC ligand could strongly sensitize Tb3+ emission in 2.
500 cm−1), giving rise to an advantageous energy-transfer condition in 1 or 2. Of course, this does not mean that the higher the better, and the energy gap between the lowest triplet state of the H2BIC ligand and the 5D0 state (Eu3+) or the 5D4 state (Tb3+) must be appropriate. The gap may be too large or too small to get satisfactory luminescence efficiency; a large gap always yields an inefficient energy transfer and a small gap is beneficial to a back-energy transfer.18 Latva's empirical rule states that an optimal ligand-to-metal energy transfer process for Ln3+ requires ΔE (3ππ* − 5DJ) = 2500–4000 cm−1 for Eu3+ and 2500–4500 cm−1 for Tb3+.19 Given that the energy gap between the triplet state and 5D0 state of Eu3+ is 7330 cm−1, the H2BIC ligand is not in an ideal situation for the sensitization of Eu3+ luminescence. Whereas the energy gap between the triplet state and 5D4 state of Tb3+ is 4130 cm−1, suggesting that the H2BIC ligand could strongly sensitize Tb3+ emission in 2.


