On the key role of hydroxyl groups in platinum-catalysed alcohol oxidation in aqueous medium†
Siwar
Chibani‡
a,
Carine
Michel
*a,
Françoise
Delbecq
a,
Catherine
Pinel
b and
Michèle
Besson
*b
aUniversité de Lyon, CNRS, École Normale Supérieure de Lyon, 46 allée d'Italie, F-69364 Lyon Cedex 07, France. E-mail: carine.michel@ens-lyon.fr
bUniversité de Lyon, CNRS, IRCELYON, 2 avenue A. Einstein, F-69626 Villeurbanne, France. E-mail: michele.besson@ircelyon.univ-lyon1.fr; Fax: +33 (0)472445399
First published on 14th August 2012
Abstract
In the aerobic selective oxidation of alcohols in aqueous medium in a batch reactor, it was observed that the addition of water to dioxane solvent (10–50 vol%) substantially increased the activity of a Pt/C catalyst. Periodic density functional theory (DFT) calculations were carried out to compare the reactivity of alcohols on the bare Pt(111) surface and in the presence of adsorbed water or hydroxyl groups, to explain the effect of water. The calculations indicate that the presence of adsorbed hydroxyl groups promotes the catalytic activity by participating directly in the catalytic pathways and reducing the activation barrier. Good agreement was found between the experiments in aqueous phase and these calculations. Further, decarbonylation of the aldehyde may be involved in the deactivation during oxidation of a primary alcohol.
1. Introduction
The selective oxidation of alcohols into the corresponding aldehydes, carboxylic acids and/or carbonyl compounds is one of the most important and useful reactions in the fine chemical, pharmaceutical and agrochemical sectors.1–3 Classical oxidants (stoichiometric quantities of inorganic oxidants such as permanganates, chromates, hypochlorites, or HNO3),4 the Dess–Martin periodinane,5 or the Swern reagent,6 are often used for commercial applications. However, they may be toxic and release large amounts of waste. An attractive clean method known for a long time,7 and which has received considerable attention over the years, is aerobic oxidation with a cheap oxidant such as molecular oxygen using metal catalysts. These catalysts can efficiently oxidize alcohols, using oxygen or air to generate only water as a by-product under mild conditions (40–100 °C), atmospheric or a low pressure, and pH 7–10. Several supported metallic systems (particularly palladium, platinum, ruthenium, and recently gold) on various supporting materials have been an area of intense interest and have emerged as efficient catalysts as described in reviews.8–11From a practical point of view, the first studies have mostly concentrated on the use of water as the solvent for oxidation of carbohydrates over Pt or Pd catalysts.12 However, the poor solubility in aqueous solution of weakly polar alcohols is a crucial issue for the generalization of this reaction. Though the use of detergents,13 organic solvents,14 scCO2,15,16 or amphiphilic resin-supported particles of Pd or Pt,17,18 has been proposed to overcome the difficulty, the choice of the solvent remains crucial. Several studies have indicated a promoting effect of water on the activity in aerobic oxidation of alcohols on metallic catalysts. For instance, we have investigated the oxidation of primary and secondary alcohols which are poorly soluble in water, and dioxane was used as additional solvent. 1- and 2-Octanol were chosen, since, moreover, aliphatic alcohols have been reported as being particularly difficult to oxidize compared with aromatic and allylic alcohols.19 Upon reacting the alcohol in dioxane solvent, only a slow oxidation took place. In comparison to the dioxane solvent, a significant enhancement in catalytic activity of a Pt/C catalyst was observed for both alcohols, by addition of increasing amounts of water to the solvent. The higher the water content, the higher the activity is. A promoting effect of water was also revealed in the oxidation of 1-phenylethanol and α-substituted pyridinemethanol derivatives over Pt/C and PtBi/C,20 of benzyl alcohol over Pd confined in SBA-16,21 Au/TiO2 in xylene,22 or carbon nanotube supported Ru catalysts in toluene.23 The solvent composition also modified the activity of Au–Pd and Au–Pt catalysts in oxidation of n-octyl, cinnamyl or benzylic alcohols.24,25
Another major problem in alcohol oxidation is the possible catalyst deactivation. Upon comparing 1-octanol and 2-octanol, we noted different reaction profiles with reaction time.19 A severe deactivation was observed during 1-octanol oxidation and complete conversion was not achieved at 100 °C. In the 2-octanol oxidation, full conversion could be attained with total selectivity to 2-octanone. One reason might be decarbonylation of the produced aldehyde resulting in site-blocking by chemisorbed CO and carbonaceous fragments under anaerobic conditions. Spectroscopic studies have shown that the aldehydes formed from primary alcohols (1-octanol, cinnamyl alcohol) were decarbonylated, while the ketones (in particular 2-octanone) were stable.26 Decarbonylation of crotonaldehyde was demonstrated by synchrotron XPS combined with temperature-programmed desorption during oxidation of crotyl alcohol.27 Strongly adsorbed CO could be removed by air.28,29
The exact reaction sequence through which a dehydrogenation mechanism occurs during selective oxidation of alcohols over noble metal catalysts is still debated. There are still discussions concerning the oxidation state of the active metallic sites, the elementary steps, and the involvement of oxygen or water in the reaction mechanism, the reason for the catalyst deactivation.8–11 The generally accepted mechanism for Pt group metals involves a dehydrogenation step of the adsorbed alcohol molecule on the metallic sites forming the carbonyl compound. The adsorbed hydrogen becomes oxidized by dissociatively adsorbed oxygen to liberate the metallic sites. This was supported by kinetic modelling,30 by the observation that oxygen can be replaced by an H-acceptor,31 or by the fact that the metal catalyst is in a reduced state both in the presence and absence of molecular oxygen by measurements of electrode potential,32 or in situ X-ray absorption spectroscopy (XAS).33 The direct interaction of surface oxygen species with the adsorbed alcohol (or its partially dehydrogenated intermediate) has also been proposed, supported by XAS studies that indicate partial oxygen coverage on the metal surface,34 and some kinetic studies revealing a Langmuir–Hinshelwood-type mechanism.35 The major role of oxygen has also been shown to be the removal of impurities from the aldehyde degradation on the surface sites.28,29
Clearly, the oxide species and chemisorbed oxygen species at the surface of the platinum (O2, –OH, H2O) should play an important role during the oxidation reactions. There are few data on how the presence of water at the catalyst–liquid solution interface can influence the kinetics of the catalytic reaction.36–38 Investigating the reactions at the solid–liquid interface in the complex solvent environment becomes essential to improve the heterogeneous process and to understand the mechanism. Computational studies using the density functional theory (DFT) have been undertaken for many years to shed light on the mechanisms of alcohols oxidation i.e. dehydrogenation and decomposition on surfaces, in particular of methanol39–45 and ethanol46–49 on Pt(111). Recently, 1- and 2-propanol have been also considered.50 Nowadays the experimental conditions begin to be taken into account in the calculations, particularly the solvent51 and co-adsorbates on the surface.52–55 To our knowledge, none of the previous works studied systematically the influence of the presence of hydroxyl groups or water on the energy of the intermediates on the Pt surface.
The aim of the present study is a further understanding of the promotion of the oxidation reaction by water and the possible poisoning of the active sites:
(i) To further assess the general use of aqueous phase promotion, the study was extended to some other alcohols in dioxane–water solvent, such as sterically hindered menthol and borneol.
(ii) To gain insight into the nature of the interactions of adsorbates with the platinum surface in the solvent environment, DFT calculations have been performed. We tried to elucidate the rate-determining step in different environments, including water molecules and co-adsorbates in the calculations to show whether they can enhance the activity of the catalyst by providing a low energy route for dehydrogenation.
We also examined the possible deactivation attributed to subsequent decarbonylation of the produced aldehyde in the case of primary alcohols.
2. Experimental details
Pt catalysts supported on a synthetic carbon catalyst (2.8–4.7 wt% Pt) were prepared by impregnation with an aqueous solution of H2PtCl6, followed by liquid phase reduction with formaldehyde in alkaline medium, as described previously.19 The carbon was prepared by carbonization at 1073 K of a porous polymeric phenolic resin, washing and activation with CO2 at 1123 K with 30% burn-off.56The oxidation reactions were performed in a 300 mL autoclave reactor made of Hastelloy C with a magnetically driven stirrer. The reactor was loaded with the feed solution (150 mL, 35–100 mmol L−1) and an appropriate amount of catalyst, then sealed, purged with Ar and heated to the desired temperature. Air was introduced up to the pressure of 10 bar and the reaction started upon applying efficient stirring. Liquid samples were periodically withdrawn from the reactor via a sample diptube, and analyzed via gas chromatography (GC) equipped with a flame ionization detector (FID) and a HP5 column (30 m × 0.25 mm, 0.25 μm film thickness).
3. Computational details
Periodic density Functional Theory (DFT) calculations have been carried out using the Vienna Ab Initio Simulation Program (VASP).57 The exchange-correlation energy and potential were calculated within the generalized gradient approximation (Perdew-Wang 91 functional).58 A tight convergence of the plane-wave expansion was obtained with a cut-off of 400 eV. The electron–ions interactions were described by the projector augmented method (PAW) introduced by Blöchl59 and adapted by Kresse and Joubert.60 The supported platinum catalyst has been modelled by a Pt(111) surface using a 3 × 3 supercell of a periodic slab of four layers and a vacuum of five equivalent metal layers. A Monkhorst–Pack mesh of 3 × 3 × 1 k points was used for the 2D Brillouin zone integration.61 Molecules have been adsorbed at the upper side of the slab. The adsorbates and the two upper layers were free to relax while the two bottom layers have been kept frozen in the bulk position (Pt–Pt distance = 2.82 Å). Geometries were converged up to reach forces less than 0.01 eV Å−1.Reaction paths have been studied combining Nudged Elastic Band (NEB) procedures62,63 together with our local reaction path generator OpenPath64 and the dimer method.65,66 Then, transition state (TS) structures have been optimized with a quasi-Newton algorithm and characterized by a single imaginary frequency.
The reaction energy ΔE of the bond scissions is the difference between the adsorbed reactant and the two products considered at infinite distance. The activation energy ΔE‡ is specified as the difference between the energy of the TS and the energy of the reactant. The adsorption energy, Eads, is the difference between the energy of the whole system and the energies of the reactant in gas phase and of the considered surface (Pt, H2O@Pt or OH@Pt). A negative value means stabilization.
The HREEL spectra have been simulated by calculation of the vibration frequencies, following a previous procedure.67 The technique used is based on the numerical calculation of the second derivatives of the potential energy surface within the harmonic approach. The force constant matrix is built with finite differences of the first derivatives of the total energy by geometrical perturbations of the optimized Cartesian coordinates of the system. The diagonalization of this matrix provides the harmonic molecular frequencies and the associated harmonic normal vibration modes. The intensities of the HREELS spectra are estimated by applying the formula given in ref. 67 where the intensities are proportional to the square of the dynamic dipole moments (derivatives of the dipole moments with respect to a given normal mode), to a function depending on experimental parameters and to the inverse of the frequencies.
4. Results and discussion
4.1. Water effects
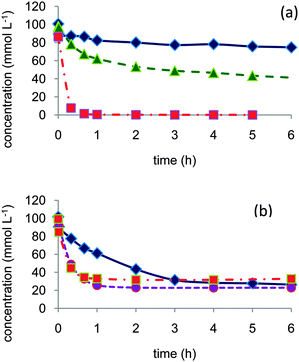 | ||
| Fig. 1 Role of water in the aerobic oxidation of 1- and 2-octanol: (a) 2-octanol in dioxane (◆) or dioxane–water 80/20 vol% (▲) or dioxane–water 50/50 vol% (■), (b) 1-octanol in dioxane (◆), dioxane–water 90/10 vol% (●), or dioxane–water 50/50 vol% (■). Reaction conditions: 150 mL 0.1 mol L−1 alcohol, 373 K, 10 bar air, substrate/Pt molar ratio = 100. | ||
In the oxidation of 2-octanol, whereas the catalyst was poorly active in dioxane, addition of water to the solvent greatly enhanced the reaction rate to attain total conversion to 2-octanone within one hour in dioxane–water 50/50 vol%. The initial reaction rate in 1-octanol oxidation was also greatly enhanced even by addition of a low amount of water (dioxane–water 90/10 vol%). Further addition of water (dioxane–water 50/50 vol%) did not significantly improve the performances. However, in contrast to the observations with 2-octanol, none of the reactions could attain completion; after a high initial reaction rate, a severe inhibition was clearly observed and conversion was rapidly limited to ca. 70–75% after 1 h reaction. In dioxane the major product was 1-octanal, while in dioxane–water solvent octanoic acid concentration was the higher.
We further explored the oxidation of some secondary alcohols. Fig. 2 shows the reaction of menthol and borneol in dioxane and different dioxane–water mixtures to the corresponding ketone.
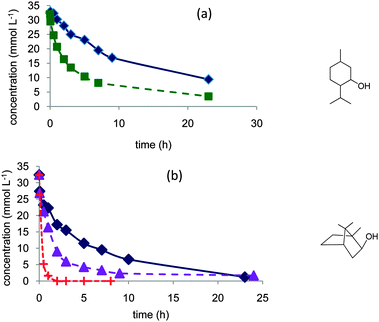 | ||
| Fig. 2 Evidence of the role of water in the aerobic oxidation of secondary alcohols to the ketone: (a) menthol in dioxane (◆) or dioxane–water 80/20 vol% (■), (b) borneol in dioxane (◆), dioxane–water 70/30 vol% (▲), or dioxane–water 50/50 vol% (+). Reaction conditions: 150 mL 0.035 mol L−1 alcohol, 373 K, 10 bar air, substrate/Pt molar ratio = 100. | ||
In the reactions with these secondary alcohols, the activity of the catalyst was also improved by increasing the water concentration. Conversion attained rapidly completion, and no inhibition of the reaction was observed. The selectivity to the ketone was >95%.
The transformation of the primary alcohol into the aldehyde and of a secondary alcohol into the ketone corresponds to the scission of two bonds: an O–H bond and a C–H bond. Depending on which breaking occurs first, two routes are possible: (i) route O starting with the O–H bond dissociation and followed by the α-CH bond breaking of the alkoxy, (ii) route C starting with the C–H bond dissociation and then the O–H bond breaking. In the following paragraphs, the influence of the environment (bare surface, adsorbed H2O and OH) on these two paths will be discussed for EtOH and then iPrOH. For the first step, the transition states (TSs) are labelled after the bond breaking (TSOH and TSCH), and so does the subsequent intermediate (IntOH and IntCH). For the second step, the TS label is built by concatenating the name of bonds dissociated in the first step and in the second step: for instance, TSOH–CH corresponds to the CH scission as a second step (route O).
Adsorption. The adsorption of the ethanol molecule at a Pt(111) surface follows the general mode of alcohols on this surface: EtOH interacts with the metallic surface through an oxygen lone pair and is consequently adsorbed at a top position. The adsorption energy is −0.34 eV (33 kJ mol−1) with our calculation parameters, slightly higher than the one calculated previously, 27 kJ mol−1,48 but smaller than the experimental value determined from TPD experiments, 50 kJ mol−1,71 which indicates a weak adsorption.
Let us now consider a modified platinum surface. When one oxygen atom is already adsorbed at the surface, the adsorption energy of ethanol adsorbed at a vicinal site is reduced to −0.15 eV and its adsorption geometry is not modified. In other words, an ethanol molecule prefers to adsorb at the bare platinum surface or far from an oxygen atom of the oxygenated one. Thus, the influence of oxygen on alcohol reactivity at the Pt(111) surface will not be considered further.
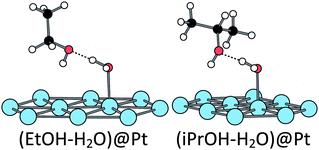
When one water molecule is already chemisorbed at the Pt(111) surface, the adsorption energy is increased to −0.61 eV which means that the presence of chemisorbed water promotes the ethanol adsorption. In addition, the adsorption geometry is strongly modified. The ethanol molecule does not interact directly with the surface through an oxygen lone pair. However, it interacts with the pre-adsorbed water molecule through a H-bond (H⋯O = 1.61 Å), the water molecule being the H-bond donor and the ethanol being the H-bond acceptor (Fig. 3). This configuration has been found 0.32 eV more stable than the co-chemisorption of the two molecules, each one on a top position on a Pt atom. Thus, an ethanol molecule prefers to interact with the pre-adsorbed water molecule than to be chemisorbed on the Pt(111) surface. This strongly stabilizing co-adsorption mode has already been described and analysed on Rh(111).54
The hydroxylated surface has an even more surprising reactivity towards ethanol adsorption. The hydroxyl is considered to be adsorbed at a top position (only 0.05 eV higher than the bridge position). On such a modified platinum surface, the ethanol is strongly adsorbed (−0.89 eV). It interacts with a neighbour platinum atom (Pt–O = 2.07 Å) and its hydroxyl hydrogen is transferred to the pre-adsorbed hydroxyl group along the adsorption path, leading to the H2O–EtO structure represented in Fig. 4 (O–H = 1.39 and 1.09 Å between ethanol and OH, respectively). It is worth noting that EtOH is already partially oxidized by the pre-adsorbed hydroxyl. While our work was in progress, similar results have been published.52 The same transfer has also been calculated in the case of phenylethanol on a gold catalyst.53
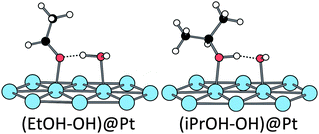 | ||
| Fig. 4 Structures obtained after adsorption of ethanol and isopropanol in the presence of an adsorbed hydroxyl (Eads = −0.89 eV in both cases). | ||
Reaction paths. The co-adsorbed species affects not only the adsorption process but also the reaction paths followed by the target molecule. As already mentioned, the oxidation of ethanol into acetaldehyde can follow two routes, route O and route C depending on which bond is broken first (OH or CH, respectively).
The stationary points along these two routes have been fully characterized in three cases: (i) bare Pt(111) surface, (ii) H2O@Pt(111) surface and (iii) OH@Pt(111) surface. At the bare surface, the TS structure of route C exhibits a classical triangular shape for the first scission (TSCH) while the first TS of route O involves four atoms (Fig. 5 and Table 1 for the main geometrical characteristics). The resulting intermediates IntCH and IntOH are bonded top to a platinum atom through the C and O atom, respectively. The next dissociation leads to the formation of a C![[double bond, length as m-dash]](https://www.rsc.org/images/entities/char_e001.gif) O bond. The TSOH–CH is a five-centres transition state: two platinum atoms plus the C, O and H atoms are directly involved in the TS (Fig. 5) and the resulting acetaldehyde is adsorbed at a top configuration (Pt–O = 2.0 Å, the C
O bond. The TSOH–CH is a five-centres transition state: two platinum atoms plus the C, O and H atoms are directly involved in the TS (Fig. 5) and the resulting acetaldehyde is adsorbed at a top configuration (Pt–O = 2.0 Å, the C![[double bond, length as m-dash]](https://www.rsc.org/images/entities/char_e001.gif) O bond being almost perpendicular to the surface). The adsorption energy is −0.32 eV, in agreement with previous calculations.47 On the other route, the TSCH–OH is a four-centres transition state (Fig. 5). The resulting acetaldehyde is adsorbed in a less stable di-sigma mode (Eads = 0.21 eV), the C
O bond being almost perpendicular to the surface). The adsorption energy is −0.32 eV, in agreement with previous calculations.47 On the other route, the TSCH–OH is a four-centres transition state (Fig. 5). The resulting acetaldehyde is adsorbed in a less stable di-sigma mode (Eads = 0.21 eV), the C![[double bond, length as m-dash]](https://www.rsc.org/images/entities/char_e001.gif) O bond being almost parallel to the surface.
O bond being almost parallel to the surface.
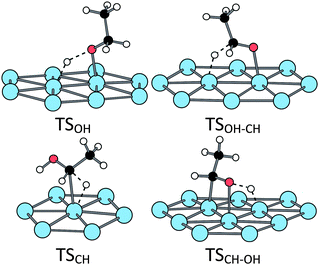 | ||
| Fig. 5 Transition states structures of the ethanol oxidation at a bare Pt(111) surface. | ||
| ΔE | ΔE‡ | N | X–H | Pt–Y | Pt–H | H⋯O | |
|---|---|---|---|---|---|---|---|
| OH | |||||||
| Pt(111) | 0.67 | 0.88 | 4 | 1.70 | 2.06 | 1.63 | |
| H2O@Pt(111) | 0.53 | 0.84 | 4 | 1.58 | 2.18 | 1.65 | 1.62 |
| OH–CH | |||||||
| Pt(111) | −0.48 | 0.08 | 5 | 1.45 | 2.95 | 1.70 | |
| H2O@Pt(111) | −0.21 | 0.43 | 5 | 1.55 | 3.10 | 1.67 | 1.76 |
| OH@Pt(111) | −0.17 | 0.33 | 5 | 1.55 | 3.05 | 1.66 | 1.67 |
| CH | |||||||
| Pt(111) | −0.14 | 0.67 | 3 | 1.63 | 2.52 | 1.64 | |
| H2O@Pt(111) | −0.02 | 0.90 | 3 | 1.61 | 2.40 | 1.63 | 1.79 |
| CH–OH | |||||||
| Pt(111) | 0.45 | 0.81 | 4 | 1.56 | 2.23 | 1.64 | |
| H2O@Pt(111) | 0.34 | 0.68 | 6 | 1.62 | 3.13 | 1.62 | 1.51 |
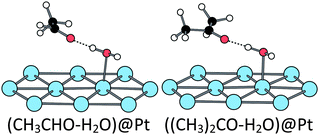
When adsorbed at the hydrated surface, the ethanol molecule does not interact directly with the surface. However, the first dissociation is also promoted by the platinum surface, the corresponding TS being close to the ones obtained at the bare surface (Fig. 6 and Table 1). The second scission is more affected. The TSOH–CH keeps a five-centres structure, but the TSCH–OH is a six-centres one, involving the water molecule (Fig. 6 and Table 1). Both TS lead to an acetaldehyde molecule, non-adsorbed at the surface but H-bonded with the water molecule, the C![[double bond, length as m-dash]](https://www.rsc.org/images/entities/char_e001.gif) O bond being almost parallel to the surface, but farther than in the absence of water (Fig. 7).
O bond being almost parallel to the surface, but farther than in the absence of water (Fig. 7).
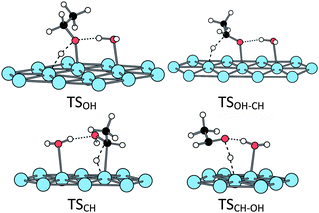 | ||
| Fig. 6 Transition states structures of the ethanol oxidation at a H2O@Pt(111) surface. | ||
The hydroxylated platinum surface is the last case under consideration. It differs from the two previous cases, as the first OH scission is concomitant with the adsorption process (see above). The following CH dissociation is promoted by the platinum surface through a five-centres transition state. This TS is similar to TSOH–CH at the hydrated surface (Fig. 6).
The presence of co-adsorbed species modifies also strongly the energetics of the reaction paths. The two possible reaction paths for ethanol oxidation are represented in Fig. 8 for each case: (i) bare Pt(111), (ii) H2O@Pt(111) and (iii) OH@Pt(111). At the bare platinum surface, the main reaction path is clearly route C compared with route O. On this route C, both steps are equally demanding energetically. In the presence of co-adsorbed water, the OH scissions are slightly facilitated while the CH bond scissions are inhibited: ΔE‡(TSCH) = 0.67 eV at the bare Pt(111) while ΔE‡(TSCH) = 0.90 eV at the hydrated surface for instance. The same phenomenon has been observed and explained in the case of Rh.54 This shift up in energy for the CH dissociation makes those dissociations the rate-limiting step in both routes (i.e. the first step of route C and the second step of route O) at the hydrated surface. Another consequence is that route O becomes competitive with route C: the main route cannot be easily identified. However, both of them are more demanding energetically than route C at the bare surface. In other words, the hydrated platinum surface is less active than the bare surface.
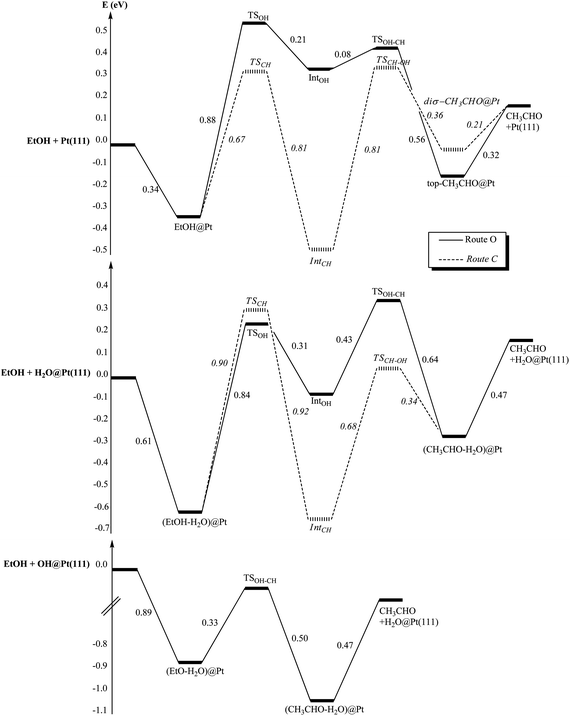 | ||
| Fig. 8 Reaction paths of EtOH oxidation into acetaldehyde (CH3CHO): (i) at the bare platinum surface Pt(111), (ii) at the hydrated platinum surface H2O@Pt(111) and (iii) at the hydroxylated surface OH@Pt(111). Energies are in eV. The reference energy is the isolated EtOH and (i) the bare platinum surface, (ii) H2O@Pt(111), (iii) OH@Pt(111). | ||
Once again, the hydroxylated surface presents a completely different behaviour. Only one step is activated and its barrier is low (ΔE‡(TSOH–CH) = 0.33 eV, half the CH bond breaking at the bare surface). Thus, this surface is strongly activated compared with the bare surface and the hydrated surface and will promote easily the ethanol dehydrogenation into acetaldehyde.
Adsorption. On the bare surface and the hydrated surface, the adsorption of iPrOH is similar to that of ethanol, both geometrically (Fig. 3) and energetically: Eads = −0.35 eV for the bare surface, Eads = −0.61 eV for the hydrated surface. The adsorption energy of this secondary alcohol at the hydroxylated surface is close to the one of ethanol (−0.89 eV). But the geometry differs: the pre-adsorbed OH does not abstract the hydroxyl hydrogen of iPrOH and isopropanol adsorbs molecularly, making only a hydrogen bond with OH (see Fig. 4, the O–H distances being 1.07 and 1.42 Å with iPrO and OH, respectively). So, adsorbed on a platinum surface, iPrOH is less acidic than EtOH.
Reaction paths. The transition states for the different elementary steps of the isopropanol oxidation are very similar to the ones of ethanol oxidation. They are represented in Fig. S1, S2 and S3 (ESI†). The reaction energy, the activation energy and the main geometrical characteristics of the TS of each step are collected in Table S1 (ESI†). The transition state structures are similar to those of ethanol but with longer C–H and Pt–C distances due to the steric hindrance, in the case of the first CH breaking. In the other cases, second CH dissociation or hydrated surface, the bond lengths are not modified because the C(CH3)2 group is farther from the surface. At the bare surface, the final product (acetone) is preferentially adsorbed on-top and the di-σ adsorption mode is 0.6 eV less stable. At the hydrated surface, acetone is adsorbed through a H-bond with the water molecule, similarly to acetaldehyde (Fig. 7).
The reaction paths for the isopropanol oxidation are shown in Fig. 9. At the bare surface, route C is the easiest one and conversely, route O is preferred at the hydrated surface. In both cases, the two steps are equally energetically demanding. The corresponding transition states energies are lower for the bare surface than for the hydrated one. Once again, the hydroxylated surface is completely different from the bare and hydrated ones. As seen in the previous paragraph, isopropanol does not undergo OH dissociation when co-adsorbed with a hydroxyl. In addition, even if one tries to enforce a iPrO–H2O configuration, the system turns back spontaneously to a iPrOH–OH configuration. This means that route O is not possible for isopropanol at a hydroxylated surface. However, route C is feasible. The activation energy of the CH scission is only 0.27 eV, the lowest activation energy found in this complete study. Moreover, the OH bond breaking occurs simultaneously with the CH scission and acetone, not adsorbed at the surface but making a hydrogen bond with H2O, is obtained directly. In other words, here again the oxidation of the alcohol at the hydroxylated platinum surface requires only one activated step.
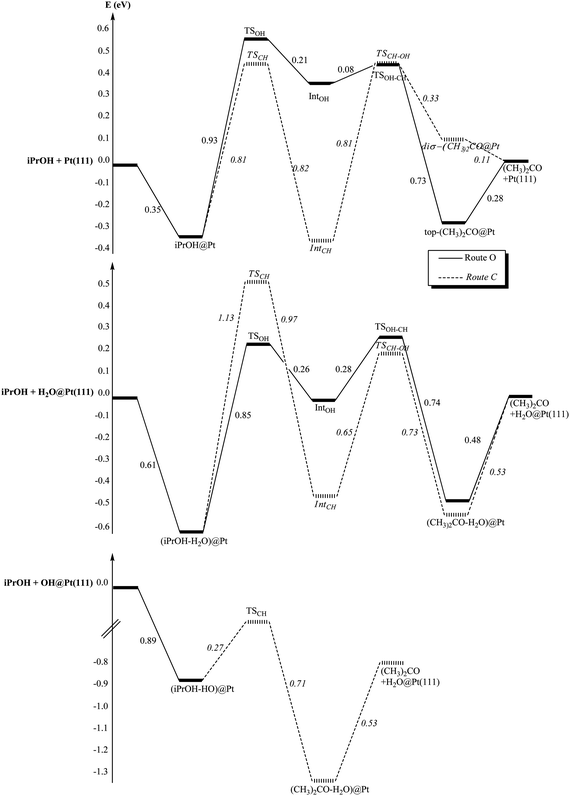 | ||
| Fig. 9 Reaction paths of the iPrOH oxidation into acetone (CH3)2CHO: (i) at the bare platinum surface Pt(111), (ii) at the hydrated platinum surface H2O@Pt(111) and (iii) at the hydroxylated surface OH@Pt(111). Energies are in eV. The reference energy is the isolated iPrOH and (i) the bare platinum surface, (ii) H2O@Pt(111), (iii) OH@Pt(111). | ||
Ethanol and isopropanol only differ by an extra methyl group adjacent to the C–O bond. This group increases the bulkiness of the C atom that undergoes the C–H dissociation and also the stability of the resulting radical, secondary vs. primary. The two effects are opposite. In the case of the first step of route C, where the carbon must approach the surface, the strong steric effect prevails over the electronic one and an increase of the barrier by 0.14 and 0.28 eV is observed, compared to ethanol, in the case of the bare and hydrated surface, respectively. In the case of the second CH scission (TSOH–CH), the carbon atom is farther from the surface and the electronic effect prevails, leading to a decrease of the barrier by 0.15 eV, compared to ethanol in the case of the hydrated surface. In the case of the hydroxylated surface, the carbon atom is also farther from the surface since the final product is directly a non-bonded acetone molecule, and the same effect is observed: a decrease of the barrier by 0.06 eV. The OH scission is much less affected by the substitution: the activation energies ΔE‡(OH) and ΔE‡(CH–OH) are close to the ones for ethanol (±0.05 eV).
Depending on the surface under consideration, the conclusions are different. At the bare surface, route C is preferred for both alcohols. In the case of isopropanol, the barriers are higher than in the case of ethanol. Hence, the secondary alcohol is less reactive than the primary one, in agreement with the experimental results observed in pure dioxane (without water).
In the case of the hydrated surface, route O becomes the most favourable route for isopropanol. In addition, isopropanol appears being more reactive than ethanol, since the barrier of the second step is smaller, which agrees with the experimental observations (Fig. 1). However, if the bare and the hydrated surfaces are compared, the latter appears being less reactive towards both alcohols (higher barriers), which is in contradiction with the experimental observations. Therefore, these results do not explain the role of water in enhancing the reactivity of the alcohols on the catalyst.
Now, as mentioned previously, it has been shown experimentally that the adsorption of water at a Pt surface, precovered with oxygen, leads to the easy formation of OH groups adsorbed at the surface.68–70 The barrier for the reaction O + H2O → 2OH has been calculated at 0.25 eV.74 At the hydroxylated surface, we have already noted that the unique activation energy along the reaction path is the lowest one for both alcohols. Not only this surface is promoting the alcohol oxidation, but also it seems to be slightly more reactive towards isopropanol than towards ethanol: ΔE‡(ethanol) = 0.33 eV and ΔE‡(isopropanol) = 0.27 eV. These results are in agreement with the experimental results: the addition of water increases the rate of the reaction and more for 2-octanol than for 1-octanol.
Our results show that the role of water in enhancing the reactivity of the platinum surface during the oxidation of alcohols is an indirect one: the hydroxyl groups, formed by reaction of H2O with O atoms at the surface, are indeed the promoters of the reaction. The role of OH groups has indeed been observed experimentally on Au and Pt catalysts.51
4.2. Deactivation by decarbonylation
The experimental results described above for 1-octanol oxidation at 373 K (Fig. 1) showed that the oxidation reaction could be strongly inhibited. However, performing the reaction at 333 K in dioxane–water 50/50 vol% solvent made slightly alkaline (0.03 eq. NaOH) instead of 373 K allowed the reaction to be complete to the acid, without any deceleration of the reaction rate, though, as expected, the reaction rate was lower.19The aldehyde obtained after oxidation of the primary alcohol can be further oxidized in solution into a carboxylic acid thanks to the presence of water, through the formation of the gemdiol. It can also be decomposed at the platinum surface, as observed for acetaldehyde.72,73 In that case, the final product is CO, showing that there is a decarbonylation. Some theoretical works have already dealt with the decomposition scheme of acetaldehyde on Pt(111).46–48,52 In these works, the possible bond breakings (C–H, C–C, C–O) were calculated. The conclusion was that breaking the C–H bond of the aldehydic group is the easiest reaction. Then the C–C bond is broken more easily than the C–O one but the barrier is high. We have revisited the C–H and C–C bond breaking of acetaldehyde and of the subsequent species with the present surface model and method in order to be consistent and able to compare with the previous energy diagrams.
The C–H dissociation of the aldehyde hydrogen is exothermic by −0.76 eV and needs a small energy barrier of 0.26 eV (Table 2), higher than the one calculated in ref. 43 and 44, but in the same range as the one extracted from kinetics measurements (0.21 eV). The corresponding transition state is a four-centers TS, rather early along the path with a C–H bond of 1.33 Å (21% elongation) and a Pt–H bond of 1.77 Å. The resulting acetyl intermediate CH3CO is adsorbed by the carbon atom in a top geometry (Pt–O = 2.02 Å). The di-σ geometry where both the carbon and the oxygen are bound to the surface (with a long Pt–O bond of 2.42 Å) is only slightly less stable than the first one. This step presents the lowest barrier we have found in the transformation of ethanol (see Fig. 8). It is even lower than the desorption energy of acetaldehyde. Hence, this intermediate can be easily obtained. In addition, the reverse barrier is rather high (1.02 eV) preventing the system from going back to acetaldehyde.
| Reaction | ΔE | ΔE‡ | C–H | C–C | Pt–H | Pt–C(CO) |
|---|---|---|---|---|---|---|
| CH3CHO → CH3CO + H | −0.76 | 0.26 | 1.33 | 1.77 | ||
| CH3CO → CH2CO + H | 0.08 | 1.06 | 1.52 | 1.62 | ||
| CH3CO → CH3 + CO | −0.16 | 1.44 | 1.99 | 1.94 | ||
| CH2CO → CHCO + H | 0.10 | 0.87 | 1.53 | 1.63 |
The following step can be either a C–C or a C–H bond breaking. The C–C bond breaking is slightly exothermic (−0.16 eV) and the energy barrier is high (1.44 eV), in agreement with the values found previously.48,49 In the TS, the C–C bond is elongated to 1.99 Å and the Pt–C bond is almost formed (2.27 Å, 9% elongation). This TS can be considered as late in relation with the high barrier. A secondary agostic interaction takes place between a H of the methyl group and a Pt atom (Pt–H = 1.94 Å), which elongates the C–H bond to 1.15 Å. This agostic interaction is broken in the final state. Except the latter interaction that was not mentioned, the present TS looks very similar to the one previously reported. The products are a methyl group and a C![[double bond, length as m-dash]](https://www.rsc.org/images/entities/char_e001.gif) O group chemisorbed at top vicinal positions (Pt–C = 2.08 Å and 1.86 Å, respectively and C–O = 1.16 Å). The C–H bond breaking leads to a ketene molecule, adsorbed in a di-σ CC geometry (Pt–C = 2.08 and 2.03 Å, C–C = 1.50 Å, CO = 1.20 Å). The reaction is slightly endothermic by 0.08 eV and the barrier is also relatively high at 1.06 eV (compared to 0.96 eV49). The TS is a relatively late three-centres TS with C–H and Pt–H distances of 1.52 and 1.62 Å, respectively. The barriers of the C–C and C–H bond breakings are both high, the C–H bond rupture being the smallest. Hence at low temperature (333 K), CH3CO is likely the acetaldehyde decomposition species. In the presence of OH groups, it can be hydroxylated to acetic acid. The barrier for this step is low (0.31 eV46).
O group chemisorbed at top vicinal positions (Pt–C = 2.08 Å and 1.86 Å, respectively and C–O = 1.16 Å). The C–H bond breaking leads to a ketene molecule, adsorbed in a di-σ CC geometry (Pt–C = 2.08 and 2.03 Å, C–C = 1.50 Å, CO = 1.20 Å). The reaction is slightly endothermic by 0.08 eV and the barrier is also relatively high at 1.06 eV (compared to 0.96 eV49). The TS is a relatively late three-centres TS with C–H and Pt–H distances of 1.52 and 1.62 Å, respectively. The barriers of the C–C and C–H bond breakings are both high, the C–H bond rupture being the smallest. Hence at low temperature (333 K), CH3CO is likely the acetaldehyde decomposition species. In the presence of OH groups, it can be hydroxylated to acetic acid. The barrier for this step is low (0.31 eV46).
At higher temperature (373 K), a barrier of 1 eV is likely to be overcome. Hence for such temperatures, the C–H bond rupture could take place and ketene be obtained. Alcala et al. have shown that the barrier to break the C–C bond in ketene is higher than in the case of acetyl CH3CO (1.38 eV) but that the corresponding barrier in the ketenyl CHCO is much smaller (0.96 eV). However, the transformation of ketene into ketenyl had not been studied. Hence, we have considered the C–H breaking in ketene leading to ketenyl. The reaction is slightly endothermic (0.10 eV) and the barrier is 0.87 eV far lower than the one for the C–C bond breaking calculated previously. The TS is an usual three-centers TS with C–H and Pt–H distances of 1.53 and 1.63 Å, respectively. Hence, in ketene, as in acetyl, it is preferable to break first the C–H bond to obtain CHCO; then the C–C bond breaks more easily. The transition states structures can be found in Fig. 10.
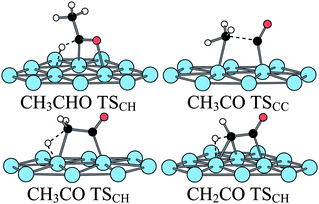 | ||
| Fig. 10 Transition states structures of the acetaldehyde decomposition at a bare Pt(111) surface. | ||
The acetaldehyde decomposition on Pt(111) has been followed by temperature-programmed desorption (TPD) experiments associated with high-resolution electron-energy loss spectroscopy (HREELS).72,73 The HREEL experimental spectrum collected following adsorption at 120 K corresponds to a monolayer of adsorbed acetaldehyde (see Fig. 11). During the heating, the νCO peak of CH3CHO at 1663 cm−1 almost disappears as well as the bands between 1360 and 1427 cm−1. Meanwhile, a high peak grows at 620 cm−1. At 350 K, the characteristic peak of on-top bonded CO dominates (2089 cm−1) accompanied by the corresponding peak at 474 cm−1. A small peak assigned to bridge bonded CO exists also at 1819 cm−1. This evidences that decarbonylation takes place from this temperature. In the region of the νCH vibrations, the peak at 3008 cm−1, present at low temperature, disappears when the temperature increases and a new peak appears at 2981 cm−1 at 350 K.
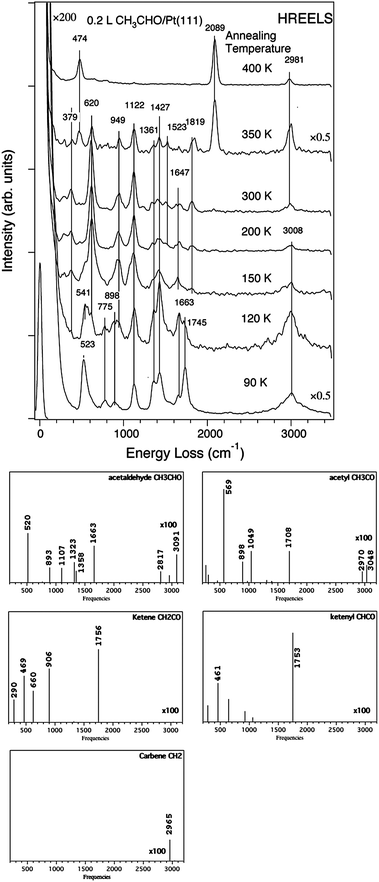 | ||
| Fig. 11 Experimental HREELS spectra of adsorbed acetaldehyde on Pt(111) after heating at various temperatures (reprinted with permission from ref. 72). Simulated spectra of CH3CHO, CH3CO, CH2CO, CHCO, CH2. All calculated spectra have the same scale. | ||
To characterize adsorbed surface species during the desorption experiment, we have simulated the vibrational spectra of CH3CHO, CH3CO, CH2CO, CHCO, and CH2 and compared them to the experimental ones. CH3 has not been considered since its formation is unlikely owing to the high barrier (Table 2). The simulated spectrum for CH3CHO has been already published75 but is redone here for the sake of consistency. This calculated spectrum exhibits two main peaks at 1663 and 520 cm−1, corresponding to νCO and νPtO, respectively, and found experimentally at 1663–1745 and 523–541 cm−1. There are also features at 893, 1107 and 1323–1358 cm−1. All these peaks are found in the experimental spectrum (898, 1122, 1362–1427 cm−1). Finally high νCH peaks are obtained between 2817 and 3091 cm−1. They correspond to the large band observed in the experimental spectrum taken after heating at 120 K. The simulated spectrum of CH3CO shows significant differences both in intensity and in position of the peaks. The peaks centred around 1300 cm−1 no longer exist and the spectrum is dominated by the νPtC mode at 569 cm−1, corresponding to the experimental peak at 620 cm−1 observed above 150 K. The other peaks are also slightly shifted. The νCH peaks are also less intense. Hence, between 150 and 300 K, the appearance in the experimental spectra of a peak at 620 cm−1 and the disappearance of the peaks at 1361–1427 cm−1 indicates that, in this temperature range, the main species is CH3CO.
At 350 K, CO is obviously already present and a small quantity of CH3CO remains. However the high intensity νCH peak at 2981 cm−1 shows the existence of hydrocarbons. In fact, we have shown before that CH3CO decomposes likely into CH2CO and CHCO before the C–C bond is broken. The calculated spectra of ketene CH2CO and ketenyl CHCO are dominated by an intense peak at 1756 and 1753 cm−1, respectively. Such peaks do not exist in the experimental spectrum at 350 K. Hence ketene and ketenyl are transient intermediates and therefore species like adsorbed CH2 or CH are likely present. These species give intense νCH vibrations as illustrated for the carbene, which could explain the high peak at 2981 cm−1 appearing with CO at 350 K. Ketene can also be at the origin of acetic acid production by hydration.
This analysis of the TPD experiment allows us to confirm that the first step of acetaldehyde decomposition is the C–H breaking of the aldehydic group. It occurs at temperature as low as 150 K in agreement with the low calculated barrier. The subsequent C–H and C–C breakings are more energy demanding and occur at higher temperature so that CH3CO remains the main species over a large range of temperatures. At high temperature, the final result of acetaldehyde decomposition is decarbonylation.
To summarize, the above study of acetaldehyde decomposition allows us to shed light on some experimental details. In the case of primary alcohols, at the temperature of the reaction (373 K), the product resulting from the removal of the aldehydic hydrogen (corresponding to acetyl) can easily be hydroxylated to carboxylic acid or decomposed further into CO and carbonaceous residues, poisoning the surface, which could explain the limitation of the conversion. At lower temperature, the decomposition is less easy and the reaction can go to completion with production of large amounts of acid as observed experimentally.
The C–C bond breakings are more difficult than the C–H ones and become feasible after the removal of almost all hydrogens. In acetone, the absence of H on the C![[double bond, length as m-dash]](https://www.rsc.org/images/entities/char_e001.gif) O group prevents decomposition from taking place. This could be the reason why the catalyst is not poisoned in the case of secondary alcohols.
O group prevents decomposition from taking place. This could be the reason why the catalyst is not poisoned in the case of secondary alcohols.
5. Conclusion
The combination of experimental results on the oxidation reaction of alcohols on Pt catalysts and of DFT calculations has allowed the understanding of the different behaviour of primary and secondary alcohols. In particular, it has been shown that the higher activity of secondary alcohols compared with the primary alcohols in the presence of water is due to a balance between steric and electronic effects of the substituents. The present study has also shed light on the role of water in these reactions. The main new conclusion is that the rate enhancement in the presence of water is not due to water itself but to hydroxyl groups formed by reaction of water with dissociated oxygen at the surface of the catalyst. The most energetically favorable pathway is then facilitated by the presence of adsorbed OH, which reduces the overall barrier. Decarbonylation of acetaldehyde at 373 K is likely to be the cause of deactivation of the catalyst.Acknowledgements
The calculations have been performed using the local HPC resources of PSMN at ENS-Lyon and of GENCI (CINES/IDRIS), project x2010075105.Notes and references
- J. I. Kroschwitz, in Kirk-Othmer Encyclopedia of Chemical Technology, Wiley-Intersciences, New York, 4th edn, 1992, vol. 4 Search PubMed.
- R. A. Sheldon, I. W. C. E. Arends, G. T. Brink and A. Dijksman, Acc. Chem. Res., 2002, 35, 774 CrossRef CAS.
- J. Muzart, Tetrahedron, 2003, 59, 5789 CrossRef CAS.
- J. March, in Advanced Organic Chemistry: Reactions, Wiley, New York, 1992 Search PubMed.
- D. B. Dess and J. C. Martin, J. Org. Chem., 1983, 48, 4155 CrossRef CAS.
- A. J. Mancuso, S. L. Huang and D. Swern, J. Org. Chem., 1978, 43, 2480 CrossRef CAS.
- O. Dolmer and H. Heyns, US Pat. 2 190 377, 1940 Search PubMed.
- M. Besson and P. Gallezot, Catal. Today, 2000, 57, 127 CrossRef CAS.
- T. Mallat and A. Baiker, Chem. Rev., 2000, 104, 3037 CrossRef.
- C. Della Pina, E. Falletta, L. Prati and M. Rossi, Chem. Soc. Rev., 2008, 37, 2077 RSC.
- C. P. Vinod, K. Wilson and A. F. Lee, J. Chem. Technol. Biotechnol., 2011, 86, 161 CrossRef CAS.
- H. van Bekkum, in Carbohydrate as Organic Raw Materials, ed. F. W. Lichtenthaler, Wiley VCH, Weinheim, 1990, p. 289 Search PubMed.
- G. Jenzer, M. S. Schneider, R. Wandeler, T. Mallat and A. Baiker, J. Catal., 2001, 199, 141 CrossRef CAS.
- A. M. Steele, J. Zhu and S. C. Tsang, Catal. Lett., 2001, 73, 9 CrossRef CAS.
- G. Jenzer, D. Sueur, T. Mallat and A. Baiker, Chem. Commun., 2000, 2247 RSC.
- Z. S. Hou, N. Theyssen and W. Leitner, Green Chem., 2007, 9, 127 RSC.
- Y. Uozumi and R. Nakao, Angew. Chem., Int. Ed., 2003, 42, 194 CrossRef CAS.
- Y. M. A. Yamada, T. Arakawa, H. Hocke and Y. Uozumi, Angew. Chem., Int. Ed., 2007, 46, 704 CrossRef CAS.
- A. Frassoldati, C. Pinel and M. Besson, Catal. Today, 2011, 173, 81 CrossRef CAS.
- A. Frassoldati, C. Pinel and M. Besson, Catal. Today, 2012 DOI:10.1016/j.cattod.2012.01.012.
- Z. Ma, H. Yang, Y. Qin, Y. Hao and G. Li, J. Mol. Catal. A: Chem., 2010, 331, 78 CrossRef CAS.
- X. Yang, X. Wang, C. Liang, W. Su, C. Wang, Z. Feng, C. Li and J. Qiu, Catal. Commun., 2008, 9, 2278 CrossRef CAS.
- X. Yang, X. Wang and J. Qiu, Appl. Catal., A, 2010, 382, 131 CrossRef CAS.
- A. Villa, D. Wang, N. Dimitros, D. Su, V. Trevisan and L. Prati, Catal. Today, 2010, 150, 8 CrossRef CAS.
- A. Villa, M. Plebani, M. Schiavoni, C. Milone, E. Piperopoulos, S. Galvagno and L. Prati, Catal. Today, 2012, 186, 76 CrossRef CAS.
- C. Keresszegi, D. Ferri, T. Mallat and A. Baiker, J. Catal., 2005, 234, 64 CrossRef CAS.
- A. F. Lee, Z. Chang, P. Ellis, S. F. J. Hackett and K. Wilson, J. Phys. Chem. C, 2007, 111, 18844 CAS.
- C. Keresszegi, T. Bürgi, T. Mallat and A. Baiker, J. Catal., 2002, 211, 244 CAS.
- D. M. Meier, A. Urakawa and A. Baiker, J. Phys. Chem. C, 2009, 113, 21849 CAS.
- H. G. J. de Wilt and H. S. van der Baan, Ind. Eng. Chem. Prod. Res. Dev., 1972, 11, 374 CAS.
- C. Keresszegi, T. Mallat and A. Baiker, New J. Chem., 2001, 25, 1163 RSC.
- R. Di Cosimo and G. M. Whitesides, J. Phys. Chem., 1989, 93, 768 CrossRef CAS.
- C. Keresszegi, J. D. Grunwaldt, T. Mallat and A. Baiker, Chem. Commun., 2003, 2304 RSC.
- J. D. Grunwaldt, C. Keresszegi, T. Mallat and A. Baiker, J. Catal., 2003, 213, 291 CrossRef CAS.
- A. P. Markusse, B. F. M. Kuster and J. C. Schouten, Catal. Today, 2001, 66, 191 CrossRef CAS.
- X. Yang, X. Wang, C. Liang, W. Su, C. Wang, Z. Feng, C. Li and J. Qiu, Catal. Commun., 2008, 9, 2278 CrossRef CAS.
- X. Yang, X. Wang and J. Qiu, Appl. Catal., A, 2010, 382, 131 CrossRef CAS.
- A. Villa, M. Plebani, M. Schiavoni, C. Milone, E. Piperopoulos, S. Galvagno and L. Prati, Catal. Today, 2012, 186, 76 CrossRef CAS.
- S. K. Desai, M. Neurock and K. Kourtakis, J. Phys. Chem. B, 2002, 106, 2559 CrossRef CAS.
- J. Greeley and M. Mavrikakis, J. Am. Chem. Soc., 2002, 124, 7193 CrossRef CAS.
- J. Greeley and M. Mavrikakis, J. Am. Chem. Soc., 2004, 126, 3910 CrossRef CAS.
- C. Hartnig and E. Spohr, Chem. Phys., 2005, 319, 185 CrossRef CAS.
- D. Cao, G.-Q. Lu, A. Wieckowski, S. A. Wasileski and M. Neurock, J. Phys. Chem. B, 2005, 109, 11622 CrossRef CAS.
- S. Kandoi, J. Greeley, M. A. Sanchez-Castillo, S. T. Evans, A. A. Gokhale, J. A. Dumesic and M. Mavrikakis, Top. Catal., 2006, 37, 17 CrossRef CAS.
- C.-Y. Niu, J. Jiao, B. Xing, G.-C. Wang and X.-H. Bu, J. Comput. Chem., 2010, 31, 2023 CAS.
- H.-F. Wang and Z.-P. Liu, J. Am. Chem. Soc., 2008, 130, 10996 CrossRef CAS.
- K. I. Gursahani, R. Alcala, R. D. Cortright and J. A. Dumesic, Appl. Catal., A, 2001, 222, 369 CrossRef CAS.
- R. Alcala, M. Mavrikakis and J. A. Dumesic, J. Catal., 2003, 218, 178 CrossRef CAS.
- J.-H. Wang, C. S. Lee and M. C. Lin, J. Phys. Chem. C, 2009, 113, 6681 CAS.
- D. Basaran, A. Genest and N. Rösch, J. Catal., 2012, 287, 210 CrossRef CAS.
- B. N. Zope, D. D. Hibbitts, M. Neurock and R. J. Davis, Science, 2010, 330, 74 CrossRef CAS.
- R. Kavanagh, X. Cao, W.-F. Lin, C. Hardacre and P. Hu, J. Phys. Chem. C, 2012, 116, 7185 CAS.
- C. Shang and Z.-P. Liu, J. Am. Chem. Soc., 2011, 133, 9938 CrossRef CAS.
- C. Michel, F. Auneau, F. Delbecq and P. Sautet, ACS Catal., 2011, 1, 1430 CrossRef CAS.
- X. Q. Qi, Z. D. Wei, L. L. Li, L. Li, M. B. Ji, Y. Zhang, M. R. Xia and X. L. Ma, J. Mol. Struct., 2010, 980, 208 CrossRef CAS.
- P. Korovchenko, C. Donze, P. Gallezot and M. Besson, Catal. Today, 2007, 121, 13 CrossRef CAS.
- G. Kresse and J. Hafner, Phys. Rev. B: Condens. Matter Mater. Phys., 1993, 47, 558 CrossRef CAS.
- J. P. Perdew and Y. Wang, Phys. Rev. B: Condens. Matter Mater. Phys., 1992, 45, 13244 CrossRef.
- P. E. Blöchl, Phys. Rev. B: Condens. Matter Mater. Phys., 1994, 50, 17953 CrossRef.
- G. Kresse and D. Joubert, Phys. Rev. B: Condens. Matter Mater. Phys., 1999, 59, 1758 CrossRef CAS.
- H. J. Monkhorst and J. D. Pack, Phys. Rev. B: Solid State, 1976, 13, 5188 CrossRef.
- G. Henkelman, B. P. Uberuaga and H. Jonsson, J. Chem. Phys., 2000, 113, 9901 CrossRef CAS.
- D. Sheppard, R. Terrell and G. Henkelman, J. Chem. Phys., 2008, 128, 134106 CrossRef.
- P. Dayal and P. Fleurat-Lessard, A chemist view on reaction path determination, to be published. Available at http://perso.ens-lyon.fr/paul.fleurat-lessard/ReactionPath.html.
- G. Henkelman and H. Jonsson, J. Chem. Phys., 1999, 111, 7010 CrossRef CAS.
- J. Kastner and P. Sherwood, J. Chem. Phys., 2008, 128, 014106 CrossRef.
- D. Loffreda, Y. Jugnet, F. Delbecq, J. C. Bertolini and P. Sautet, J. Phys. Chem. B, 2004, 108, 9085 CrossRef CAS.
- S. Völkening, K. Bedürfig, K. Jacobi, J. Wintterlin and G. Ertl, Phys. Rev. Lett., 1999, 83, 2672 CrossRef.
- C. Clay, S. Haq and A. Hodgson, Phys. Rev. Lett., 2004, 92, 046102 CrossRef CAS.
- W. Lew, M. C. Crowe, E. Karp and C. T. Campbell, J. Phys. Chem. C, 2011, 115, 9164 CAS.
- C. Panja, N. Saliba and B. E. Koel, Surf. Sci., 1998, 395, 248 CrossRef CAS.
- H. Zhao, J. Kim and B. E. Koel, Surf. Sci., 2003, 538, 147 CrossRef CAS.
- A. F. Lee, D. E. Gawthrope, N. J. Hart and K. Wilson, Surf. Sci., 2004, 548, 200 CrossRef CAS.
- R. Ferreira de Morais, PhD thesis, ENS Lyon, Ecole Doctorale de Chime de Lyon ED206, France, 2011.
- F. Delbecq and F. Vigné, J. Phys. Chem. B, 2005, 109, 10797 CrossRef CAS.
Footnotes |
| † Electronic supplementary information (ESI) available. See DOI: 10.1039/c2cy20363d |
| ‡ Present address: Laboratoire CEISAM - UMR CNRS 6230, Université de Nantes, 2 rue de la Houssiniére, BP 92208, 44322 Nantes Cedex 3, France. |
| This journal is © The Royal Society of Chemistry 2013 |

