NiO as a peculiar support for metal nanoparticles in polyols oxidation†
Alberto
Villa
a,
Gabriel M.
Veith
b,
Davide
Ferri
c,
Anke
Weidenkaff
c,
Kelly A.
Perry
b,
Sebastiano
Campisi
a and
Laura
Prati
*b
aDipartimento di Chimica, Università degli Studi di Milano, via Golgi 19, 20133 Milano, Italy. E-mail: Laura.Prati@unimi.it; Fax: +39 02503 14405; Tel: +39 02503 14357
bMaterials Science and Technology Division, Oak Ridge National Laboratory Oak Ridge, TN, 37831, USA
cEmpa - Laboratory for Solid State Chemistry and Catalysis, Überlandstrasse 129, CH-8600 Dübendorf, Switzerland
First published on 26th September 2012
Abstract
The peculiar influence of a NiO support was studied by preparing gold catalysts supported on NiO1−x–TiO2 x mixed oxides. PVA protected Au nanoparticles showed high activity when supported on NiO for the selective oxidation of glycerol and ethane-1,2-diol. A detailed characterization of the resulting Au catalysts revealed a preferential deposition of the metal nanoparticles on the NiO phase. However, the activity of Au on NiO1−x–TiO2 x decreased with respect to pure NiO and the selectivity evolved with changes in the support.
1. Introduction
The selective oxidation of alcohols and polyols to their corresponding carbonyl compounds, as catalyzed by supported noble metals, has recently been the subject of growing interest due to the strategic importance of this transformation.1,2 However, widely applicable catalytic systems are still far from being optimized or understood as the activity/selectivity results often depend on the nature of the substrate to be oxidized. Moreover, the catalysts often lack both chemo- and regio-selectivity. Gold nanoparticles, however, have demonstrated promising selectivities while their use is often limited by a low activity in the absence of a basic environment.3–5 Recent studies have shown that the support plays an important role in enhancing the activity and the selectivity of the gold catalysed reactions.6–11 Indeed, the support properties can tune the interaction with the metallic particles dispersed on or in it, thus modifying both the catalysts electronic and structural properties. In addition, the support can also provide different anchoring sites for the reactants, acting as an active and sometimes reactive surface.12–16Support effects are often difficult to prove due to concomitant changes of the metal particle diameter or differences in the distribution of metal particles over various supports.12–16 The use of preformed Au nanoparticles can bypass, to some extent, these problems. By using these preformed Au polyvinylalcohol (PVA) nanoparticles we were able to show that Au nanoparticles of similar size deposited on nanosized NiO (nNiO) showed significantly higher activity in alcohol oxidation than when supported on TiO2 or MgO.11 The different activities cannot be attributed to the difference in Au particle size (3.6 nm, 4.0 nm, 3.7 nm for NiO, TiO2 or MgO, respectively), or to the increase in basic site density, revealed for NiO. Instead they are attributed to an electronic modification that occurs when Au is deposited on nanosized NiO.
In order to extend and generalize the use of this peculiar support and to study in more detail the electronic effect of NiO on Au, a series of gold catalysts supported on nNiO, which was diluted with TiO2 (NiO1−x–TiO2 x (0 ≤ x ≤ 100)), have been prepared and tested for the oxidation of polyols (glycerol and ethane-1,2-diol). NiO–TiO2 nanocomposite materials have been widely used in photocatalysis,17–19 and applications such as electrochromism,20,21 solar cells,18,22 supercapacitors and gas sensing.23,24More recently NiO modified TiO2 systems have also been used as catalytic supports for Ru in the hydrogenation of xylose and glucose.25,26 Herein we will show that the dispersion of NiO nanoparticles on TiO2 can drastically influence the Au nanoparticles activity/selectivity depending on the relative amount of NiO/TiO2.
2. Experimental
2.1 Catalysts preparation
Ni(NO3)2·6H2O (5 × 10⁻⁴ M) (Sigma-Aldrich, purity > 99.9%) and urea (Sigma-Aldrich, purity > 99.5%) (urea/Ni 10![[thin space (1/6-em)]](https://www.rsc.org/images/entities/char_2009.gif) :
:![[thin space (1/6-em)]](https://www.rsc.org/images/entities/char_2009.gif) 1 mol mol−1) were added to 200 ml of water under magnetic stirring. The solution was kept stirring for 6 h at 80 °C. The Ni(OH)2 was separated from the solution by filtration and washed several times. The powder was dried at 60 °C for 12 h and then calcined at 300 °C for 3 h. The NiO/TiO2 supports were prepared by depositing various amounts of nanometric NiO (10, 50, 90 wt%) on TiO2 (Degussa P25) by using the above 5 × 10⁻⁴ M Ni(NO3)2·6H2O as a NiO precursor which was added to a suspension of TiO2. To confirm the predicted ratios, the elemental composition of NiO50–TiO2 50 was measured by X-ray fluorescence. Preparation of Au catalysts: solid NaAuCl4·2H2O (0.043 mmol) and 410 μl of a PVA solution (2 wt%) were added to 130 ml of H2O. After 3 min, 1.3 ml of 0.1 M NaBH4 solution was added to the yellow solution under vigorous magnetic stirring. A ruby red Au(0) sol was immediately formed. Within a few minutes from their generation, the colloids (acidified at pH 2, by sulphuric acid) were immobilized upon adding the support to the vigorously stirring solution. The amount of the support was controlled in order to obtain a final metal loading of 1 wt% (on the basis of quantitative loading of the metal on the support). The catalysts were filtered and washed several times and dried at 80 °C for 4 h.
1 mol mol−1) were added to 200 ml of water under magnetic stirring. The solution was kept stirring for 6 h at 80 °C. The Ni(OH)2 was separated from the solution by filtration and washed several times. The powder was dried at 60 °C for 12 h and then calcined at 300 °C for 3 h. The NiO/TiO2 supports were prepared by depositing various amounts of nanometric NiO (10, 50, 90 wt%) on TiO2 (Degussa P25) by using the above 5 × 10⁻⁴ M Ni(NO3)2·6H2O as a NiO precursor which was added to a suspension of TiO2. To confirm the predicted ratios, the elemental composition of NiO50–TiO2 50 was measured by X-ray fluorescence. Preparation of Au catalysts: solid NaAuCl4·2H2O (0.043 mmol) and 410 μl of a PVA solution (2 wt%) were added to 130 ml of H2O. After 3 min, 1.3 ml of 0.1 M NaBH4 solution was added to the yellow solution under vigorous magnetic stirring. A ruby red Au(0) sol was immediately formed. Within a few minutes from their generation, the colloids (acidified at pH 2, by sulphuric acid) were immobilized upon adding the support to the vigorously stirring solution. The amount of the support was controlled in order to obtain a final metal loading of 1 wt% (on the basis of quantitative loading of the metal on the support). The catalysts were filtered and washed several times and dried at 80 °C for 4 h.
2.2 Oxidation of polyols
Polyols oxidation: glycerol or ethylene glycol (0.3 M), and the catalyst (substrate/total metal = 1000 mol mol−1) were mixed in distilled water (total volume 10 ml) and 4 eq. of NaOH. The reactor was pressurized at 300 kPa of nitrogen and set to 50 °C. Once this temperature was reached, the gas supply was switched to oxygen and the reaction was initiated under stirring. Samples were removed periodically and analyzed by high-performance liquid chromatography (HPLC) using a column (Alltech OA-10308, 300 mm × 7.8 mm) with UV and refractive index (RI) detection to analyze the mixture of the samples. Aqueous H3PO4 solution (0.1 wt%) was used as the eluent. Products were identified by comparing with the original samples.2.3 Catalysts characterization
X-ray diffraction (XRD) data were collected using a PANalytical X'Pert Pro diffractometer using Cu Kα radiation. X-ray fluorescence (XRF) was measured on a Philips PW2400 spectrometer. Diffuse reflectance infrared Fourier transform (DRIFT) data were collected using a Vertex 70 spectrometer (Bruker Optics, Switzerland) equipped with a liquid-nitrogen cooled MCT detector and a Praying Mantis (Harrick, HDRV) cell and mirror unit. CO adsorption was performed by admitting 1 vol% CO/Ar (50 ml min−1) at room temperature on the dried samples (120 °C, 30 min, Ar flow). Prior to CO admittance, a spectrum of the material was obtained that served as the background. After 30 min adsorption time, the CO flow was replaced by a flow of Ar (50 ml min−1) to follow desorption. Data fit was obtained through the OPUS software (Bruker Optics). X-ray photoelectron spectroscopy (XPS) data were collected using a PHI 3056 spectrometer with an Al anode source operated at 15 kV and an applied power of 350 W with samples mounted on indium foil. Adventitious carbon was used to calibrate the binding energy shifts of the sample (C1s = 284.8 eV). 27 High resolution transmission electron microscopy (HRTEM) data were collected by dispersing the powders on a lacey carbon coated Cu grid and using a Hitachi HF3300 TEM/STEM equipped with a cold field-emission gun and operated at 300 kV. The particle size was determined from the analysis of at least 100 particles (a fewer particles were analysed for the largest Au clusters). The metal content was checked by ICP analysis on a Jobin Yvon JY24 on the filtrate.3. Results and discussion
Previous reports showed that Au nanoparticles, of similar size, deposited on nanosized NiO showed significantly higher activity for alcohol oxidation than those supported on TiO2 or MgO.11 To understand the peculiar effect of NiO on the activity and selectivity of supported gold nanoparticles, catalysts were prepared where the relative concentration of NiO was reduced by adding TiO2. Pre-formed Au-PVA protected nanoparticles (AuNPs)28 were then immobilized on NiO(1−x)–TiO2(x) (0 ≤ x ≤ 100) and tested in glycerol and ethylene glycol selective oxidation. The catalytic performance was compared to that of Au nanoparticles supported on pure TiO2 and pure NiO.Under basic conditions, when glycerol or ethane-1,2-diol was used as the substrate, the bare nNiO and nNiO on TiO2 were inactive. In comparison when benzyl alcohol was used as the substrate, nNiO had a low level of activity (TOF 10 h−1), although this reaction was run in water instead of cyclohexane.11 This shows the importance of the substrate structure and reaction conditions.
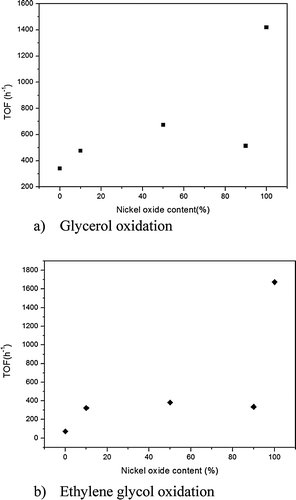
For glycerol oxidation (Table 1), the AuNPs on nNiO were very active catalysts, with a TOF of 1418 h−1, especially when compared to the activity of the same AuNPs immobilized on TiO2 (TOF 339 h−1) (Table 1). As expected AuNPs on NiO–TiO2 supports showed a decreased activity, but the decrease did not parallel the decrease in NiO concentration, i.e. the activity did not decrease by a commensurate amount based on the activity of pure NiO and TiO2 (TOF 673 h−1 for NiO90–TiO2 10, 513 h−1 for NiO50–TiO2 50 and 475 h−1 for NiO10–TiO2 90). In contrast the catalytic activity of gold catalysts grown in the physical mixtures of TiO2 and NiO was consistent with the estimated activity based on an independent contribution of Au/NiO and Au/TiO2 (Table 1). These results clearly indicate that the interface between NiO and TiO2 plays an important role in the observed properties. It should be noted that the particle sizes, discussed below, for all the catalysts, except for the 90/10 composite, are very similar thus particle sizes appear to have little effect on the observed activity of these samples.
| Catalyst | TOFb (1/h) | Selectivityc (%) | ||||
|---|---|---|---|---|---|---|
| Glyc | Gly | Tar | F | Lac | ||
| a Glycerol 0.3 M in water; 4 eq. of NaOH; metal/alcohol = 1/1000 mol mol−1; 300 kPa O2; T = 50 °C. b TOF calculated after 15 min reaction. c Selectivity calculated at 90% conversion Glyc = glycerate; Gly = glycolate; Tartr = tartronate; F = formate; Lac = lactate. d Expected values of TOFs on the basis of separate contribution of the two catalysts. | ||||||
| Au/NiO | 1418 | 55 | 11 | 9 | 7 | 15 |
| Au/NiO90–TiO2 10 | 513 | 70 | 8 | 7 | 7 | 7 |
| Au/NiO50–TiO2 50 | 673 | 72 | 5 | 12 | 4 | 5 |
| Au/NiO10–TiO2 90 | 475 | 75 | 5 | 9 | 5 | 5 |
| Au/TiO2 | 339 | 75 | 4 | 8 | 5 | 5 |
Au/NiO + Au/TiO2 (50![[thin space (1/6-em)]](https://www.rsc.org/images/entities/char_2009.gif) : :![[thin space (1/6-em)]](https://www.rsc.org/images/entities/char_2009.gif) 50) 50) |
829 (878)d | 71 | 7 | 8 | 5 | 7 |
Au/NiO + Au/TiO2 (90![[thin space (1/6-em)]](https://www.rsc.org/images/entities/char_2009.gif) : :![[thin space (1/6-em)]](https://www.rsc.org/images/entities/char_2009.gif) 10) 10) |
1251 (1310)d | 61 | 10 | 8 | 7 | 13 |
Au/NiO + Au/TiO2 (10![[thin space (1/6-em)]](https://www.rsc.org/images/entities/char_2009.gif) : :![[thin space (1/6-em)]](https://www.rsc.org/images/entities/char_2009.gif) 90) 90) |
441 (447)d | 74 | 6 | 8 | 5 | 5 |
Beyond the fundamental activity of the catalyst the selectivities varied as a function of support composition. The Au on pure NiO showed a relatively low selectivity to glycerate (55%); instead the reaction favored C–C cleavage which results in the formation of C1 (7% formate) and C2 products (11% glycolate and 15% lactate) (Table 1). In comparison, the selectivity of Au supported on TiO2 to glycerate increases (75%). In the composite NiO–TiO2 material the presence of as little as 10% TiO2 modifies the selectivity significantly reducing the fraction of C1 and C2 products (NiO10–TiO2 90 (75%) < NiO50–TiO2 50 (72%) < NiO90–TiO2 10 (70%)). Interestingly the Au on NiO50–TiO2 50 showed a peculiar selectivity, favoring the consecutive oxidation of glycerate to tartronic acid (12%) compared to 7–9% in all the other cases. In contrast the selectivity of the gold catalysts grown on physical mixtures of TiO2 and NiO followed the predicted trends based on the selectivity of pure Au/NiO and Au/TiO2 (Table 1). These results again demonstrate the unique properties of the NiO–TiO2 composite on the gold catalysts.
To further evaluate the activity of the composite materials the oxidation of ethane-1,2-diol was undertaken. Similar to glycerol oxidation the Au on pure NiO and on pure TiO2 showed the highest and the lowest activity respectively (Table 2). However, selectivity remained relatively constant with only a slight increase in C–C cleavage (4%) obtained for the Au/nNiO versus the other catalysts due to the formation of formic acid as a by-product. By decreasing the concentration of NiO, we observed a dramatic decrease in the catalytic activity. It should be noted that the Ni90 sample had much larger gold clusters (6.0 nm), compared to the other samples which were all around 3–4 nm diameters, which may explain the lower activity of this sample than would be predicted based on TiO2 loading. However, despite this anomaly with the Ni90 data the decrease in activity did not appear to correlate with TiO2 fraction. Indeed, the decrease was constant for all catalysts, unlike for the conversion of glycerol. Together the catalytic activity results for these two reactions show a reduction in activity, with the dilution of NiO, which does not decrease linearly (Fig. 1). Clearly the activity and selectivity of the catalysts evolve with support chemistry. To understand these changes detailed characterization studies were performed.
| Catalyst | TOFb (1/h) | Selectivityc (%) | ||
|---|---|---|---|---|
| Gly | Oxa | F | ||
| a Ethylene glycol 0.3 M in water; 4eq. of NaOH; metal/alcohol = 1/1000 mol mol−1; 300 kPa O2; T = 50 °C. b TOF calculated after 15 min reaction. c Selectivity calculated at 90% conversion Gly = glycolate; Oxa = oxalate; F = formate. | ||||
| Au/NiO | 1673 | 95 | 1 | 4 |
| Au/NiO90–TiO2 10 | 336 | 98 | 2 | 1 |
| Au/NiO50–TiO2 50 | 382 | 99 | 1 | — |
| Au/NiO10–TiO2 90 | 324 | 99 | 1 | — |
| Au/TiO2 | 72 | 99 | 1 | — |
Fig. 2a and b show TEM images of the Au/NiO and Au/TiO2 powders, respectively. Note that the NiO and TiO2 particles have distinct morphologies; the NiO forms as nano crystalline thin sheets (the curled/folded edges of the sheets appear as dark needles in the TEM image) whereas the TiO2 is primarily single crystal ∼20 nm cuboidal particles of both anatase and rutile crystallites, as determined by electron diffraction, which is consistent with Degussa P25.11
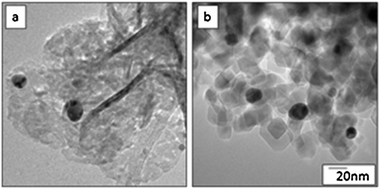 | ||
| Fig. 2 TEM images of (a) Au/NiO and (b) Au/TiO2. | ||
The NiO and TiO2 regions remain somewhat agglomerated and are not necessarily intimately mixed. Image analysis revealed discrete NiO and TiO2 regions of the catalyst due to an inhomogeneous distribution of NiO over the base TiO2, as shown in Fig. 3 and 4. However, the discrete NiO and TiO2 particle morphologies are retained when the powders are combined, as shown in Fig. 3, for the Au/NiO50–TiO2 50 catalyst. XRD data of Au/TiO2, Au/NiO and Au/NiO50–TiO2 50 (Fig. S4, ESI†) confirm the small size of NiO and its good dispersion on TiO2. Au/NiO50–TiO2 50 exhibits mainly the diffraction pattern of the TiO2 phase (mixed anatase and rutile). The NiO reflections appear only as weak features that are not consistent with the weight fraction of NiO when the XRD data are compared with those in a 1![[thin space (1/6-em)]](https://www.rsc.org/images/entities/char_2009.gif) :
:![[thin space (1/6-em)]](https://www.rsc.org/images/entities/char_2009.gif) 1 physical mixture.
1 physical mixture.
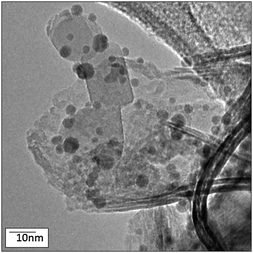 | ||
| Fig. 3 TEM image of Au/NiO50–TiO2 50. | ||
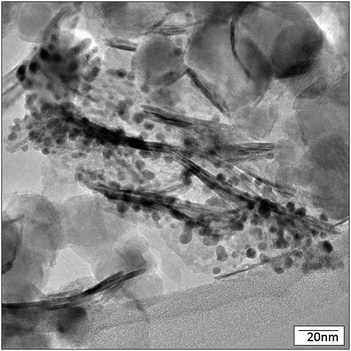 | ||
| Fig. 4 TEM image of Au/NiO50–TiO2 50 with Au particles. | ||
Interestingly, much of the Au catalyst is preferentially associated with the NiO sheets, as shown in Fig. 4; Fig. S1 and S3 (ESI†), which demonstrates that the NiO sheet surfaces stabilize the Au nanoparticles. Clearly the NiO has the right concentration or type of binding sites to stabilize the AuNPs. There are some gold particles on the TiO2, but the concentration of TiO2, versus NiO, is generally much lower.
From the viewpoint of the Au component, there was a slight growth of the AuPVA nanoparticles during the immobilization (2.6 for unsupported AuPVA and 3–4 for the immobilized ones) which appears to be independent, except for the Au/NiO90–TiO2 10, from the support (Table 3). The TEM data, Fig. 2 and Fig. S3 (ESI†), revealed that the average diameter of the gold particles was about 3–4 nm with the exception of the NiO90–TiO2 10 catalyst which had a mean AuNP size of 6 nm (Table 3). This could partly explain the decreased activity of this catalyst as noted before. Therefore, due to the similar sizes (excluding the NiO90–TiO2 10 sample) of these gold catalysts we can conclude that the contribution of the particle size was negligible to the observed catalytic properties.
| Catalysta | Statistical medianb (nm) | Deviation standard (σ) |
|---|---|---|
| a Au load was 1% in all cases. b Minimum of 100 particles analyzed. More for smaller particles. Size histograms for Au particle distributions on NiO–TiO2 are shown in Fig. S7 (ESI). c Ref. 34. | ||
| Unsupported Au NPs | 2.6 | 0.7 |
| Au/NiO | 3.6 | 1.0 |
| Au/NiO90–TiO2 10 | 6.0 | 1.7 |
| Au/NiO50–TiO2 50 | 4.3 | 1.1 |
| Au/NiO10–TiO2 90 | 3.1 | 0.9 |
| Au/TiO2c | 3.3 | 1.2 |
The diffuse reflectance IR Fourier transform (DRIFT) spectra of the adsorbed CO on the various samples at room temperature are shown in Fig. 5a–d. The spectrum of Au/TiO2 (d) displays two signals at 2109 and 2060 cm−1. The former signal is associated with the linearly adsorbed CO (COL) on defect sites of Au nanoparticles,29 whereas the latter one with that on Auδ− sites.30,31 The assignment of the signal at 2109 cm−1 to the adsorbed CO on Au atoms is corroborated by its complete loss upon flowing inert gas that is observed for all samples. The adsorbed CO on Au atoms is not stable at room temperature. The COL signal is clearly composed of two close signals that can be located at 2125 and 2108 cm−1 after curve fitting (see Fig. S5c, ESI†). At low CO coverage, i.e. at the early stages of contact of CO with the sample, the high energy signal appears first at 2142 cm−1 followed by the low energy one upon time-on-stream. Comparison with literature data reveals that CO adsorption may occur first on Auδ+ sites followed by adsorption on metallic Au upon reduction of Auδ+ sites. No signal can be attributed to CO coordinated to Ti4+ cations (ca. 2180 cm−1),32 but signals of adsorbed carbonate species appear at 1446, 1328, 1270 and 1164 cm−1.
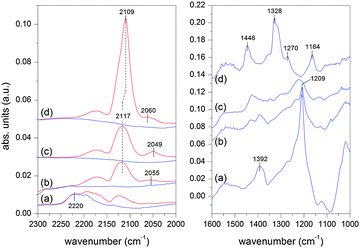 | ||
| Fig. 5 DRIFT spectra of the adsorbed CO at room temperature on (a) Au/NiO, (b) Au/NiO50–TiO2 50, (c) Au/NiO10–TiO2 90, and (d) Au/TiO2 in the carbonyl (left panel) and carbonate (right panel) regions. Blue spectra correspond to desorption (Ar flow). Spectra are offset for clarity. | ||
In contrast to Au/TiO2 the adsorption of CO on Au of Au/NiO is negligible, Fig. 5a.11 Rather CO adsorption seems to be directed to the support as indicated by the generation of a strong signal at 1209 cm−1 and a weaker one at 1392 cm−1. The signals could be associated with formation of bicarbonate species on NiO. However, it is interesting to note that adsorption of CO on bare NiO causes the formation of a signal at 1286 cm−1 (Fig. S6, ESI†) possibly of bidentate carbonate species while the signal observed in the presence of Au is silent. The origin of the latter signal is still unclear but could be associated with bicarbonate species in the vicinity of Au NPs produced upon spill-over of CO from Au to NiO. Clearly, adsorption of CO is favored on NiO. This is confirmed by the fact that in contrast to the COL signal, the signal gains intensity upon CO desorption suggesting that the adsorbed CO on Au is transferred to the NiO support. The major signal at 2220 cm−1 in the carbonyl region is tentatively attributed to perturbation of the Ni–O bond upon CO adsorption onto the support oxide. CO adsorption on Ni2+ is typically reported between 2220 and 2180 cm−1.33 Therefore, CO adsorption is strongly influenced by the presence of NiO, which reflects on the spectrum of CO adsorbed on Au. This adsorption likely influences the observed catalytic properties.
When CO is adsorbed on the samples with mixed NiO and TiO2 supports, the spectra exhibit a COL signal intensifying with increasing TiO2 content (see also Fig. S5, ESI†). CO adsorption on Au provides a signal at 2117 cm−1 on Au/NiO50–TiO2 50 and Au/NiO10–TiO2 90 whose position is likely given by the overlap of the weak COL signal at 2109 cm−1 with that of gas phase CO (2171 and 2125 cm−1). The signal associated with Auδ− species exhibits various energies but without any apparent NiO-content dependent trend.
Since the COL signal is observed on Au/TiO2 but not on Au/NiO and the Au nano-particle should be identical irrespective of the support (except for the NiO90–TiO2 10), the COL may be used to qualitatively titrate the fraction of Au particles deposited on NiO in an indirect way. Its intensity does not follow the relative variation of metal oxides, the intensity being similar to 90% or 50% TiO2 (Fig. S5, ESI†). On the other hand, the signal at 1209 cm−1 that can be taken as a fingerprint for CO adsorption on NiO vanishes proportionally to the NiO content (Fig. 5). Since COL probes Au and only Au NPs deposited on TiO2 provide the adsorbed CO, the spectra indicate that in the mixed support samples a large fraction of Au particles is in contact with NiO rather than with TiO2, thus suggesting a preferential interaction of AuNPs with NiO. This conclusion is in excellent agreement with HRTEM observation.
X-ray photoelectron spectroscopy (XPS) data were collected to understand the surface chemistry and oxidation states of the catalyst species. For all cases the gold 4f XPS data showed the formation of a single Au species located at 84.0 eV which is due to the formation of metallic Au0 catalyst clusters. The Ni2p XPS data collected for the Au–NiO catalyst, Fig. 6, top, reveal the presence of three Ni species after the synthesis of the gold clusters. The low energy Ni species (∼854.3) is due to the Ni–O bonds of NiO. The peak centred at 856 eV is due to the formation of Ni–OH, while the peak centred at around 857.5 eV is due to the formation of NiOOH. The assignment of these Ni peaks to the formation of hydroxides is supported by the O1s XPS data which show the formation of a strong feature at ∼529.1 eV, due to Ni–O, and a second peak at around 531 eV which is due to OH species. The Ti2p XPS data collected for the Au–TiO2 samples, Fig. 4, bottom, showed that all the Ti in the catalyst was Ti4+ which is consistent with TiO2. The O1s data for the Au–TiO2 catalyst show a large peak at ∼530.3 eV, due to Ti–O bonds, and a second, higher energy feature due to surface OH species. The samples containing a mixture of NiO and TiO2 show similar Ni and Ti features, i.e. NiO, NiOH, NiOOH and TiO2, and a smooth evolution of the O1s signal showing an increase in the TiO signal (530.3 eV) and a decrease in NiO signal (529.1 eV) due to an increase in TiO2 concentration. Interestingly there was no Ti signal in the 10% TiO2 sample. This is likely due to the low concentration of TiO2 and the lower surface area of the TiO2 relative to NiO which effectively lowers the available surface species for XPS analysis since most of the TiO2 is concentrated in the bulk versus the surface. These results confirm the TEM data and clearly show no mixing of NiO with the TiO2 base material. In addition, there is relatively no change in the surface chemistry of each of the oxide components which further indicates that the change in activity and selectivity is not due to changes of oxide electronic structures, rather it is due to interactions with the reagents or with the NiO as evident from the FTIR data.
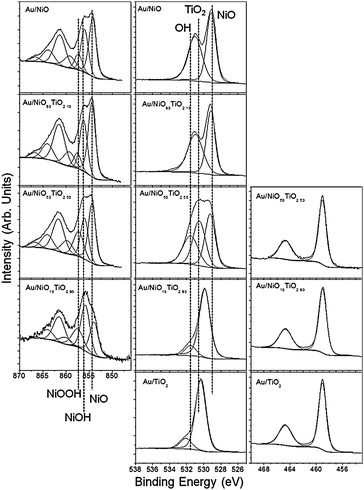 | ||
| Fig. 6 Ni2p (left), O1s (center), and Ti2p (right) XPS spectra of the Au/NiO–TiO2 catalysts. | ||
4. Conclusions
The experimental data showed that NiO represents a peculiar support able to increase the activity in the selective oxidation of polyols. As in the case of alcohol oxidation the enhanced activity of AuNPs on NiO is not attributed to the basicity of the support.11 Indeed the Au/NiO appeared more active than Au/TiO2 even in a strongly basic environment. The data clearly show no change in the catalysts electronic structure (XPS) but show significant changes in the interaction of the supports with CO as a probe molecule. In addition the IR and HRTEM data clearly indicate that the gold preferentially deposits on the NiO portion of the support material.The activity modification is likely attributed to a changed role of the support. TiO2, when in contact with NiO, changes the interactions between the NiO and the AuNPs thus changing the overall catalytic activity. The nearly constant activity for ethane-1,2-diol oxidation and a non-linear decrease in glycerol oxidation, over the gold catalysts, may be attributed to the preferential confinement of gold particles to the NiO, versus the TiO2. The confinement of Au to NiO may introduce new interfaces in close proximity to the TiO2 which could influence the diffusion and binding of reactants during the reaction. This confinement effect is not evident for the physical mixture where there are large domains of active area that are not influenced by the TiO2. These results further indicate the unique role of NiO in mediating catalytic activity of supported gold catalysts which require further elucidation.
Acknowledgements
A portion of this research was sponsored by the Laboratory Directed Research and Development Program of Oak Ridge National Laboratory, managed by UT-Battelle, LLC, for the U.S. Department of Energy (GMV, KAP) and was performed at Oak Ridge National Laboratory's SHaRE User Facility (TEM), which is sponsored by the Scientific User Facilities Division, Office of Basic Energy Sciences, U.S. Department of Energy. Fondazione Cariplo and Empa are also gratefully acknowledged for financial support. Dr S. Yoon and O. Brunko are thanked for XRD and XRF measurements, respectively.Notes and references
- T. Mallat and A. Baiker, Chem. Rev., 2004, 104, 3037 CrossRef CAS.
- M. Besson and P. Gallezot, Catal. Today, 2000, 57, 127 CrossRef CAS.
- S. Carrettin, P. McMorn, P. Johnston, K. Griffin, C. J. Kiely and G. J. Hutchings, Phys. Chem. Chem. Phys., 2003, 5, 1329 RSC.
- F. Porta and L. Prati, J. Catal., 2004, 224, 397 CrossRef CAS.
- S. Demirel-Gulen, M. Lucas and P. Claus, Catal. Today, 2005, 102–103, 166 CrossRef.
- A. Abad, P. Conception, A. Corma and H. Garcia, Angew. Chem., Int. Ed., 2005, 44, 4066 CrossRef CAS.
- J. Yang, Y. Guan, T. Verhoeven, R. van Santen, C. Li and E. J. M. Hensen, Green Chem., 2009, 11, 322 RSC.
- A. Villa, G. M. Veith and L. Prati, Angew. Chem., Int. Ed., 2010, 49, 4499 CrossRef CAS.
- W. Fang, J. Chen, Q. Zhang, W. Deng and Y. Wang, Chem.–Eur. J., 2011, 17, 1247 CrossRef CAS.
- T. Mitsudome, Ak. Noujima, T. Mizugaki, K. Jitsukawa and K. Kaneda, Adv. Synth. Catal., 2009, 351, 1890 CrossRef CAS.
- A. Villa, C. E. Chan-Thaw, G. M. Veith, K. L. More, D. Ferri and L. Prati, ChemCatChem, 2011, 3, 1612 CrossRef CAS.
- A. Villa, D. Wang, P. Spontoni, R. Arrigo, D. Su and L. Prati, Catal. Today, 2010, 157, 89 CrossRef CAS.
- L. Prati, A. Villa, C. E. Chan-Thaw, R. Arrigo, D. Wang and D. S. Su, Faraday Discuss., 2011, 152, 353 RSC.
- C. E. Chan-Thaw, A. Villa, G. M. Veith, K. Kailasam, L. A. Adamczyk, R. R. Unocic, L. Prati and A. Thomas, Chem.–Asian J., 2012, 7, 387 CrossRef CAS.
- C. E. Chan-Thaw, A. Villa, L. Prati and A. Thomas, Chem.–Eur. J., 2011, 17, 1052 CrossRef CAS.
- T. Sreethawong, Y. Suzuki and S. Yoshikawa, Int. J. Hydrogen Energy, 2005, 30, 1053 CrossRef CAS.
- H. Arakawa and K. Sayama, Res. Chem. Intermed., 2000, 26(2), 145 CrossRef CAS.
- T. Kamegawa, T. H. Kim, J. Morishima, M. Matsuoka and M. Anpo, Catal. Lett., 2009, 129, 7 CrossRef CAS.
- A. Al-Kahlout and M. A. Aegerter, Sol. Energy Mater. Sol. Cells, 2007, 91, 213 CrossRef CAS.
- H. Huang, S. X. Lu, W. K. Zhang, Y. P. Gan, C. T. Wang, L. Yu and X. Y. Tao, J. Phys. Chem. Solids, 2009, 70, 745 CrossRef CAS.
- M. Martini, G. E. S. Brito, M. C. A. Fantini, A. F. Craievich and A. Gorenstein, Electrochim. Acta, 2001, 46, 2275 CrossRef CAS.
- Y. M. Lee, C. H. Hsu and H. W. Chen, Appl. Surf. Sci., 2009, 255, 4658 CrossRef CAS.
- Y. Xie, C. Huang, L. Zhou, Y. Liu and H. Huang, Compos. Sci. Technol., 2009, 69, 2108 CrossRef CAS.
- K. I. Arshak, L. M. Cavanagh, I. Gaidan, E. G. Moore and S. A. Clifford, IEEE Sens. J., 2007, 7(6), 925 CrossRef CAS.
- D. K. Mishra, J.-M. Lee, J.-S. Chang and J.-S. Hwang, Catal. Today, 2012, 185, 104 CrossRef CAS.
- M. Yadav, D. K. Mishra and J.-S. Hwang, Appl. Catal., A, 2012, 425–426, 110 CrossRef CAS.
- J. F. Moulder, W. F. Stickle, P. E. Solbol and K. D. Bomben, Handbook of X-ray Photoelectron Spectroscopy, Perkin-Elmer Corp., 1992 Search PubMed.
- L. Prati and G. Martra, Gold Bull., 1999, 32, 96 CrossRef CAS.
- F. Boccuzzi, A. Chiorino, S. Tsubota and M. Haruta, J. Phys. Chem., 1996, 100, 3625 CrossRef CAS.
- M. S. Chen and D. W. Goodman, Science, 2004, 306, 252 CrossRef CAS.
- K. Charakova, M. Mihaylov, S. vanova, M. A. Centeno and K. Hadjiivanov, J. Phys. Chem. C, 2011, 115, 21273 Search PubMed.
- C. Morterra, J. Chem. Soc., Faraday Trans., 1998, 84, 1617 Search PubMed.
- K. I. Hadjiivanov and G. N. Vayssilov, Adv. Catal., 2002, 47, 307 CrossRef CAS.
- N. Dimitratos, A. Villa, C. L. Bianchi, L. Prati and M. Makkee, Appl. Catal., A, 2006, 311, 185 CrossRef CAS.
Footnote |
| † Electronic supplementary information (ESI) available. See DOI: 10.1039/c2cy20370g |
| This journal is © The Royal Society of Chemistry 2013 |

