DOI:
10.1039/C2FO30042G
(Paper)
Food Funct., 2013,
4, 162-174
Encapsulation and release of hydrophobic bioactive components in nanoemulsion-based delivery systems: impact of physical form on quercetin bioaccessibility
Received 27th February 2012, Accepted 15th November 2012
First published on 16th November 2012
Abstract
Many bioactive compounds are hydrophobic materials that are crystalline at ambient and body temperatures, which reduces their bioavailability and poses challenges to their successful incorporation into pharmaceuticals and functional foods. The aim of this study was to determine whether a hydrophobic crystalline bioactive component (quercetin) could be successfully incorporated into nanoemulsion-based delivery systems, and to evaluate the extent to which these delivery systems altered its bioaccessibility. The maximum amount of soluble quercetin that could be loaded into a carrier oil phase (medium chain triglycerides, MCT) at ambient temperature was CSat ≈ 0.15 mg mL−1. At quercetin concentrations <CSat, nanoemulsions remained stable throughout 30 days storage at 5, 20 and 37 °C, i.e., no droplet growth, droplet creaming, or crystal formation were observed. At quercetin concentrations >CSat, nanoemulsions remained physically stable (no droplet growth or creaming), but quercetin crystals formed in the samples during storage. The bioaccessibility of quercetin was determined using an in vitro digestion model simulating the mouth, stomach, and small intestine. A higher percentage of quercetin was solubilized in the micelle phase after small intestine digestion when it was incorporated in nanoemulsions than when it was dispersed in either bulk oil or pure water. The bioaccessibility of crystalline quercetin was less than that of dissolved quercetin. The knowledge gained from this study is valuable for the rational design of delivery systems to incorporate crystalline hydrophobic bioactive compounds into pharmaceuticals and functional foods, and to increase their bioaccessibility.
1 Introduction
Quercetin (3,3′,4′,5,7-pentahydroxyflavone) is a hydrophobic flavonoid present in many fruits and vegetables (Fig. 1). It has been reported to exhibit a wide range of biological activities, including anti-oxidant, anti-cancer, anti-microbial, anti-viral, anti-aging, anti-thrombotic, and metal chelating activities.1,2 Quercetin therefore has potential as a pharmaceutical or nutraceutical agent. Nevertheless, there are several challenges that must be overcome before quercetin can be successfully incorporated into drug preparations or functional foods: it has a low solubility in both water and oil; it is crystalline at ambient and body temperatures; and it has a low bioavailability.3–5 Consequently, it is necessary to develop effective delivery systems to encapsulate and protect quercetin during storage, while releasing it at the appropriate site of action within the gastrointestinal tract after ingestion.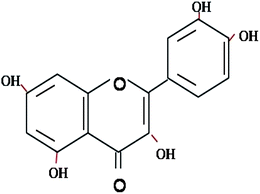 |
| | Fig. 1 Chemical structure of quercetin – a hydrophobic flavonoid with biological activity. | |
A wide variety of colloidal delivery systems have been developed to encapsulate hydrophobic compounds, including microemulsions, nanoemulsions, solid lipid nanoparticles, multilayer emulsions, polymeric nanoparticles, inclusion complexes, and filled hydrogel particles.6–9 In this study, we focus on the utilization of nanoemulsions as delivery systems for quercetin. Oil-in-water nanoemulsions are thermodynamically unstable systems that consist of small lipid droplets (r < 100 nm) dispersed within an aqueous medium.10,11 The relatively small size of the droplets in nanoemulsions provides them with a number of potential advantages over conventional emulsions: high optical clarity; good stability to gravitational separation and particle aggregation; and, increased bioavailability.12 On the other hand, there is a limit to the amount of a bioactive component that can be successfully incorporated into a nanoemulsion before crystals are formed, which may lead to physical instability of the delivery system as well as reducing the bioaccessibility of the encapsulated component.13
The aim of this study was to design effective nanoemulsion-based delivery systems to encapsulate quercetin, and to establish the influence of these delivery systems on quercetin bioaccessibility using an in vitro model to simulate the gastrointestinal tract. The knowledge gained from this research should improve our understanding of the major factors that influence the formation, stability, and utilization of nanoemulsions as delivery systems for crystalline bioactive compounds within pharmaceutical and functional food products.
2 Materials and methods
2.1 Materials
Quercetin hydrate powder (QC), lipase from porcine pancreas (Type II), bile extract (porcine), ammonium nitrate (NH4NO3), potassium phosphate (KH2PO4), potassium chloride (KCl), potassium citrate (K3C6H5O7·H2O), uric acid sodium salt (C5H3N4O3Na), lactic acid sodium salt (C3H5O3Na), gastric mucin (from porcin stomach), pepsin (from porcine gastric mucosa), analytical grade hydrochloric acid, monobasic and dibasic phosphate were purchased from Sigma-Aldrich Co. (St. Louis MO, USA). Food grade β-lactoglobulin (β-Lg) was obtained from Davisco Foods International Inc. (Le Sueur, MN). Medium chain triglyceride (Miglyol 812N) (MCT) was purchased from Sasol Germany (Gmbh, Witten, Germany). Urea (H2NCONH2) was purchased from Fluka Biochemika (Fluka-Biochemika, USA). Sodium chloride (NaCl), chloride acid (HCl) and dimethyl sulphoxide (DMSO) were purchased from Fisher Scientific (Thermo Fisher Scientific Inc., USA). Distilled and deionized water from a water purification system (Nanopure Infinity, Barnstead International, Dubuque, IA) was used for the preparation of all solutions.2.2 Quercetin determination and quantification
Quantitative analysis of the amount of quercetin present in samples was performed using UV-visible spectrophotometry (Evolution Array, Thermo Scientific, USA). Standard curves were made using a 1 mM quercetin solution as a stock solution and DMSO as a blank. Calibration curves were linear (r2 ≥ 0.995) over the quercetin concentration ranges used (0 to 9 μg mL−1). Calibration curves prepared on different days were reproducible: the slope of the best-fit line was 0.087 ± 0.012 cm−1 (μg mL−1)−1 and the intercept was 0.003 ± 0.002 cm−1. The limit of detection was 0.049 ± 0.001 μg mL−1 and the limit of quantification was 0.10 ± 0.03 μg mL−1.2.3 Quercetin solubility
The solubility of quercetin crystals in an oil phase (MCT) was ascertained using UV-visible spectrophotometry measurements. Two types of spectrophotometry measurements were used: (i) Absorbance (372 nm) measurements were used to measure the concentration of quercetin solubilized in the oil phase;14 (ii) Turbidity (600 nm) measurements were used to detect the presence of quercetin crystals in the oil phase.2.3.1 Temperature-scanning turbidity measurements. Initially, the influence of temperature on quercetin solubility in oil was ascertained by measuring the turbidity as a function of temperature. Briefly, a known amount of crystalline quercetin was dispersed within MCT oil (0.25 mg quercetin per mL MCT) at room temperature, which led to the formation of a highly turbid colloidal suspension due to the fact some of the quercetin did not dissolve. The turbidity of these samples was then measured as the temperature was increased from 25 to 100 °C using an UV-visible spectrophotometer (Evolution Array, Thermo Scientific, USA). This experiment indicated that the system became transparent around 85 °C, and so we heated the samples above this temperature to dissolve the quercetin crystals in subsequent studies.
2.3.2 Isothermal turbidity measurements. A series of samples with different amounts of quercetin dispersed in MCT were prepared at ambient temperature, heated to 90 °C for 30 minutes with continuous stirring, and then stored at 90 °C for another 40 minutes. Samples were then sonicated for 10 min and placed back at 90 °C for a further 40 minutes to facilitate quercetin dissolution. The resulting samples were cooled to three different temperatures (5, 20 and 37 °C) and stored at these temperatures for 72 hours. After storage, the samples were inverted to ensure they were homogeneous, and then their turbidity was evaluated at 600 nm using a UV-visible spectrophotometer (Evolution Array, Thermo Scientific, USA).
2.3.3 Isothermal absorbance measurements. After the turbidity measurements had been completed, the amount of quercetin that was dissolved in the MCT oil was evaluated using absorbance measurements. Samples were centrifuged at 4000 rpm for 30 min to remove any undissolved crystals and then diluted with DMSO (ratio 1![[thin space (1/6-em)]](https://www.rsc.org/images/entities/char_2009.gif) :
:![[thin space (1/6-em)]](https://www.rsc.org/images/entities/char_2009.gif) 25). Aliquots of supernatant were taken and their absorbance was measured at 372 nm using a UV-visible spectrophotometer (Evolution Array, Thermo Scientific, USA). The amount of dissolved quercetin present was determined from the absorbance values using a standard curve. DMSO was used as a blank for these measurements.
25). Aliquots of supernatant were taken and their absorbance was measured at 372 nm using a UV-visible spectrophotometer (Evolution Array, Thermo Scientific, USA). The amount of dissolved quercetin present was determined from the absorbance values using a standard curve. DMSO was used as a blank for these measurements. 2.4 Continuous and dispersed phase preparation
A continuous phase was prepared by dispersing 1.0 wt% powdered β-lactoglobulin into aqueous buffer solution (5 mM phosphate, pH 7.0) at ambient temperature, stirring for 2 h, and then storing overnight at 4 °C. A dispersed phase was prepared by dispersing quercetin (0, 0.1, 0.5 or 1 mg mL−1) into MCT at ambient temperature and then heating the mixture to 90 °C (with stirring for 30 minutes, storage for 40 minutes, sonication for 10 min, then storage for 40 minutes).2.5 Nanoemulsion preparation
The oil and aqueous phases were adjusted to a temperature of around 50–60 °C prior to homogenization. This temperature was selected since the oil and aqueous phases remained transparent for the duration of the emulsion preparation procedures, indicating that quercetin crystals were not formed and that the protein did not form large aggregates due to thermal denaturation. A coarse emulsion was prepared by homogenizing 10 wt% oil phase with 90 wt% aqueous phase (1.0 wt% β-Lg, pH 7.0) using a high-speed mixer for 2 min (M133/1281-0, Biospec Products, Inc. ESGC, Switzerland). This coarse emulsion was then passed through a high pressure microfluidizer (Microfluidics M-110Y, Newton, MA) with a specific interaction chamber (F20Y 75 μm) for five passes at 12![[thin space (1/6-em)]](https://www.rsc.org/images/entities/char_2009.gif) 000 psi.
000 psi.2.6 Nanoemulsion characterization
2.6.1 Particle size and charge. The particle size distributions of nanoemulsions were measured using a dynamic light scattering instrument (NanoZS, Malvern Instruments Ltd, UK). The electrical charge (ζ-potential) on nanoemulsion droplets was measured using a particle electrophoresis instrument (NanoZS, Malvern Instruments Ltd, UK). Samples were diluted (≈1![[thin space (1/6-em)]](https://www.rsc.org/images/entities/char_2009.gif) :
:![[thin space (1/6-em)]](https://www.rsc.org/images/entities/char_2009.gif) 1000) with aqueous buffer solution (5 mM phosphate, pH 7.0) prior to analysis to avoid multiple scattering effects.
1000) with aqueous buffer solution (5 mM phosphate, pH 7.0) prior to analysis to avoid multiple scattering effects. 2.6.2 Physical state of quercetin. The formation of quercetin crystals within the nanoemulsions was evaluated by simple visual observations and by polarized light microscopy. A yellow sediment was observed at the bottom of test tubes containing some of the nanoemulsions after they were stored under controlled conditions. The amount of quercetin still dispersed within the nanoemulsions was evaluated using a spectrophotometer method. An aliquot of nanoemulsion was taken from the middle of the test tubes (avoiding collecting any sediment), dissolved in DMSO (ratio 1![[thin space (1/6-em)]](https://www.rsc.org/images/entities/char_2009.gif) :
:![[thin space (1/6-em)]](https://www.rsc.org/images/entities/char_2009.gif) 25), and then filtered using a 25 mm diameter syringe filter (1–10 mL, EMD Millipore Corp. USA). The quercetin concentration was then determined by measuring the absorbance of the samples at 372 nm using a UV-visible spectrophotometer (Evolution Array, Thermo Scientific, USA). The percentage of quercetin (QC(%)) encapsulated within the nanoemulsions was then calculated using the following equation:
25), and then filtered using a 25 mm diameter syringe filter (1–10 mL, EMD Millipore Corp. USA). The quercetin concentration was then determined by measuring the absorbance of the samples at 372 nm using a UV-visible spectrophotometer (Evolution Array, Thermo Scientific, USA). The percentage of quercetin (QC(%)) encapsulated within the nanoemulsions was then calculated using the following equation:| |  | (1) |
where QCS is the quercetin concentration remaining dispersed within the nanoemulsion at a specific time and QCI is the initial quercetin concentration.The presence of crystalline material within the yellow sediment formed at the bottom of the test tubes during storage was observed by polarized light microscopy. The presence of crystals in samples that had passed through the gastrointestinal model was also determined by polarized light microscopy. After the small intestine phase had been completed a sample was collected and centrifuged (25![[thin space (1/6-em)]](https://www.rsc.org/images/entities/char_2009.gif) 000 rpm for 30 min at 10 °C). The resulting pellet was collected, diluted with buffer solution (PBS 5 mM, pH 7) and then its microstructure was measured using an optical microscope with polarizers (Nikon D-Eclipse C1 80i microscopy, Nikon, Melville, NY).
000 rpm for 30 min at 10 °C). The resulting pellet was collected, diluted with buffer solution (PBS 5 mM, pH 7) and then its microstructure was measured using an optical microscope with polarizers (Nikon D-Eclipse C1 80i microscopy, Nikon, Melville, NY).
2.7 In vitro digestion model (pH stat)
A dynamic in vitro gastrointestinal model was used to study the influence of nanoemulsion composition on lipid digestion and quercetin bioaccessibility. The multistage model used was based on those reported previously, with some modifications.15–20 These experiments were all carried out at 37 °C to mimic body temperature.2.7.1 Oral phase. Artificial saliva (Table 1) was prepared according to a protocol described previously.21,22 The concentration of mucin used in this study was 0.5 wt% (5 g L−1), a concentration that has previously been reported to simulate the viscosity of human saliva.21 Artificial saliva was adjusted to pH 6.8 using 0.1 M HCl or NaOH solutions. 20 mL of artificial saliva and 20 mL of sample were loaded into a flask covered with aluminum foil, and then shaken at 95 rpm for 15 min (Innova 4080 Incubator Shaker, New Brunswick Scientific, NJ, USA).
Table 1 Chemical composition of artificial saliva used in the in vitro digestion model
| Chemical name | Chemical formula | Concentration (g L−1) |
|---|
| Sodium chloride | NaCl | 1.594 |
| Ammonium nitrate | NH4NO3 | 0.328 |
| Potassium phosphate | KH2PO4 | 0.636 |
| Potassium chloride | KCl | 0.202 |
| Potassium citrate | K3C6H5O7·H2O | 0.308 |
| Uric acid sodium salt | C5H3N4O3Na | 0.021 |
| Urea | H2NCONH2 | 0.198 |
| Lactic acid sodium salt | C3H5O3Na | 0.146 |
| Mucin (porcine) | — | 5 |
| Water | H2O | Remainder |
2.7.3 Small intestine phase. The “chyme” sample collected from the gastric phase was then mixed with simulated intestinal fluids to mimic small intestinal conditions. Initially, 30 mL of chyme sample was adjusted to pH 7.0 using NaOH or HCl solutions. This sample was then mixed with 5.0 mL of bile extract solution (187.5 mg bile extract dissolved in phosphate buffer, pH 7.0, 37 °C), 1.0 mL of CaCl2 solution (188 mM CaCl2 in double distilled water, 37 °C) and 1.0 mL of NaCl solution (5625 mM NaCl in phosphate buffer, pH 7.0, 37 °C) and then stirred continuously. The pH of the mixture was adjusted back to pH 7.0 if required. 1.5 mL of freshly prepared lipase suspension (60 mg lipase powder dispersed in phosphate buffer, pH 7.0, 37 °C) was then added to the mixture. A pH-stat automatic titration unit (Metrohm, USA Inc.) was used to automatically monitor the pH and maintain it at pH 7.0 by titrating appropriate concentrations of NaOH solution. The volume of NaOH added to samples was recorded and used to calculate the concentration of free fatty acids (FFA) generated by lipolysis. The amount of free fatty acids released was calculated using the following equations:| |  | (2) |
| |  | (3) |
After each digestion, the size and ζ-potential of the samples was measured using the methods described previously (Section 2.6).
2.8 Bioaccessibility determination
The bioaccessibility of quercetin was evaluated after the samples had passed through the simulated small intestine phase of the in vitro gastrointestinal model. Samples were centrifuged (25![[thin space (1/6-em)]](https://www.rsc.org/images/entities/char_2009.gif) 000 rpm per 30 min at 10 °C) using an ultracentrifuge (Sorvall WX Ultra Series Centrifuge, Thermo Scientific, USA). After centrifugation, the samples separated into an opaque sediment phase at the bottom and a clear micelle phase at the top. Aliquots (5 mL) were collected from the supernatant (“micelle phase”) and vortexed with DMSO (dilution 1
000 rpm per 30 min at 10 °C) using an ultracentrifuge (Sorvall WX Ultra Series Centrifuge, Thermo Scientific, USA). After centrifugation, the samples separated into an opaque sediment phase at the bottom and a clear micelle phase at the top. Aliquots (5 mL) were collected from the supernatant (“micelle phase”) and vortexed with DMSO (dilution 1![[thin space (1/6-em)]](https://www.rsc.org/images/entities/char_2009.gif) :
:![[thin space (1/6-em)]](https://www.rsc.org/images/entities/char_2009.gif) 25) and then filtered using a 25 mm diameter syringe filter (1–10 mL, EMD Millipore Corp. USA). After filtration, the samples were centrifuged at 4000 rpm at room temperature for 10 min (Fisher Scientific 225A, Fisher) and the supernatant was analyzed by measuring the absorbance at 372 nm using UV-visible spectrophotometry (Evolution Array, Thermo Scientific, USA). The bioaccessibility (BA) was determined using the following equation:
25) and then filtered using a 25 mm diameter syringe filter (1–10 mL, EMD Millipore Corp. USA). After filtration, the samples were centrifuged at 4000 rpm at room temperature for 10 min (Fisher Scientific 225A, Fisher) and the supernatant was analyzed by measuring the absorbance at 372 nm using UV-visible spectrophotometry (Evolution Array, Thermo Scientific, USA). The bioaccessibility (BA) was determined using the following equation:| |  | (4) |
where, QCM is the quercetin concentration in micelle phase and QCI is the QC initial concentration dissolved in fresh NE, MCT or water.2.9 Data analysis
All experiments were performed at least two or three times. The results were then reported as averages and standard deviations of these measurements.3 Results and discussion
3.1 Quercetin solubility in carrier oil
Knowledge of the physicochemical properties of an active component is important for the successful design and fabrication of an effective delivery system. The relevant physicochemical properties of quercetin reported in a chemical database (http://SciFinder.com) are tabulated in Table 3. The melting point of pure quercetin is relatively high (>310 °C), which means that it exists in solid form at ambient temperatures and so has to be dissolved into a carrier liquid before it can be incorporated into liquid nanoemulsions. An important characteristic of quercetin is that it contains phenolic groups capable of becoming ionized (pKa ≈ 6.3) at high pH values. Quercetin has a relatively low water-solubility (<1 g L−1) and high oil–water distribution coefficient (log D ≈ 2) at low pH values where it is non-ionized (pH ≪ pKa), but its water-solubility increases and its oil-water distribution coefficient decreases at higher pH values where it becomes ionized (i.e., pH around and above pKa). The low water-solubility of quercetin currently limits its use as a bioactive ingredient in many food and nutraceutical products3–5 These properties highlight some of the challenges associated with incorporating quercetin into functional food systems, i.e., its low water solubility, high melting point, and pH dependent solubility characteristics. Food and beverage manufacturers must carefully formulate a delivery system so that the quercetin does not crystallize during storage, but is released after ingestion.
Table 3 Physicochemical properties of quercetin extracted from a chemical data base (http://SciFinder.com). Here D is the octanol–water distribution coefficient, which is the concentration of compound in octanol divided by the concentration of all species (ionized and non-ionized) in water. The water solubility* was estimated from the measured oil solubility and the reported log D values
| Molar mass | 302.2 | g mol−1 |
| Melting point | 320 | °C |
| Enthalpy of fusion | 41.5 | kJ mol−1 |
| pKa | 6.31 | |
| Density | 1799 | kg m−3 |
| Molar volume | 167.9 | cm3 mol−1 |
| Solubility and partitioning | pH |
| 1 | 2 | 3 | 4 | 5 | 6 | 7 | 8 |
| log D | 1.99 | 1.99 | 1.99 | 1.99 | 1.96 | 1.78 | 1.08 | −0.26 |
| Water solubility* (mg L−1) | 1.53 | 1.53 | 1.53 | 1.53 | 1.64 | 2.49 | 12.5 | 273 |
3.2 Quercetin solubility characteristics
One of the main factors determining the efficacy of a delivery system is the maximum amount of bioactive component that can be successfully solubilized within it. Below this saturation level the bioactive component is fully solubilized, but above this level it may form a separate solid phase, i.e., a crystalline or amorphous phase. The physical state of a bioactive component is known to have a major impact on its bioaccessibility.24 Our aim in this section was therefore to determine the saturation concentration of quercetin within the carrier oil phase (medium chain triglyceride, MCT) used to fabricate the nanoemulsions and to estimate the total amount of quercetin that could be successfully solubilized within the nanoemulsions at saturation. We also aimed to characterize the thermal behavior of the quercetin crystals within the nanoemulsions.3.2.1 Temperature dependence of quercetin dissolution. During the formation of nanoemulsions it is usually important that all of the components are in a liquid state, otherwise the narrow chambers within a high pressure homogenizer may be blocked.25 As mentioned earlier, quercetin has a relatively high melting point (Tm > 310 °C) and so it is crystalline at ambient temperature (Table 1). In principle, quercetin could be heated above its melting point to convert it into a liquid state and then homogenized,26 but this is impractical because it is difficult to carry out homogenization at such high temperatures and there may also be some thermal degradation of quercetin at elevated temperatures. Consequently, it is usually necessary to dissolve the quercetin within an appropriate solvent prior to homogenization. Quercetin has a higher solubility in lipid phases than in aqueous phases (Table 1) and so we initially dissolved it within the oil phase. The solubility of crystalline materials within carrier oils increases with increasing temperature, and so we carried out a preliminary experiment to determine the influence of heat on the dissolution of quercetin crystals in MCT oil. A dispersion of quercetin crystals in MCT (0.25 mg mL−1) was prepared at ambient temperature and then its turbidity (at 600 nm) was measured as it was heated (Fig. 2). The turbid of the mixtures was relatively high at low temperatures, which was attributed to light scattering by the quercetin crystals since they have a different refractive index to the surrounding oil phase. The turbidity initially increased upon heating from 25 to 60 °C, which was surprising since one would expect the turbidity to decrease if the number of crystals decreased due to their dissolution at elevated temperatures. We attributed this apparently anomalous behavior to changes in the size, morphology, spatial distribution, and/or aggregation state of the crystals with temperature causing changes in their light scattering efficiency. The specific turbidity of a colloidal suspension has a maximum value when the particles have a similar dimension to the wavelength of light.27 Consequently, there may have initially been a reduction in turbidity as large crystals dissolved or aggregated crystals dissociated with increasing temperature. The turbidity decreased sharply when the temperature was increased from 60 to 80 °C and maintained a low value at higher temperatures, which was attributed to melting and dissolution of the crystals so that there were no longer any particles present to scatter light. For this reason, we heated the quercetin–MCT mixtures to 90 °C in subsequent experiments so as to fully dissolve the quercetin crystals prior to preparing the nanoemulsions by homogenization.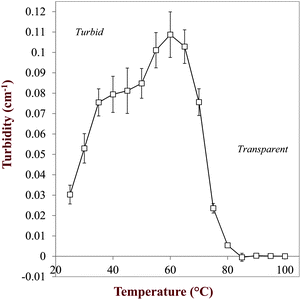 |
| | Fig. 2 Temperature dependence of the absorbance versus temperature profile of a quercetin–MCT mixture (0.25 mg mL−1). The system went from turbid to transparent as the temperature was increased. The values are the difference in absorbance between samples with and without quercetin. | |
In general, the critical temperature where a crystalline material fully dissolves in solvent depends on its initial concentration.28,29 The solubility of a crystalline component in a solvent can be predicted assuming they have widely differing melting points (>20 °C) and they form an ideal mixture:30
| |  | (5) |
here
x is the solubility (mole fraction) of the higher melting point component in the lower melting point component,
T is the absolute temperature,
Tm is the melting point of the crystalline material,
R is the gas constant, and Δ
Hf is the molar heat of fusion.
31 Above the melting point
x = 1,
i.e., the higher melting compound is completely liquid and miscible with the solvent. The mole fraction of a solute dissolved in an oil phase at saturation can be converted into a mass fraction (
ΦS) if the molar masses of the two components are known:
| |  | (6) |
here
MS and
MO are the molar masses of the solute and carrier oil, respectively. These equations can be used to relate the equilibrium solubility of a crystalline material in carrier oil to temperature. The temperature dependence of the solubility of quercetin in MCT was calculated using this equation and the physicochemical properties of quercetin given in
Table 3, along with the molar mass of MCT (500 g mol
−1). The predicted solubility of quercetin in MCT increased as the temperature increased (
Fig. 3). The calculations indicate that about 7 g L
−1 (7 mg mL
−1) of quercetin should be dissolved in the MCT at 85 °C. This value is appreciably higher than the amount of quercetin that we found could be dissolved in MCT at 85 °C in our experiments,
i.e., 0.25 g L
−1 (0.25 mg mL
−1). The difference between the predicted and measured values can be attributed to non-ideal behavior, since it is known that flavonoids form non-ideal mixtures with organic solvents.
32 A number of mathematical and computational approaches have been developed to account for the non-ideal behavior of solutes in solvents,
33 and it would be useful in future work to determine if these models could be used to predict the solubility characteristics of quercetin more accurately in different solvents. The calculations shown in
Fig. 3 highlight the fact that a bioactive component dissolved within carrier oil at high temperatures has a tendency to come out of solution when the system is cooled because of the decrease in equilibrium solubility with decreasing temperature. This factor should be taken into account when designing delivery systems that need to be stored at ambient or refrigerated temperatures for prolonged periods.
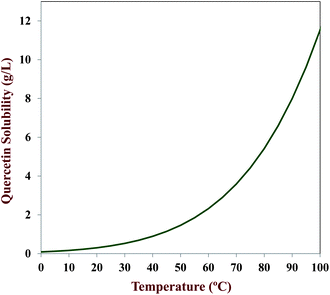 |
| | Fig. 3 Calculated dependence of the equilibrium solubility of quercetin in MCT oil on temperature. | |
3.2.2 Solubility characteristics of quercetin. The maximum amount of quercetin that could successfully be incorporated into the carrier oil phase at ambient storage temperatures was determined using spectrophotometry. Measurements of the turbidity of non-centrifuged samples were used to determine the presence of non-dissolved (crystalline) quercetin, whereas measurements of the absorbance of centrifuged samples (to remove any crystals) were used to determine the concentration of dissolved quercetin.Different amounts of quercetin (0 to 1 mg mL−1) were added to MCT and then the mixture was heated to 90 °C to dissolve the crystals. The samples were then cooled to room temperature and stored at three different temperatures (5, 20 and 37 °C) for 72 hours. During storage, we expected that dissolved quercetin molecules would form nuclei that would grow and eventually form crystals large enough to sediment. Before measuring the turbidity, the samples were therefore shaken slightly to re-suspend any quercetin crystals present. The turbidity (600 nm) of the resulting samples was measured to detect the presence of quercetin crystals that scattered light (Fig. 4). The quercetin–MCT mixtures behaved fairly similarly at all three storage temperatures. At low quercetin concentrations (0 to 0.1 mg mL−1), the mixtures were transparent indicating that all of the quercetin had dissolved. At quercetin concentrations above 0.15 mg mL−1 the samples were turbid indicating that nucleation and crystal growth of quercetin had occurred.34–37 The turbidity increased with increasing quercetin concentration in this regime since the number of crystals that scattered light increased.
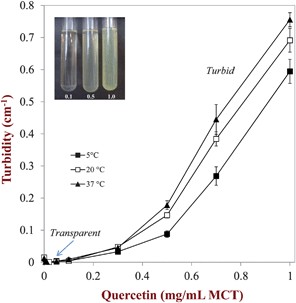 |
| | Fig. 4 Dependence of the turbidity of quercetin–MCT mixtures on the quercetin concentration – the samples became turbid at higher concentrations due to light scattering by quercetin crystals. | |
The concentration of soluble quercetin in the mixtures was determined by centrifuging them to remove the crystals, and then measuring the absorbance of the supernatant. The concentration of soluble quercetin present within the MCT increased linearly with increasing quercetin concentration from 0 to 0.1 mg mL−1 indicating that all quercetin added to the oil had dissolved (Fig. 5). From 0.1 to 0.3 mg mL−1 quercetin, the amount of soluble quercetin in the MCT actually decreased, and at higher levels it reached a relatively constant value. This phenomenon can be attributed to supersaturation of MCT with quercetin, i.e., even though the equilibrium solubility limit is exceeded, crystals are not observed because of the relatively slow nucleation kinetics.38,39 The formation of crystals in this region will depend on the nucleation rate, which will in turn depend on environmental factors such as the presence of impurities, the holding temperature, and the application of mechanical forces (such as stirring). The equilibrium solubility of quercetin was determined at the three different storage temperatures by calculating the average of the amount of soluble quercetin in the concentration regime where a constant value was attained, i.e., from 0.1 to 1 mg mL−1 total quercetin (Fig. 5). The equilibrium solubility was fairly independent of storage temperature: 0.151 ± 0.005, 0.158 ± 0.006 and 0.157 ± 0.015 mg mL−1 for 5, 20 and 37 °C respectively. This phenomenon may be attributed to the fact that the solubility of a crystalline component in a solvent does not strongly depend on temperature when the temperature is well below the melting point (Fig. 3).
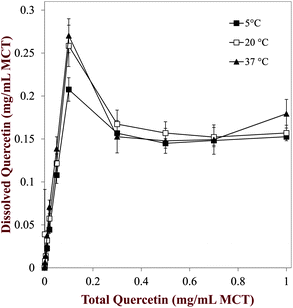 |
| | Fig. 5 Dependence of the dissolved quercetin in quercetin–MCT mixtures on the total quercetin concentration present in the sample. The dissolved quercetin measurements were made after centrifuging the samples to remove any crystals. | |
From a practical point of view it is important to establish the maximum amount of a bioactive component that can be solubilized within a nanoemulsion-based delivery system. A bioactive component is distributed between both the oil and water phases according to its equilibrium oil–water partition coefficient. The maximum amount of solute that can be dissolved in an oil-water system at equilibrium saturation can be calculated from the following expression, which is derived by carrying out a simple mass balance:
| |  | (7) |
here,
C*SO (=
M*SO/[
M*SO +
MO]) and
C*SW (=
M*SW/[
M*SW +
MW]) are the equilibrium saturation concentrations of the solute in the oil and water phases (expressed as mass fractions),
ΦO is the mass fraction of oil in the overall system (=
MO/[
MS +
MW +
MO]), and
KOW is the oil–water partition coefficient.
MSO and
MSW are the masses of the solute dissolved in the oil and water phases, while
MS,
MO and
MW refer to the masses of the solute, oil and water, respectively. In the case of an ionizable active component,
KOW is replaced by the distribution coefficient,
DOW. The superscript “*” refers to the condition of saturation. The equilibrium solubility of quercetin in water (
C*WO) at ambient temperature is reported in
Table 3 at different pH values, while the equilibrium solubility of quercetin in oil (
C*SO) was measured in this work (≈ 0.15 mg mL
−1). These values were used to estimate
DOW (=
C*SO/
C*SW) for the water–MCT system used in this study at different pH values (
Table 3). The total amount of quercetin that could be solubilized in the nanoemulsions at equilibrium was then estimated as a function of pH and fat content using
eqn (7) (
Fig. 6). These calculations indicate that the amount of quercetin solubilized in the nanoemulsions should increase as the total fat content increases, which should be expected since quercetin is more soluble in oil than in water. In addition, the calculations indicate that the solubility of quercetin should increase with decreasing pH, due to the fact that the quercetin is partially ionized at higher pH values (p
Ka ≈ 6.3). The nanoemulsions were originally prepared and stored at neutral pH and therefore there will have been a greater proportion of quercetin solubilized within them. However, when they pass through the gastrointestinal tract there solubility may change because of the high acidity of the stomach. Hence, some of the quercetin that was dissolved in the original nanoemulsions may have remained in a supersaturated state or it may have precipitated into crystals. For this reason, we measured the physical state of the quercetin throughout the simulated digestion tract (Section 3.4).
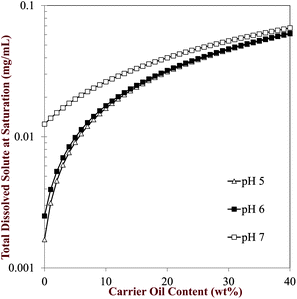 |
| | Fig. 6 Predicted influence of pH and carrier oil content on the equilibrium solubility of quercetin in oil-in-water emulsions. The curves were numerically similar at pH 1 to 4, as for pH 5 and so we only show the results for the latter. | |
3.3 Physical stability of nanoemulsions
One of the main objectives of this study was to prepare physically stable nanoemulsions that might be used as delivery systems for hydrophobic functional food ingredients. After establishing the equilibrium saturation concentration of quercetin, we studied the effects of storage temperature and initial quercetin concentration on the formation and stability of oil-in-water nanoemulsions stabilized by a globular protein (β-lactoglobulin). Nanoemulsions were prepared in the absence of quercetin, and in the presence of levels below (0.1 mg mL−1) and above (0.5 mg mL−1) the equilibrium saturation limit in MCT.After preparation, nanoemulsions were stored at three different temperatures (5, 20 and 37 °C), and their mean particle diameter (Z-average), particle charge (ζ-potential), visual appearance, and dissolved quercetin levels were periodically measured. Nanoemulsions could be successfully formed in both the absence and presence of quercetin, i.e., the droplet diameter < 200 nm (droplet radius < 100 nm).11,12 All of the nanoemulsions had monomodal particle size distributions with a peak diameter around 180 nm and a polydispersity index around 0.3 (Table 3). In addition, the initial electrical charge on the lipid droplets was similar for the nanoemulsions in the absence or presence of quercetin (≈ −55 mV). These results suggest that quercetin did not interfere with emulsion formation or contribute to the electrical properties of the particles in the nanoemulsions. All of the nanoemulsions remained physically stable during storage at 5 and 20 °C, with little change in mean particle diameter (≈ 180 nm), polydispersity index (0.25 to 0.45), or particle charge (≈ −55 mV) during one month (Table 4). On the other hand, there was an appreciable increase in the mean droplet diameter (≈ 220 nm) and a decrease in the negative charge (≈ −48 mV) of the nanoemulsions stored at 37 °C after 1 month storage. This result suggests that there are some changes in the characteristics of the droplet interfaces and colloidal interactions during storage at this higher temperature, which may have been due to partial denaturation of the adsorbed globular protein on the surface of nanoemulsions.40,41 We did not observe any evidence of droplet creaming in any of the emulsions during storage (they maintained a uniform white appearance throughout), which can be attributed to their relatively small droplet size.
Table 4 Particle size and electrical charge of particles in nanoemulsions measured during storage at different temperatures
| Samples | Droplet diameter (nm) | Polydispersity index | ζ-Potential (mV) |
|---|
| 5 °C | 24 h | 360 h | 720 h | 24 h | 360 h | 720 h | 24 h | 360 h | 720 h |
| 0 mg mL−1 | 179 ± 1 | 178 ± 2 | 178 ± 1 | 0.22 ± 0.01 | 0.38 ± 0.01 | 0.42 ± 0.02 | −55 ± 1 | −55 ± 1 | −55 ± 1 |
| 0.1 mg mL−1 | 178 ± 3 | 180 ± 2 | 180 ± 1 | 0.26 ± 0.03 | 0.42 ± 0.03 | 0.38 ± 0.04 | −53 ± 2 | −55 ± 1 | −55 ± 1 |
| 0.5 mg mL−1 | 178 ± 3 | 179 ± 1 | 181 ± 1 | 0.26 ± 0.04 | 0.35 ± 0.05 | 0.39 ± 0.04 | −55 ± 2 | −54 ± 2 | −55 ± 1 |
| |
| 20 °C | 24 h | 360 h | 720 h | 24 h | 360 h | 720 h | 24 h | 360 h | 720 h |
| 0 mg mL−1 | 178 ± 1 | 176 ± 1 | 186 ± 1 | 0.32 ± 0.01 | 0.43 ± 0.04 | 0.50 ± 0.01 | −54 ± 1 | −55 ± 1 | −53 ± 1 |
| 0.1 mg mL−1 | 179 ± 1 | 179 ± 2 | 187 ± 1 | 0.29 ± 0.03 | 0.45 ± 0.06 | 0.45 ± 0.01 | −55 ± 1 | −56 ± 1 | −52 ± 1 |
| 0.5 mg L−1 | 178 ± 2 | 177 ± 5 | 190 ± 2 | 0.35 ± 0.04 | 0.44 ± 0.02 | 0.46 ± 0.03 | −54 ± 1 | −55 ± 1 | −53 ± 1 |
| |
| 37 °C | 24 h | 360 h | 720 h | 24 h | 360 h | 720 h | 24 h | 360 h | 720 h |
| 0 mg mL−1 | 178 ± 1 | 177 ± 1 | 205 ± 3 | 0.32 ± 0.01 | 0.44 ± 0.01 | 0.56 ± 0.01 | −55 ± 1 | −56 ± 1 | −49 ± 1 |
| 0.1 mg mL−1 | 180 ± 1 | 180 ± 1 | 214 ± 3 | 0.32 ± 0.01 | 0.47 ± 0.05 | 0.56 ± 0.04 | −55 ± 1 | −54 ± 1 | −48 ± 2 |
| 0.5 mg mL−1 | 180 ± 1 | 180 ± 1 | 218 ± 1 | 0.33 ± 0.03 | 0.45 ± 0.02 | 0.54 ± 0.01 | −54 ± 1 | −54 ± 2 | −49 ± 1 |
On the other hand, we did observe the presence of a thin yellow layer at the bottom of the nanoemulsions containing 0.5 mg mL−1 quercetin after one week storage, but not in samples containing 0 or 0.1 mg mL−1 (Fig. 7). The yellowish color of this layer was similar to that of the crystalline powder used to prepare the nanoemulsions, and so we postulated that it was comprised of sedimented quercetin crystals. To confirm this hypothesis, the thin yellow layer was collected and observed using polarized light microscopy. The microscopy images showed that there were needle-shaped crystals distributed throughout the sediment (Fig. 7). Even though a thin yellow layer was not observed at the bottom of the nanoemulsions containing 0.5 mg mL−1 quercetin after 24 hours of storage, small crystals were observed within the samples when they were examined using polarized light microscopy (data not shown). We therefore postulate that crystals formed in the nanoemulsions during storage when the quercetin concentration exceeded its saturation limit, and that these crystals grew bigger over time and then sedimented to the bottom of the tubes because they are more dense than water (Table 3).
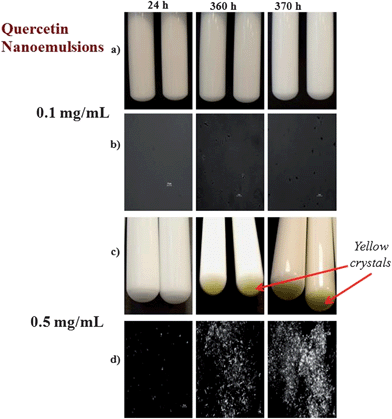 |
| | Fig. 7 Visual appearance and microstructure of nanoemulsions containing different levels of quercetin (0.1 or 0.5 mg mL−1). The microstructural images were taken using polarized light microscopy and show crystalline material. | |
The concentration of non-sedimented quercetin remaining in the nanoemulsions was analyzed over the one month storage period. An aliquot of nanoemulsion was collected from the middle of the test tubes, and then the quercetin concentration was determined by UV-visible spectrophotometry. The level of quercetin remaining in the nanoemulsions initially containing 0.1 mg mL−1 quercetin remained relatively high and constant (>95%) throughout storage at the different temperatures (Fig. 8). This suggested that the quercetin remained dissolved in the nanoemulsions throughout the experiments, which might be expected since the quercetin concentration was below the saturation limit in this system. On the other hand, there was an appreciable decrease in the level of quercetin remaining in the nanoemulsions initially containing 0.5 mg mL−1 quercetin (Fig. 8). After one month storage, only about 20% of the quercetin initially present in the system remained dispersed within the nanoemulsions. Presumably, the remainder of the quercetin had formed crystals that sedimented to the bottom of the test tubes. Interestingly, 20% of the quercetin corresponds to approximately 0.1 mg mL−1 quercetin, which is close to the saturation limit. This suggests that above the saturation limit quercetin crystals formed that sedimented to the bottom of the nanoemulsion, while the soluble quercetin remained dispersed throughout the system.
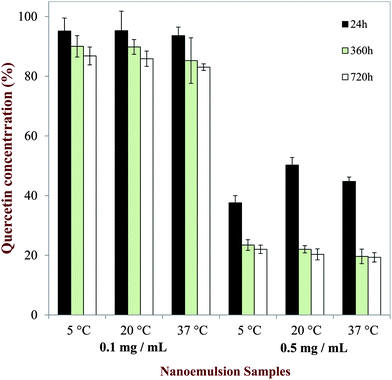 |
| | Fig. 8 Amount of quercetin remaining dispersed (non-sedimented) in the nanoemulsions at different storage times and temperatures. | |
3.4 In vitro gastrointestinal behavior
In this section, we examined the influence of nanoemulsion design on the potential biological fate of encapsulated quercetin using an in vitro gastrointestinal (GI) model that simulated the mouth, stomach, and small intestine phases. Nanoemulsion particle properties (mean diameter and charge), carrier oil digestion, and quercetin bioaccessibility were measured at certain stages within the GI model.3.4.1 Particle characteristics and microstructure. The mean particle diameter followed a similar trend for nanoemulsions containing 0, 0.1 and 0.5 mg quercetin per mL of MCT: the particle size was relatively small in the mouth phase, but relatively large in the small intestine and stomach phases (Fig. 9a). These results suggest that extensive droplet aggregation occurred in the stomach and small intestine, which has been reported previously for protein-stabilized lipid droplets under simulated GI conditions.42–44 Optical microscopy images indicated that the droplet aggregation observed in the stomach phase was due to extensive droplet coalescence and flocculation (Fig. 9b). A number of physicochemical mechanisms may contribute to the aggregation of protein-coated lipid droplets in the stomach phase.45,46 The presence of salts in the SGF would reduce the electrostatic repulsion between the lipid droplets enabling them to come into close contact. The change in solution pH from neutral (mouth) to highly acidic (stomach) means that the nanoemulsion goes through the isoelectric point of the adsorbed proteins (pI ≈ 5), which may have promoted irreversible flocculation due to a reduction in droplet charge and electrostatic repulsion. The presence of protease (pepsin) in the SGF may have promoted droplet destabilization due to partial digestion of the protein coating surrounding the lipid droplets. The optical microscopy images of samples in the small intestine phase indicated that there were no large lipid droplets remaining (Fig. 9b), which can be attributed to the fact that they had been digested by lipase (Section 3.3.1). The large aggregates observed in the small intestine phase were therefore presumably clusters of insoluble matter, such as calcium soaps and protein aggregates resulting from the digestion process. The level of quercetin initially present in the nanoemulsions had little impact on their overall aggregation behavior.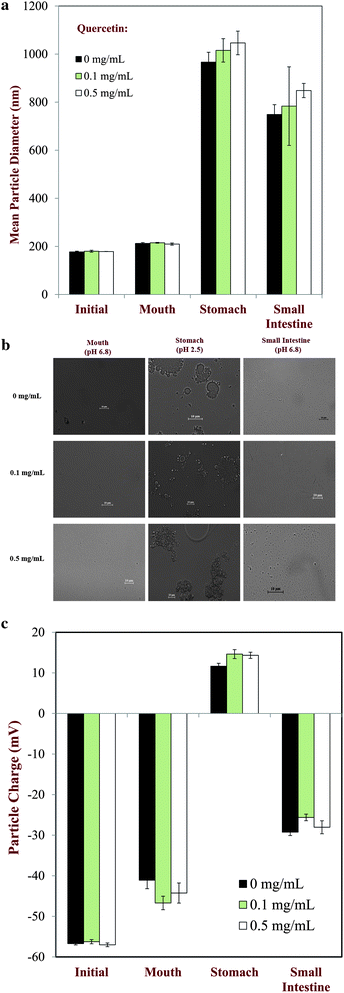 |
| | Fig. 9 (a) Mean particle diameter of nanoemulsions containing different levels of quercetin at different stages in a simulated GI model. (b) Microstructure images of nanoemulsions containing different levels of quercetin (0, 0.1 or 0.5 mg mL−1) at different stages of the in vitro digestion model. (c) Particle charge of nanoemulsions containing different levels of quercetin at different stages in a simulated GI model. | |
In general, the electrical characteristics of the particles in the nanoemulsions were also similar at all quercetin levels studied: the droplets were highly negative in the mouth phase, positive in the stomach phase, and negative in the small intestine phase (Fig. 9c). These results suggest that the electrical properties of the lipid droplets in the emulsions were dominated by the adsorbed protein layer. The globular protein (β-lactoglobulin) used to stabilize the lipid droplets is negatively charged at pH values above its isoelectric point (pI ≈ 5), but positively charged at pH values lower than this value.47 The negative charge in the mouth phase can therefore be attributed to its neutral environment (pH > pI), while the positive charge in the stomach phase can be attributed to its highly acidic environment (pH < pI). The fact that the particle charge was positive in the stomach suggests that at least some of the original protein molecules remained adsorbed at the lipid droplet surfaces. The negative charge on the particles measured in the small intestine phase may be the result of a number of phenomena: the pH is above the isoelectric point of the protein molecules so any protein aggregates will have a negative charge; the mixed micelles and vesicles resulting from lipid digestion contain anionic components, such as bile salts, phospholipids, and free fatty acids; some of the insoluble byproducts of lipid oxidation may have been anionic, e.g., calcium soaps. It should be noted that under physiological conditions, β-lactoglobulin molecules may have become fully or partially digested within the stomach and small intestine due to the presence of proteases.48 The hydrolysis of the protein molecules will affect their ability to adsorb to oil–water interfaces, and therefore their ability to alter droplet charge, droplet aggregation, lipid digestion and bioactive release. In practice, it is not possible to specify the origin of the particle charge in complex multicomponent systems.
3.4.2 Carrier oil digestion. An important factor influencing the bioavailability of many highly hydrophobic components is the digestion of any co-ingested triacylglycerol oils, since this leads to the formation of free fatty acids and monoacylglycerols, which form mixed micelles and vesicles that can solubilize and transport hydrophobic components into the epithelium cells.5,49 We therefore measured the rate and extent of digestion of the triacylglycerol (MCT) used as a carrier oil to form the nanoemulsions using an established in vitro digestion model designed to simulate the small intestine phase.17,18,20 This model measures the amount of free fatty acids released from the samples over time due to conversion of triacylglycerols into monoacylglycerols, diacylglycerols, and free fatty acids.50The rate and extent of lipid digestion in the nanoemulsions was compared to systems where a similar concentration of quercetin was dispersed in either bulk oil (MCT) or bulk water to examine the influence of system composition and structure on the results. As expected, there was no release of fatty acids from the quercetin samples dispersed in water, since there was no triacylglycerol molecules present to digest (data not shown). In the samples containing bulk or emulsified triacylglycerol oils, there was a rapid initial increase in the amount of free fatty acids released, followed by a more gradual increase at longer digestion times (Fig. 10). The emulsified oil in the nanoemulsions was digested at a faster rate than that bulk oil in both the absence and presence of quercetin. Previous studies have found that the rate of lipid digestion increased when the droplet size decreased, which was attributed to the increase in the surface area of the lipid phase exposed to the digestive enzymes in the aqueous phase.51,52 Nevertheless, it should be highlighted that coalescence of the lipid droplets in the nanoemulsions occurred within the stomach phase (Fig. 9b), which substantially increased their droplet size above that of the original value. In addition, the bulk oil underwent some emulsification as it passed through the in vitro digestion model so that it would also be present as large droplets (rather than a pure bulk phase). Light scattering experiments indicated that the mean diameter of the oil droplets leaving the stomach phase was around 2000 nm for the sample initially containing bulk oil, but around 1000 nm for the sample that was initially in the form of a nanoemulsion. Hence, it seemed that pre-homogenization of the carrier oil phase did facilitate its subsequent digestion under simulated small intestine conditions. Our results indicate that the presence of quercetin (0, 0.1 or 0.5 mg mL−1) within emulsified or bulk oils did not have a major impact on the rate or extent of digestion of the carrier oil (Fig. 10).
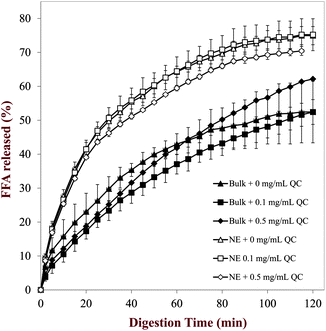 |
| | Fig. 10 Release of free fatty acids from bulk oils and nanoemulsions containing different levels of quercetin measured using a pH stat method. | |
3.4.3 Quercetin bioaccessibility in small intestine. Finally, we quantified quercetin bioaccessibility using simulated small intestine conditions by measuring the quercetin concentration within the micelle phase collected at the end of the simulated small intestine phase. It was assumed that only the quercetin that was incorporated within the mixed micelles (bile salts, phospholipids, and lipid digestion products) would be available for adsorption by endothelium cells in the small intestine. The bioaccessibility of quercetin initially dispersed in bulk oil, bulk water, or nanoemulsions at two different levels (0.1 and 0.5 mg QC per mL MCT) was examined. At the lower level, all of the quercetin will initially have been fully dissolved in the nanoemulsions and bulk oil, but at the higher level there was an appreciable amount of crystalline quercetin present in both systems. On the other hand, the quercetin was initially in a crystalline state in bulk water at both levels due to the much lower saturation limit (Table 3).In general, we found that quercetin bioaccessibility measured under simulated small intestine conditions depended on the nature of the delivery system, as well as on the physical state of the quercetin itself (dissolved or crystalline). Quercetin had a low bioaccessibility (<5%) when dispersed in bulk water at both levels used (Fig. 11a), which can be attributed to its low inherent water solubility and the fact that there was no triacylglycerol present that could be digested and form mixed micelles to solubilize the hydrophobic component. The bioaccessibility of quercetin in bulk oil was considerably higher than in water (Fig. 11a), particularly at the lowest level of quercetin used. In addition, the bioaccessibility of quercetin was strongly dependent on the initial concentration of quercetin used, being around 28% and 8% at 0.1 and 0.5 mg mL−1. The increase in quercetin bioaccessibility in bulk oil compared to bulk water can be attributed to the increased solubilization capacity of the small intestinal fluids due to the presence of mixed micelles formed by bile salts and lipid digestion products (free fatty acids and monoacylglycerols). The decrease in bioaccessibility with increasing quercetin concentration may have been because the solubilization capacity of the mixed micelles was exceeded, or because crystalline quercetin was not incorporated into the mixed micelles as easily as soluble quercetin. We propose that the latter mechanism is most likely because the experiments with nanoemulsions showed that higher levels of quercetin could be incorporated into the mixed micelles (Fig. 11a). A recent study of the behavior of crystalline quercetin in a simulated GI model has shown that the water-solubility of quercetin decreased as the crystal size increased due to the slower dissolution rate of the crystals.53 There was a substantial further increase in quercetin bioaccessibility when it was incorporated in a nanoemulsion rather than in bulk oil (Fig. 11a), being around 53% and 29% at 0.1 and 0.5 mg mL−1, respectively. These results again suggest that soluble quercetin has a higher bioaccessibility than crystalline quercetin in the small intestine, presumably because it can more rapidly be incorporated into mixed micelles. Some studies have demonstrated that quercetin and other polyphenolic compounds that are not absorbed in the SI, will be absorbed in the large intestine54–56 It would therefore be useful in future studies aimed at evaluating the overall bioaccessibility of polyphenolic compounds to include a large intestine phase within the simulated GIT.
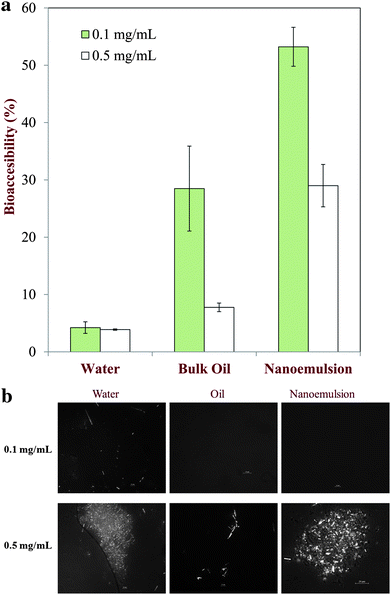 |
| | Fig. 11 (a) Quercetin bioaccessibility in bulk water, bulk oil and nanoemulsions containing different levels of quercetin after digestion in a simulated GI tract. (b) Polarized light microscopy of pellets (sediments) collected from bulk water, bulk oil and nanoemulsions containing different levels of quercetin after digestion in a simulated GI tract. | |
It is possible for soluble compounds to precipitate or for crystalline compounds to dissolve when solution conditions are altered. We therefore used optical microscopy to monitor the absence or presence of quercetin crystals after the small intestine digestion phase. After lipid digestion had been completed we centrifuged the samples, collected the resulting pellet, and then measured its microstructure using polarized light microscopy (Fig. 11b). Crystalline material was observed in the images when quercetin was originally dispersed within water at both quercetin concentrations studied (0.1 and 0.5 mg mL−1), which can be attributed to the low water-solubility of quercetin (Table 3). No crystalline material was observed in the nanoemulsion or bulk oil samples at the lowest quercetin concentration used (0.1 mg mL−1) indicating that it remained fully dissolved under these conditions. On the other hand, crystalline material was observed in the nanoemulsion and bulk oil samples with the higher initial quercetin concentration (0.5 mg mL−1), which can be attributed to the fact that quercetin was above its saturation concentration, and so quercetin crystals were formed that dissolved slowly so they were not incorporated into the mixed micelles on the experimental time scale.57–59
3.5 Potential for fabrication of quercetin enriched functional foods
We have shown that physically stable oil-in-water nanoemulsions could be formed that contained 0.15 mg of dissolved quercetin per mL of carrier oil (MCT). The nanoemulsions prepared in this study contained about 10 wt% of oil phase, and therefore the total amount of dissolved quercetin was about 0.015 mg per gram of emulsion (Fig. 6). Typically, a serving size for an emulsion-based food or beverage product is around 100 to 200 g, and hence the final product would contain around 1.5 to 3 mg of quercetin per serving. The current daily intake of quercetin has been reported to be around 25–35 mg per day, but the bioavailability of this quercetin is often quite low.2,54 The bioaccessibility of the quercetin in the nanoemulsion systems studied in this work was appreciably higher (≈55%) than in bulk water (<5%) or bulk oil (<30%) systems. Hence, the actual amount of quercetin delivered to the systemic circulation using a nanoemulsion may be much higher than that delivered by conventional food forms. Encapsulation of quercetin within nanoemulsion-based delivery systems may therefore prove to be a successful strategy for fortifying foods with this potentially beneficial nutraceutical component.4 Conclusions
The purpose of this study was to determine whether oil-in-water nanoemulsions could be developed as effective delivery systems for incorporating quercetin into functional foods. Quercetin has been claimed to have beneficial biological effects when consumed by humans, but it has a low-water solubility and is crystalline at ambient and body temperatures, which currently limits its application as a functional food ingredient. We have shown that quercetin can be successfully incorporated into physically stable nanoemulsions, provided the overall quercetin concentration within the delivery system does not exceed the saturation level of quercetin. Above this critical concentration quercetin forms crystals that sediment to the bottom of the nanoemulsion.We have also shown that quercetin dissolved in nanoemulsions has a higher bioaccessibility than quercetin dissolved in bulk oils or in bulk water, and that soluble quercetin has a higher bioaccessibility than crystalline quercetin. Improved knowledge of the dissolution and crystallization behavior of bioactive components within the complex environment of the gastrointestinal (GI) tract would facilitate the design of functional foods with improved nutritional benefits. For example, the composition and structure of a delivery system could be optimized to prevent a bioactive component from precipitating within the GI tract, thereby increasing its overall bioavailability. Nevertheless, further work is clearly needed to improve our understanding of the behavior of different kinds of delivery systems under the complex chemical, physical, and dynamic conditions within the human GI tract. The current study provides some insights into the potential behavior of nanoemulsion-based delivery systems within simulated GI tract conditions.
Acknowledgements
This material is based upon work supported by United States Department of Agriculture, CREES, NRI and AFRI Grants, and Massachusetts Department of Agricultural Resources.References
- I. Erlund, Nutr. Res., 2004, 24, 851–874 CrossRef CAS.
- M. Russo, C. Spagnuolo, I. Tedesco, S. Bilotto and G. L. Russo, Biochem. Pharmacol., 2012, 83, 6–15 CrossRef CAS.
- P. Ader, A. Wessmann and S. Wolffram, Free Radical Biol. Med., 2000, 28, 1056–1067 CrossRef CAS.
- G. Borghetti, I. Lula, R. Sinisterra and V. Bassani, AAPS PharmSciTech, 2009, 10, 235–242 CrossRef CAS.
- C. W. Pouton, Eur. J. Pharm. Sci., 2006, 29, 278–287 CrossRef CAS.
- D. J. McClements, Curr. Opin. Colloid Interface Sci., 2012, 17, 235–245 CrossRef CAS.
- J. Flanagan and H. Singh, Crit. Rev. Food Sci. Nutr., 2006, 46, 221–237 CrossRef CAS.
- A. Matalanis, O. G. Jones and D. J. McClements, Food Hydrocolloids, 2011, 25, 1865–1880 CrossRef CAS.
- K. P. Velikov and E. Pelan, Soft Matter, 2008, 4, 1964–1980 RSC.
- D. J. McClements and J. Rao, Crit. Rev. Food Sci. Nutr., 2011, 51, 285–330 CrossRef CAS.
- D. J. McClements, Soft Matter, 2012, 8, 1719–1729 RSC.
- D. J. McClements, Soft Matter, 2011, 7, 2297–2316 RSC.
- Y. Li, J. K. Zheng, H. Xiao and D. J. McClements, Food Hydrocolloids, 2012, 27, 517–528 CrossRef CAS.
- N. Nagasawa, T. Yagi, T. Kume and F. Yoshii, Carbohydr. Polym., 2004, 58, 109–113 CrossRef CAS.
- A. Sarkar, K. K. T. Goh and H. Singh, Food Hydrocolloids, 2009, 23, 1270–1278 CrossRef CAS.
- A. Sarkar, K. K. T. Goh and H. Singh, Food Hydrocolloids, 2010, 24, 534–541 CrossRef CAS.
- S. Mun, E. Decker, Y. Park, J. Weiss and D. McClements, Food Biophys., 2006, 1, 21–29 CrossRef.
- N. H. Zangenberg, A. Müllertz, H. G. Kristensen and L. Hovgaard, Eur. J. Pharm. Sci., 2001, 14, 115–122 CrossRef CAS.
- C. Dinnella, P. Minichino, A. M. D'Andrea and E. Monteleone, J. Agric. Food Chem., 2007, 55, 8423–8429 CrossRef CAS.
- U. Lesmes, P. Baudot and D. J. McClements, J. Agric. Food Chem., 2010, 58, 7962–7969 CrossRef CAS.
- J.-Y. Gal, Y. Fovet and M. Adib-Yadzi, Talanta, 2001, 53, 1103–1115 CrossRef CAS.
- V. W. H. Leung and B. W. Darvell, J. Dent., 1997, 25, 475–484 CrossRef CAS.
- M. Beysseriat, E. A. Decker and D. J. McClements, Food Hydrocolloids, 2006, 20, 800–809 CrossRef CAS.
- R. H. Muller and C. M. Keck, J. Biotechnol., 2004, 113, 151–170 CrossRef CAS.
- D. J. McClements, Food Emulsions: Principles, Practice, and Techniques, CRC Press, Boca Raton, 2005 Search PubMed.
- J. Weiss, E. A. Decker, D. J. McClements, K. Kristbergsson, T. Helgason and T. Award, Food Biophys., 2008, 3, 146–154 CrossRef.
- D. J. McClements, Adv. Colloid Interface Sci., 2002, 97, 63–89 CrossRef CAS.
- R. W. Hartel, Crystallization in Foods, Aspen Publishers, Gaithersburg, MD, 2001 Search PubMed.
- P. G. Vekilov, Cryst. Growth
Des., 2010, 10, 5007–5019 CAS.
- D. J. McClements, Adv. Colloid Interface Sci., 2012, 174, 1–30 CrossRef CAS.
- P. Walstra, Physical Chemistry of Foods, Marcel Decker, New York, NY, 2003 Search PubMed.
- L. Chebil, C. Humeau, J. Anthoni, F. Dehez, J. M. Engasser and M. Ghoul, J. Chem. Eng. Data, 2007, 52, 1552–1556 CrossRef CAS.
- J. S. Delaney, Drug Discovery Today, 2005, 10, 289–295 CrossRef CAS.
- R. A. Judge, R. S. Jacobs, T. Frazier, E. H. Snell and M. L. Pusey, Biophys. J., 1999, 77, 1585–1593 CrossRef CAS.
- A. McPherson, Crystallization of Biological Macromolecules, Cold Spring Harbor Laboratory Press, New York, 1999 Search PubMed.
- J. W. Mullin, Crystallization, A Butterworth-Heinemann Title, 2001 Search PubMed.
- M. C. Weinberg, W. H. Poisl and L. Granasy, C. R. Chim., 2002, 5, 765–771 CrossRef CAS.
- P. G. Vekilov, in Selected Topics on Crystal Growth, ed. M. Wang, K. Tsukamoto and D. Wu, 2010, vol. 1270, pp. 60–77 Search PubMed.
- L. Lindfors, S. Forssen, J. Westergren and U. Olsson, J. Colloid Interface Sci., 2008, 325, 404–413 CrossRef CAS.
- H. J. Kim, E. A. Decker and D. J. McClements, J. Agric. Food Chem., 2002, 50, 7131–7137 CrossRef CAS.
- H. J. Kim, E. A. Decker and D. J. McClements, Langmuir, 2002, 18, 7577–7583 CrossRef CAS.
- A. Sarkar, K. K. T. Goh, R. P. Singh and H. Singh, Food Hydrocolloids, 2009, 23, 1563–1569 CrossRef CAS.
- A. Sarkar, D. S. Horne and H. Singh, Int. Dairy J., 2010, 20, 589–597 CrossRef CAS.
- T. Tokle, U. Lesmes, E. A. Decker and D. J. McClements, Food Funct., 2012, 3, 58–66 CAS.
- D. J. McClements, E. A. Decker and Y. Park, Crit. Rev. Food Sci. Nutr., 2009, 49, 48–67 CrossRef.
- H. Singh and A. Sarkar, Adv. Colloid Interface Sci., 2011, 165, 47–57 CrossRef CAS.
- D. Guzey and D. J. McClements, J. Agric. Food Chem., 2007, 55, 475–485 CrossRef CAS.
- A. Mackie and A. Macierzanka, Curr. Opin. Colloid Interface Sci., 2010, 15, 102–108 CrossRef CAS.
- C. J. H. Porter and K. M. Wasan, Adv. Drug Delivery Rev., 2008, 60, 615–616 CrossRef CAS.
- D. J. McClements and Y. Li, Food Funct., 2010, 1, 32–59 CAS.
- Y. Li and D. J. McClements, J. Agric. Food Chem., 2010, 58, 8085–8092 CrossRef CAS.
- L. Lundin and M. Golding, Aust. J. Dairy Technol., 2009, 64, 68–74 CAS.
- R. H. Müller, S. Gohla and C. M. Keck, Eur. J. Pharm. Biopharm., 2011, 78, 1–9 CrossRef.
- C. Manach, G. Williamson, C. Morand, A. Scalbert and C. Rémésy, Am. J. Clin. Nutr., 2005, 81, 230S–242S CAS.
- F. Saura-Calixto, J. Serrano and I. Goñi, Food Chem., 2007, 101, 492–501 CrossRef CAS.
- M. Carbonaro, G. Grant and A. Pusztai, Eur. J. Nutr., 2001, 40, 84–90 CrossRef CAS.
- E. Acosta, Curr. Opin. Colloid Interface Sci., 2009, 14, 3–15 CrossRef CAS.
- P. J. Sassene, M. M. Knopp, J. Z. Hesselkilde, V. Koradia, A. Larsen, T. Rades and A. Müllertz, J. Pharm. Sci., 2010, 99, 4982–4991 CrossRef CAS.
- J. P. R. Day, G. Rago, K. F. Domke, K. P. Velikov and M. Bonn, J. Am. Chem. Soc., 2010, 132, 8433–8439 CrossRef CAS.
|
| This journal is © The Royal Society of Chemistry 2013 |
Click here to see how this site uses Cookies. View our privacy policy here. 
![[thin space (1/6-em)]](https://www.rsc.org/images/entities/char_2009.gif) :
:![[thin space (1/6-em)]](https://www.rsc.org/images/entities/char_2009.gif) 25). Aliquots of supernatant were taken and their absorbance was measured at 372 nm using a UV-visible spectrophotometer (Evolution Array, Thermo Scientific, USA). The amount of dissolved quercetin present was determined from the absorbance values using a standard curve. DMSO was used as a blank for these measurements.
25). Aliquots of supernatant were taken and their absorbance was measured at 372 nm using a UV-visible spectrophotometer (Evolution Array, Thermo Scientific, USA). The amount of dissolved quercetin present was determined from the absorbance values using a standard curve. DMSO was used as a blank for these measurements.![[thin space (1/6-em)]](https://www.rsc.org/images/entities/char_2009.gif) 000 psi.
000 psi.![[thin space (1/6-em)]](https://www.rsc.org/images/entities/char_2009.gif) :
:![[thin space (1/6-em)]](https://www.rsc.org/images/entities/char_2009.gif) 1000) with aqueous buffer solution (5 mM phosphate, pH 7.0) prior to analysis to avoid multiple scattering effects.
1000) with aqueous buffer solution (5 mM phosphate, pH 7.0) prior to analysis to avoid multiple scattering effects.![[thin space (1/6-em)]](https://www.rsc.org/images/entities/char_2009.gif) :
:![[thin space (1/6-em)]](https://www.rsc.org/images/entities/char_2009.gif) 25), and then filtered using a 25 mm diameter syringe filter (1–10 mL, EMD Millipore Corp. USA). The quercetin concentration was then determined by measuring the absorbance of the samples at 372 nm using a UV-visible spectrophotometer (Evolution Array, Thermo Scientific, USA). The percentage of quercetin (QC(%)) encapsulated within the nanoemulsions was then calculated using the following equation:
25), and then filtered using a 25 mm diameter syringe filter (1–10 mL, EMD Millipore Corp. USA). The quercetin concentration was then determined by measuring the absorbance of the samples at 372 nm using a UV-visible spectrophotometer (Evolution Array, Thermo Scientific, USA). The percentage of quercetin (QC(%)) encapsulated within the nanoemulsions was then calculated using the following equation:
![[thin space (1/6-em)]](https://www.rsc.org/images/entities/char_2009.gif) 000 rpm for 30 min at 10 °C). The resulting pellet was collected, diluted with buffer solution (PBS 5 mM, pH 7) and then its microstructure was measured using an optical microscope with polarizers (Nikon D-Eclipse C1 80i microscopy, Nikon, Melville, NY).
000 rpm for 30 min at 10 °C). The resulting pellet was collected, diluted with buffer solution (PBS 5 mM, pH 7) and then its microstructure was measured using an optical microscope with polarizers (Nikon D-Eclipse C1 80i microscopy, Nikon, Melville, NY).![[thin space (1/6-em)]](https://www.rsc.org/images/entities/char_2009.gif) :
:![[thin space (1/6-em)]](https://www.rsc.org/images/entities/char_2009.gif) 1 w/w (sample
1 w/w (sample![[thin space (1/6-em)]](https://www.rsc.org/images/entities/char_2009.gif) :
:![[thin space (1/6-em)]](https://www.rsc.org/images/entities/char_2009.gif) SGF). The resulting mixture shaken continuously at 95 rpm (4080 Incubator Shaker, New Brunswick Scientific, NJ, USA) for 2 hours to mimic the motility of the stomach.23
SGF). The resulting mixture shaken continuously at 95 rpm (4080 Incubator Shaker, New Brunswick Scientific, NJ, USA) for 2 hours to mimic the motility of the stomach.23


![[thin space (1/6-em)]](https://www.rsc.org/images/entities/char_2009.gif) 000 rpm per 30 min at 10 °C) using an ultracentrifuge (Sorvall WX Ultra Series Centrifuge, Thermo Scientific, USA). After centrifugation, the samples separated into an opaque sediment phase at the bottom and a clear micelle phase at the top. Aliquots (5 mL) were collected from the supernatant (“micelle phase”) and vortexed with DMSO (dilution 1
000 rpm per 30 min at 10 °C) using an ultracentrifuge (Sorvall WX Ultra Series Centrifuge, Thermo Scientific, USA). After centrifugation, the samples separated into an opaque sediment phase at the bottom and a clear micelle phase at the top. Aliquots (5 mL) were collected from the supernatant (“micelle phase”) and vortexed with DMSO (dilution 1![[thin space (1/6-em)]](https://www.rsc.org/images/entities/char_2009.gif) :
:![[thin space (1/6-em)]](https://www.rsc.org/images/entities/char_2009.gif) 25) and then filtered using a 25 mm diameter syringe filter (1–10 mL, EMD Millipore Corp. USA). After filtration, the samples were centrifuged at 4000 rpm at room temperature for 10 min (Fisher Scientific 225A, Fisher) and the supernatant was analyzed by measuring the absorbance at 372 nm using UV-visible spectrophotometry (Evolution Array, Thermo Scientific, USA). The bioaccessibility (BA) was determined using the following equation:
25) and then filtered using a 25 mm diameter syringe filter (1–10 mL, EMD Millipore Corp. USA). After filtration, the samples were centrifuged at 4000 rpm at room temperature for 10 min (Fisher Scientific 225A, Fisher) and the supernatant was analyzed by measuring the absorbance at 372 nm using UV-visible spectrophotometry (Evolution Array, Thermo Scientific, USA). The bioaccessibility (BA) was determined using the following equation:


