Kinetic quantification of protein polymer nanoparticles using non-invasive imaging†
S. M. Janiba, S. Liub, R. Parkb, M. K. Pastuszkaa, P. Shia, A. S. Mosesa, M. M. Oroscoc, Y.-A. Lind, H. Cuid, P. S. Contib, Z. Li*b and J. A. MacKay*a
aDepartment of Pharmacology and Pharmaceutical Sciences, University of Southern California, Los Angeles, CA 90033-9121, USA. E-mail: jamackay@usc.edu; Tel: +1 323-442-4118
bMolecular Imaging Center, Department of Radiology, Keck School of Medicine, University of Southern California, Los Angeles, 90033, USA. E-mail: ziboli@usc.edu; Tel: +1 323-442-3252
cAlfred E. Mann Institute at the University of Southern California, 1042 Downey Way, DRB Building, Suite 101, Los Angeles, CA 90089-1112, USA
dDepartment of Chemical and Biomolecular Engineering, Johns Hopkins University, Baltimore, MD 21218, USA
First published on 11th October 2012
Abstract
Protein polymers are repetitive amino acid sequences that can assemble monodisperse nanoparticles with potential applications as cancer nanomedicines. Of the currently available molecular imaging methods, positron emission tomography (PET) is the most sensitive and quantitative; therefore, this work explores microPET imaging to track protein polymer nanoparticles over several days. To achieve reliable imaging, the polypeptides were modified by site-specific conjugation using a heterobifunctional sarcophagine chelator, AmBaSar, which was subsequently complexed with 64Cu. AmBaSar/64Cu was selected because it can label particles in vivo over periods of days, which is consistent with the timescales required to follow long-circulating nanotherapeutics. Using an orthotopic model of breast cancer, we observed four elastin-like polypeptides (ELPs)-based protein polymers of varying molecular weight, amino acid sequence, and nanostructure. To analyze this data, we developed a six-compartment image-driven pharmacokinetic model capable of describing their distribution within individual subjects. Surprisingly, the assembly of an ELP block copolymer (78 kD) into nanoparticles (Rh = 37.5 nm) minimally influences pharmacokinetics or tumor accumulation compared to a free ELP of similar length (74 kD). Instead, ELP molecular weight is the most important factor controlling the fate of these polymers, whereby long ELPs (74 kD) have a heart activity half-life of 8.7 hours and short ELPs (37 kD) have a half-life of 2.1 hours. These results suggest that ELP-based protein polymers may be a viable platform for the development of multifunctional therapeutic nanoparticles that can be imaged using clinical PET scanners.
Insight, innovation, integrationThe ability to interrogate living systems without perturbing it makes molecular imaging a powerful tool for the development of personalized medicine. By employing smart polymers coupled with imaging techniques we are better able to visualize how they distribute and behave in vivo. Being able to track them in this manner, could allow the visualization of cancer cells and the site of drug delivery by nanotherapeutics. Thus, individualize treatment monitoring and dose optimization becomes increasingly more feasible. |
Introduction
Protein polymers are genetically-engineered polypeptides with emerging applications as cancer therapeutics.1–6 More recently, protein polymers constructed as block copolymers have been developed as a platform for the direct assembly of biodegradable, multivalent nanoparticles.7–9 While protein polymer nanoparticles present unique opportunities to assemble protein-based therapeutics, it remains unknown if assembly significantly alters their pharmacokinetics and biodistribution. To address this issue, we describe a chelation approach enabling serial positron emission tomography (PET) imaging of protein polymer nanoparticles in vivo over a period of several days. Molecular imaging is a powerful tool for characterizing biological processes at the cellular and sub-cellular level, both in vitro and in vivo.10–12 However, many experimental and clinically-approved PET contrast agents currently consist of low molecular weight compounds with rapid clearance.13 Unlike low molecular weight diagnostics, therapeutic nanoparticles are intended to circulate for extended periods. To track long-circulating therapeutics, it is advantageous to use chelation-based strategies to carry easy-to-obtain positron emitters that retain activity over several days.Various imaging modalities have been used to explore nanoparticulate-based contrast agents, including ultrasound, magnetic resonance imaging, and PET.11 Here we selected microPET because it has high sensitivity, good resolution, no limitation caused by depth of penetration, and can be calibrated for quantification. While PET radioisotopes such as 18F, 11C, 13N, and 15O14,15 have been the mainstay of clinical and molecular imaging, continuing development of large biomolecules such as proteins, peptides, antibodies, and nanoparticles necessitates the development of non-traditional PET radioisotopes.16 In their application to protein nanoparticles, the aforementioned non-metallic radioisotopes possess critical limitations. Chief among them are their short radiological half-lives, which prohibit the investigation of biological processes over several days. To overcome this limitation metallic radioisotopes of Zr, Y, In, Ga, and Cu have been investigated as they provide a wide range of decay half-lives, which are compatible with long biological pharmacokinetic half-lives.17 In addition, metallic radioisotopes are amenable to non-covalent chelation, which makes them simple to attach to biological molecules immediately prior to administration. Of these radioisotopes, 64Cu is advantageous due to its low positron energy, high specific activity, availability, and reasonably long half-life (12.7 hours).18 These properties allow investigation of biological processes that take place over days.19–21
The standard approach to tagging a biomolecule with a metallic radionuclide such as 64Cu is to first conjugate a suitable chelating agent to the protein or nanoparticle and then to complex the metal to the chelated biomolecule. Chelates that can hold radiometals with high-stability under physiological conditions are essential in achieving high uptake of the copper radionuclide in the tissue or organ of interest while minimizing their non-selective binding or incorporation into non-target organs or tissues.22 Unfortunately, the cuprous ion does not chelate as effectively with the macrocyclic 1,4,7,10-Tetraazacyclododecane-1,4,7,10-tetraacetic acid (DOTA) as do other metals.17 In view of this, and based on the comparative stability of the sarcophagine-based chelator,23–25 the chelating agent AmBaSar (Fig. 1a) was selected for this study over a traditional macrocyclic chelator.
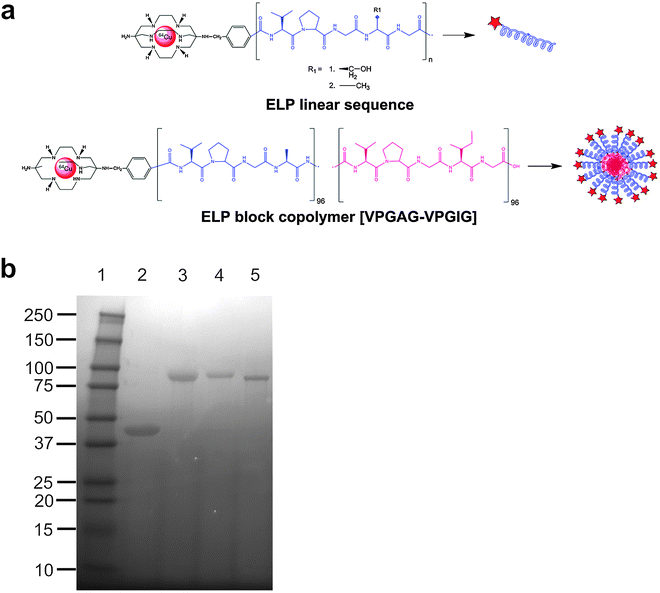 | ||
| Fig. 1 Conjugation scheme of the bifunctional chelating agent AmBaSar and ELP. (a) AmBaSar is chemically conjugated to the N-terminus of either linear ELPs or a block copolymer. AmBaSar then chelates 64Cu endowing the construct with radioactive properties. (b) The purified polymers were evaluated for identity and purity using SDS-PAGE and stained with copper chloride. Lane 1: Ladder; Lane 2: A96; Lane 3: A192; Lane 4: S192; Lane 5: A96I96. | ||
Many nanoparticle platforms are under investigation for packaging, transport, and delivery of imaging and therapeutic agents.11 One example is a class of protein polymers derived from human tropoelastin, called elastin-like polypeptides (ELPs).3,26,27 ELPs are composed of a five amino acid repeat (Val-Pro-Gly-Xaa-Gly)n. ELPs undergo an inverse phase transition above a transition temperature (Tt), which is primarily a function of the guest residue Xaa, n, and concentration.26,28 In solution, ELPs are structurally disordered. When the temperature is raised above their Tt, they undergo a sharp (2–3 °C range) phase transition, leading to biopolymer coacervation.26 This process is fully reversible when the temperature is lowered below Tt. Phase separation can be triggered by other external stimuli such as changes in ionic strength, pH, solvent, and magnetic fields.26,29,30 Here we report the characterization of ELPs with various lengths and nanoparticle structure using microPET imaging to track their pharmacokinetic and biodistribution properties.
Materials and methods
All reagents and solvents were purchased from Sigma Aldrich Chemicals (St. Louis, MO, USA) and unless otherwise stated were used without further purification. PD10 desalting columns were purchased from GE Healthcare (Piscataway, NJ). Female athymic nude mice, 5–6 weeks old were supplied by Harlan Laboratories (Indianapolis, IN). 64Cu was obtained from Washington University (St. Louis, MO) and was produced by the 64Ni (p,n) 64Cu nuclear reaction.Recombinant synthesis of ELPs
To generate ELPs of a specific and pre-determined chain lengths the following plasmid reconstruction recursive directional ligation (preRDL) strategy was employed.31 Two cloning vectors, which contained the ELP gene were cut with two separate sets of restriction enzymes, which was described previously by our group.8 One vector was digested with BssHII and AcuI, while BssHII and Bser1 was used to digest the second vector. Enzyme digestion was performed using 1 μL of each enzyme, at 37 °C for 3 h. The two sets of cut vectors were gel purified and ligated together using the T4 DNA ligase (Invitrogen, Carlsbad, CA), resulting in the recursive extension of the genes encoding for pentameric repeats. The same strategy was employed to generate the ELP block copolymer, where the N-terminal gene of one monoblock (Xaa = Ala) was ligated to a C-terminal ELP gene of another (Xaa = Ile) via preRDL. Gene sequences encoding for the desired polypeptides (Table 1) were confirmed using diagnostic DNA digestion and DNA sequencing from both N and C termini.| Label | Amino acid sequencea | MW (Da)b | Tt at 25 μM (°C) | Construct |
|---|---|---|---|---|
| a Gene sequence confirmed by N and C terminal DNA sequences and diagnostic restriction digestion.b Estimated from open reading frame excluding methionine start codon and confirmed using SDS-PAGE.c Critical micelle temperature (CMT). | ||||
| A96 | G(VPGAG)96Y | 36987.00 | 84.3 |  |
| A192 | G(VPGAG)192Y | 73604.56 | 61.9 |  |
| S192 | G(VPGSG)192Y | 76619.32 | 57.4 |  |
| A96I96 | G(VPGAG)96(VPGIG)96Y | 77655.30 | 20.6c |  |
Protein purification by inverse transition cycling
pET25b(+) expression vectors containing the desired constructs were transformed into E. coli BLR (DE3) cells for protein hyperexpression and proteins were purified by inverse transition cycling (ITC).32 Briefly, overnight cultures were spun down and re-suspended in cold PBS. The proteins were liberated from bacteria by periodic probe-tip sonication for a total of 3 minutes. Insoluble debris was collected by centrifugation for 15 min at 4 °C, 12![[thin space (1/6-em)]](https://www.rsc.org/images/entities/char_2009.gif) 000 rpm, and the supernatant was transferred to another tube. Excess poly-ethylene imine (MW = 3000) was added to precipitate nucleic acids and the solution was centrifuged. The supernatant, containing soluble ELP, was heated to 37 °C to induce phase separation, and the coacervate was collected by centrifugation. The ELP was then re-suspended in cold PBS and centrifuged at 4 °C again, completing one round of ITC. 4–6 rounds of ITC were completed, sufficient to ensure the purity indicated (Fig. 1b).
000 rpm, and the supernatant was transferred to another tube. Excess poly-ethylene imine (MW = 3000) was added to precipitate nucleic acids and the solution was centrifuged. The supernatant, containing soluble ELP, was heated to 37 °C to induce phase separation, and the coacervate was collected by centrifugation. The ELP was then re-suspended in cold PBS and centrifuged at 4 °C again, completing one round of ITC. 4–6 rounds of ITC were completed, sufficient to ensure the purity indicated (Fig. 1b).Dynamic light scattering of particle assembly
Determination of the hydrodynamic radius of the free protein polymers and nanoparticles was performed on a Dynapro plate reader (Wyatt Technology Inc., Santa Barbara, CA, USA). 10–25 μM of polypeptide in phosphate buffered saline (PBS) pH 7.4 was subjected to a temperature ramp between 10–40 °C with 1 °C increments. Before analysis, the solutions were filtered through Whatman Anotop™ filters with a 0.02 μM pore size and centrifuged to remove air bubbles. Mineral oil was applied to prevent evaporation and the preparation was centrifuged again before running the samples.Transmission electron microscopy (TEM) sample preparation
TEM measurements were obtained using a JEM 2100 LaB6 microscope (JEOL, Tokyo, Japan) using an accelerating voltage of 200 kV. A small drop of heated ELP solution (37 °C) was pipetted on a plasma-treated carbon/formvar-coated 200-mesh copper grid (Ted Pella, Redding, CA, USA) and stained using heated 1% uranyl acetate solution. The excess liquid was wicked off using filter paper and the sample was dried at 37 °C.The images were processed and analyzed using ImageJ (NIH, USA).
Orthotopic xenograft of human breast cancer model
All animal experiments were performed in compliance with the guidelines established by the USC Institutional Animal Care and Use Committee. MDA-MB-231, a human breast cancer cell line, was suspended in DMEM and matrigel, and injected into the right mammary fat pad (2.5 × 10⁶ cells per mouse) and allowed to grow for 2 weeks before imaging.Preparation of AmBaSar-ELP conjugates
AmBaSar25 was activated by 1-ethyl-3-[3-dimethylaminopropyl]carbodiimide hydrochloride (EDC) and N-hydroxysulfosuccinimide (SNHS) at pH 4.0 for 30 min (4 °C), with molar ratio of AmBaSar:EDC:SNHS of 10:9:8. 5 mg of AmBaSar (11.1 μmol) and 1.9 mg of EDC (10 μmol) were dissolved in 100 μL of water. After mixing, 0.1 N NaOH (150 μL) was added to adjust the pH to 4.0. SNHS (1.9 mg, 8.8 μmol) was then added to the stirring mixture on an ice-bath, and pH was adjusted again to 4.0 by the addition of 0.1N NaOH. The reaction was allowed to incubate for 30 min at 4 °C. The theoretical concentration of active ester AmBaSar-OSSu was calculated to be 8.8 μmol. Then, 5–20 times AmBaSar-OSSu based on molar ratios was mixed with the protein polymer. The pH was adjusted to 8.5 using borate buffer (0.1 M, pH 8.5). The reaction was kept at 4 °C overnight. Size-exclusion PD10 chromatography was used to remove unreacted reagents from the protein polymer.Radiolabeling
The AmBaSar conjugates were labeled with 64Cu by addition of 1–5 mCi of 64Cu (10–50 nmol protein per mCi 64Cu) in 0.1 N ammonium acetate (pH 5.5) buffer followed by 45 min incubation at 40 °C. Before purifying the 64Cu-proteins using a PD10 column, DTPA (3 μL, 10 mM, pH 6.02) was added to remove 64Cu that weakly interacts with the peptide backbone.Stability of 64Cu-ELP-Sar constructs
Each of the constructs was incubated in fetal bovine serum (FBS, Life Technologies, Grand Island, NY) and PBS (Cellgro, Manassas, VA) for up to 48 hours to assess the stability of the complexed copper. Aliquots were removed and centrifuged using concentrator tubes (Corning, MWCO 10 k) at 10000 rpm for 10 min. After centrifugation the activity remaining on the filter and in the eluent was measured using a gamma scintillation counter. The percentage of radioisotope, F%, retained by the construct was calculated as follows: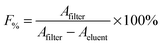 | (1) |
MicroPET imaging study
Molecular imaging was performed using a microPET R4 rodent model scanner (Concorde Microsystems, Knoxville, TN). Mice were injected with ∼100–150 μCi 64Cu-labeled ELP via the tail vein. For imaging, the mice were anaesthetized with 2% isofluorane and placed near the center of the field of view (FOV), where the highest resolution and sensitivity are obtained. Static scans were obtained at 0.08, 0.75, 1.33, 2.5, 4, 24 and 48 h post injection. The images were reconstructed by a two dimensional ordered subsets expectation maximum (2D-OSEM) algorithm.Quantitative analysis of PET images
Time-activity biodistribution for selected tissues was obtained by drawing regions of interest (ROI) over the tissue area. The counts per pixel per min obtained from the ROI were converted to counts per ml min−1 by using a calibration constant obtained from scanning a cylinder phantom in the microPET scanner. The ROI counts per ml min−1 were converted to counts per g min−1, assuming a tissue density of 1 g ml−1, and divided by the injected dose to obtain an image ROI-derived percent injected dose of 64Cu tracer retained per gram of tissue (%ID g−1). As a proxy for the blood concentration, the time-activity curve data obtained from the heart was fit to a one-phase exponential decay curve using Prism (GraphPad Sortware Inc., San Diego, CA). To better quantify the data obtained by microPET imaging, this data was also fit using a customized 6-compartment model using SAAM II (University of Washington, Seattle, WA) [see ESI†]. To identify significant differences in kinetic parameters between groups (4 protein polymer groups, n = 3 per group), global ANOVA was first assessed (p < 0.05) and followed by a post-hoc Tukey HSD (p values reported in text).Results
Preparation and characterization of ELPs and ELP-Sar constructs
As particle diameter significantly influences the nanoparticle fate in vivo,33,34 we extensively characterized the assembly properties of the ELPs evaluated in this study (Table 1). These four protein polymers were selected to determine if the effect of molecular weight (A96 vs. A192), guest residue (A192 vs. S192), and nanoparticle assembly (A192 vs. A96I96). To promote effective blood circulation, all four ELPs were designed to be soluble at physiological temperature; however, the diblock copolymer A96I96 was designed to assemble nanoparticles at ∼20 °C. The behavior of each ELP was characterized using dynamic light scattering (DLS) to identify the hydrodynamic radii, Rh, (25 μM, 37 °C) of 5.2 ± 0.6 nm, 7.1 ± 0.5 nm, 7.4 ± 0.4 nm and 37.4 ± 2.5 nm for A96, A192, S192 and A96I96 respectively (Fig. 2a). Modification of these polymers at the amino terminus with the heterobifunctional chelator AmBaSar (Sar) had a negligible effect on these radii (Fig. 2a). To determine if the conjugation altered the assembly properties of the ELP block copolymer, A96I96, a temperature ramp was used to monitor the thermal assembly of the nanoparticle forming construct A96I96 and A96I96-Sar (Fig. 2b). While modification with Sar induced a minor depression in the critical micelle temperature (CMT), both the labeled and unlabeled constructs form nanoparticles at physiological temperature with a stable Rh of ∼40 nm. DLS was also used to characterize the distribution of hydrodynamic radii for ELPs A96, A192, and S192 at physiological temperature (Fig. 2c) and also for the block copolymer A96I96 at 10 and 37 °C (Fig. 2d), which indicates the ability of this polymer to assemble from a monomer to nanoparticle. Based on previous characterization, A96I96 will retain its self-assembling properties at a concentration far below than what is used in this study (Fig. S3, ESI†). Thus, it is expected that its structure will remain micellar at the point of administration and initial circulation.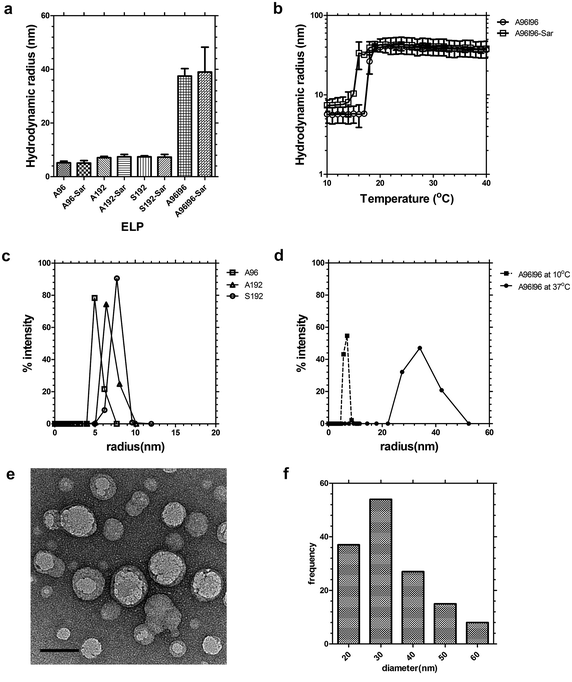 | ||
| Fig. 2 ELP diblock copolymers assemble nanoparticles at physiological temperatures. Dynamic light scattering (DLS) was used to characterize the hydrodynamic radius of the protein polymers in phosphate buffered saline. (a) Hydrodynamic radius (Rh) of A96, A192, S192 and A96I96 at 37 °C before and after modification with AmBaSar (Sar). The ELP block copolymer A96I96 assembles nanoparticles. Bars represent mean ± SD. (b) Above 15–18 °C, A96I96 forms nanoparticles of stable hydrodynamic radii at 25 μM. (c) Distribution of hydrodynamic radii for linear ELPs at 37 °C. (d) Distribution of hydrodynamic radii for ELP block copolymer A96I96 at 10 and 37 °C. (e) Transmission electron microscopy (TEM) of negatively stained A96I96 nanoparticles (white round objects) with an average particle diameter of 33.3 ± 11.5 nm stained with uranyl acetate (black clusters). Scale bar 50 nm. (f) Histogram of A96I96 nanoparticles (n = 141) was obtained using image analysis across 9 TEM images. | ||
As independent confirmation of nanoparticle assembly, negative-stained transmission electron microscopy (TEM) was used to observe contrast-excluding (light) nanoparticles of A96I96 (Fig. 2e). These particles appeared as round, monodisperse particles with a diameter of 33.3 ± 11.5 nm (Fig. 2f). In this case, the radius of the particles by TEM is approximately half of that observed by DLS, which may result from several possible causes: (i) the hydrophilic block includes a significant fraction of water in solution, which increases the hydrodynamic radii compared to a sample dried for TEM; and (ii) the hydrophobic core of A96I96 nanoparticles excludes uranyl acetate contrast, while the hydrophilic corona does not. Currently, we are unable to distinguish between these possibilities; however, both DLS and TEM indicate that the diblock copolymer A96I96 assembles homogenous particles at physiological temperature.
Stability of radiolabeled 64Cu-ELP-Sar constructs
A stability assay was performed to confirm that 64Cu remains associated with the ELP over a 48 h time period and that the biodistribution patterns observed are not from dissociated, free 64Cu. Due to the half-life of 64Cu (12.7 h) measurement beyond 48 h time point is less useful as only minimal counts will be detected due to radiological decay. The PBS solution tests the stability of the chelator to retain the radioisotope, while the serum solution mimics the proteinacious environment during circulation. Fig. 3a and b show minimal loss of 64Cu from A96 and A192 until around 48 hours. The radiochemical retention of the constructs remained high (>98%) for 48 h in phosphate buffered saline. However, a slightly greater reduction in percentage retention for S192 and A96I96 was detected under the same conditions (Fig. 3c and d). A96 and A192 also showed relatively high serum stability. Conversely the stability of the constructs S192 and A96I96 suffers slightly more in serum (∼83 and 75% respectively). A two-way ANOVA (F7,14 = 43.1, R2 = 0.956, p = 2 × 10⁻⁸) at the 48 hour time point showed that all ELPs lose retention in serum compared to PBS (p = 3 × 10⁻⁶). Loss of retention depended significantly on the ELP identity (p = 1 × 10⁻⁸), with S192 (p = 5 × 10⁻⁵vs. A192) and A96I96 (p = 2 × 10⁻⁸vs. A192). A96 and A96I96 were statistically indistinguishable. This suggests that the polymer architecture may play a role in the stability of the chelators strategy; however, all four polymers were stable for 24 hours in serum.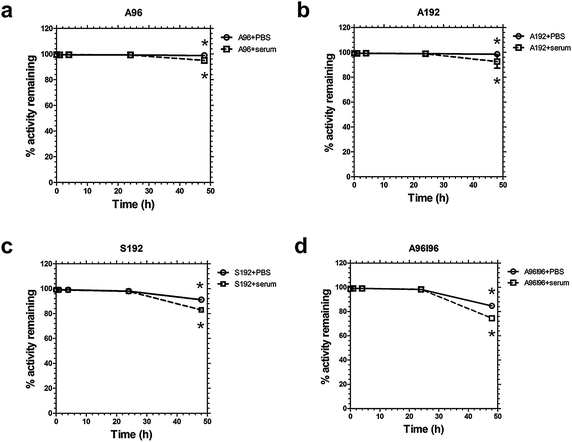 | ||
| Fig. 3 64Cu-ELP constructs are stable in serum for 24 hours. Stability of radiolabeled ELPs over 48 h in serum and PBS was measured using retention in a dialysis cassette. (a) A96, (b) A192, (c) S192, and (d) A96I96. A two-way ANOVA at the 48 hour time point showed that all ELPs lose retention in serum compared to PBS (p = 3 × 10⁻⁶). Loss of retention depended significantly on the ELP identity (p = 1 × 10⁻⁸), with S192 and A96I96 losing significantly more than A192. Bars represent mean ± SD (n = 3/group). | ||
In vivo microPET imaging of protein polymers
Using biodistribution and microPET imaging, the influence of macromolecular structure on biodistribution and blood circulation was evaluated by examining the performance of nanoparticles derived from different ELPs namely, A96, S192, A192 and A96I96 (Fig. 4). To this end 64Cu-labeled ELPs were administered intravenously to nude tumor-bearing mice, and the blood retention, tumor accumulation, and sequestration in the major excretory organs (liver, kidneys) was observed. Upon administration (5 min) high levels of activity were observed in the heart, suggesting retention of nanoparticles in the circulation. To ensure the accuracy of the analysis, the heart signal was traced through all the imaging slices so as to avoid any additive signal from other overlapping tissues. Activity in the heart remained high even after 4 h for A192, S192 and A96I96; however, a significant reduction in signal was observable for A96. For all constructs, the heart signal diminishes to approximately one tenth of its initial concentration by 24 hours post injection. What was unexpected was that the amount of signal in the heart remained relatively constant between 24 and 48 hours, which suggested that the remaining isotope is no longer freely circulating in the blood. Uptake of 64Cu-ELPs by the liver is apparent, suggesting that this is the primary route of clearance for ELPs above the renal filtration cutoff for A192, S192 and A96I96. In contrast, the liver accumulation of A96 was lower than for other constructs.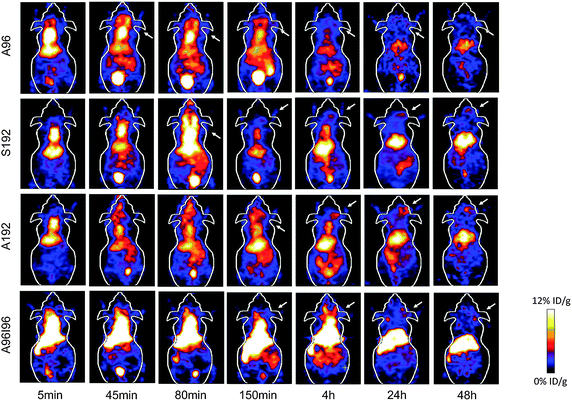 | ||
| Fig. 4 Serial microPET imaging of protein polymer nanoparticles in an orthotopic model of human breast cancer. 64Cu-labelled ELPs were administered systemically to mice carrying MDA-MB-231 tumors. Serial imaging was performed, and coronal images centered on the tumor for A96, A192, S192 and A96I96 are depicted at 0.08, 0.75, 1.33, 2.5, 4, 24 and 48 h post injection. A representative mouse is shown from each group (n = 3/group). Within each 5 min panel, two major pools of blood are present in the heart (top) and liver (middle). At later time points, the gastro-intestinal track (lower) and the bladder (bottom) enhance in contrast. The tumor locations are indicated by arrows. | ||
Quantitative analysis of PET images
To gain an estimate of the rate of blood clearance, the heart intensity was monitored over time. The time-activity curve of the heart showed that A192, S192, A96I96 and to a lesser extent A96, were still circulating in the blood stream after 4 h, but all approached the background signal found in the muscle by 24 h (Fig. 5a). By fitting an exponential decay curve to the data, a correlation coefficient r2 > 0.97 was obtained for each protein polymer (Fig. 5b). The heart-activity half-life for A96, A192, S192 and A96I96 was determined to be 2.1, 8.7, 8.3, and 7.3 h respectively, where A96 was cleared significantly faster than the other constructs.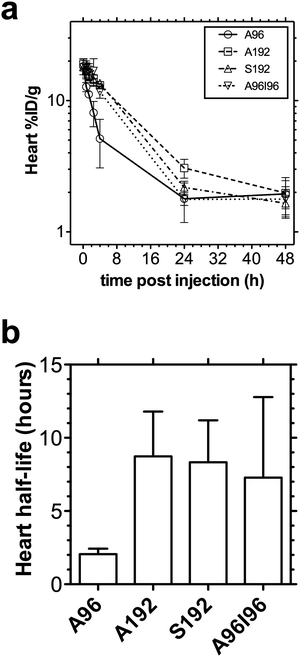 | ||
| Fig. 5 Non-compartmental pharmacokinetics of 64Cu-ELPs in the heart. (a) The time activity curve of blood concentration can be estimated using the intensity in the heart as a surrogate measure, whereby 64Cu-ELPs (n = 3/group) are expressed as %ID g−1. Values indicate the mean ± 95%CI. (b) By fitting the initial rate of log-linear decay (0–4 hours for A96; 0–24 hours for A192, S192 and A96I96), the half-life of activity in the heart was indicated as the mean ± 95%CI. | ||
In addition to the heart half-life, serial microPET imaging was used to estimate the kinetics and magnitude of accumulation in several other easily identifiable tissues (Fig. 6). Especially for the earlier time points, the tissues in the chest and abdominal cavity seem to overlap, making quantification difficult. However, since these tissues are easily discernible at later time points, we used the locations determined here, to guide the positioning of the ROI that optimally captures the different tissues with minimal overlap. Time-activity curves corresponding to the kidneys, liver and muscle (Fig. 6a–c) are presented. From these results, no obvious differences were observed between the constructs in terms of muscle accumulation (Fig. 6a). A96, the shortest and lowest molecular weight construct, exhibited the highest kidney uptake (Fig. 6c). Renal clearance of A96 occurs rapidly until it plateaus at 4 h post injection. Conversely the extent of renal clearance of A192, S192 and A96I96 was relatively low over time (Fig. 6b).
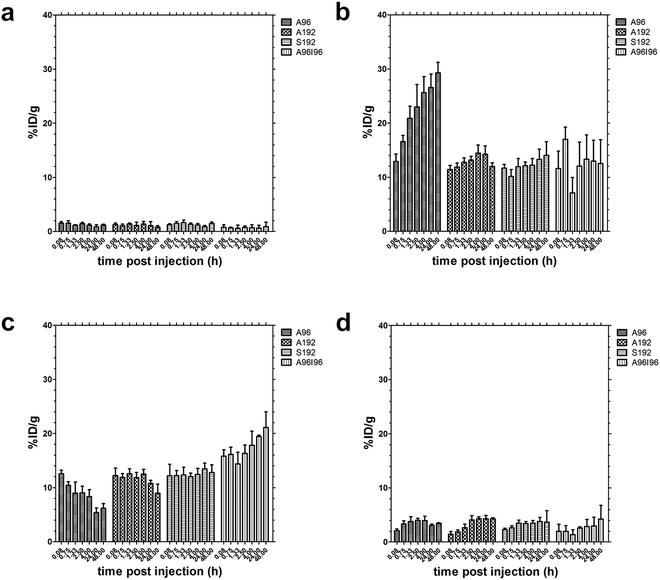 | ||
| Fig. 6 Biodistribution of 64Cu-ELP in athymic nude mice implanted with MDA-MB-231 cell line (n = 3) within (a) muscle, (b) kidneys, (c) liver and (d) tumor expressed as %ID g−1 calculated from ROI image analysis. A96 accumulates over time in the kidneys, while A192 and S192 do not. A96I96 accumulates over time in the liver. Values indicate the mean ± 95%CI. | ||
All 64Cu-ELP-Sar constructs exhibited hepatic clearance in varying degrees (Fig. 6c). Considering that A192, S192 and A96I96 have a hydrodynamic radius that is larger than the cutoff point for renal filtration; these constructs appear to be cleared primarily via immobilization in the liver. Notably, the liver accumulation for diblock copolymer A96I96 is more prominent compared to the monoblock ELPs, which is consistent with expectations of a nanoparticle. Hepatic concentrations for S192 reaches a maximum at 24 h where they remained constant until 48 h post injection. In contrast there was a decrease in liver accumulation over time for A192 and A96. A96 exhibited the lowest accumulation in the liver, perhaps due to its ability to be cleared by the kidney.
Tumor uptake profiles (Fig. 6d) are slightly different for each construct during the first hour post injection; A96 exhibits the earliest detectable tumor signal, which subsequently decreases, perhaps due to its lower molecular weight and higher vascular permeability. For both S192 and A192, the tumor signal can be easily detected at 45 and 80 min respectively and remained constant for the duration of the study. In contrast, a steady increase in tumor uptake can be observed with the nanoparticle-forming A96I96. Despite differences in the kinetics of uptake, all four constructs achieved a similar tumor concentration in the range of 3–4%ID g−1 body weight.
Discussion
Among the factors that affect pharmacokinetics and biodistribution are the architecture and molecular weight of the nanocarriers.35 Through genetic engineering we can easily manipulate and control both factors when designing protein polymer-based nanocarriers. Here we present a study to determine if ELP nanoparticles can be tracked using serial molecular imaging via stable24,36 chelation (AmBaSar) of a positron emitter (64Cu) with a sufficient radiological half-life to image distribution over several days (Fig. 1). We explored the hypothesis that protein polymer architecture would influence the kinetics and magnitude of biodistribution. Long-circulation is an important feature of nanomedicines; furthermore, we were encouraged to observe that nanoparticle assembly of A96I96 has minimal effect on the half-life of activity in the heart (Fig. 5b); however, assembly moderately redirects clearance to the liver (Fig. 6c). For soluble ELPs with Xaa = Ala or Xaa = Ser, there were minimal differences between route of clearance or apparent kinetics of biodistribution. Our predominant finding was that the lower molecular weight ELP, A96, clears via the kidney compared to the larger molecular weight protein polymers, A192, S192, and A96I96. Using this dataset, we then explored an image-driven pharmacokinetic modeling platform to interpret the behavior of these potential drug carriers.19,37One of the challenges to the field of nanomedicine is the identification of patient-specific and tissue-specific biodistribution patterns and the development of a platform for interpreting this information.38 Typical preclinical tumor models average data across multiple animals to characterize biodistribution and pharmacokinetics, which are not translational approaches.39,40 In contrast, the molecular imaging approach used here can deliver quantitative spatio-temporal data within an individual. Armed with this information, clinicians and engineers can develop personalized pharmacokinetic models that directly describe the fate of nanomedicines within their patients. More importantly, this information may directly answer the question of whether or not a given nanoparticle preferentially interacts with its target in a patient.
To address this challenge, we developed a modeling approach related to one recently described by Qin and co-workers19 to decouple the tissue and blood pharmacokinetics (Fig. 7). This model provides pharmacokinetic rate constants that describe the distribution of protein polymers (Table 2); however, this approach may be useful to track any nanoparticles via quantified molecular imaging. Only tissues that could be clearly identified from microPET imaging were incorporated into the model fit; furthermore, the muscle compartment thus represents both muscle and unaccounted-for tissues, which may include bone, adipose, lung, etc.). After exploring a number of plausible models, we constructed a robust 6-compartment model (Fig. 7a) based on the following assumptions: (i) a bolus of the drug (ex1) enters the blood (q1) at time zero and distributes instantly into an apparent volume of distribution, V1; (ii) the activity in any tissue (s1-heart; s2-liver; s3-tumor; s4-kidney; and s5-muscle) is the weighted fractions, ftissue, of activity in the blood compartment (q1) divided by V1 and extravascular tissue compartment (q2-liver; q3-tumor; q4-kidney; q5-muscle; and q6-heart) divided by the mass of that tissue; (iii) the rate constant for influx from the blood into a tissue (k(2,1)-liver; k(3,1)-tumor; k(4,1)-kidney; k(5,1)-muscle; k(6,1)-heart) is much larger than the rate of efflux, which allows the rate of efflux to be neglected over short duration studies; and (iv) the blood clearance via each route is given by Cltissue = ktissueV1. These assumptions combined with estimates for the mass of the tumor, muscle, heart, liver, and kidneys (Table 2), make it possible to fit the pharmacokinetic profile for individual mice using nonlinear multiple regression with a compartmental modeling software package (SAAM II).
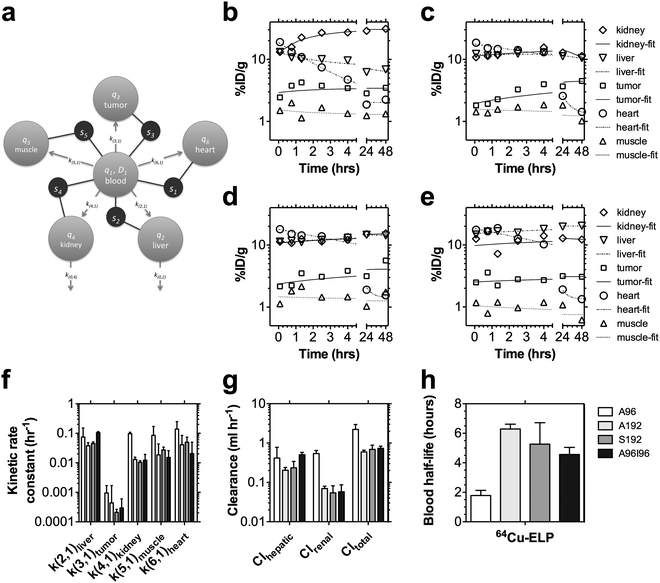 | ||
| Fig. 7 Pharmacokinetic modeling in individuals based on microPET imaging. (a) A multi-compartment model was developed to perform a simultaneous fit to the observed tissue concentrations in the heart, liver, tumor, kidney, and muscle (s1, s2, s3, s4, and s5 respectively) within each individual after an i.v. bolus of A96, A192, S192 and A96I96 (n = 3/group) (Table 2). MicroPET concentrations were modeled to contain a fraction of signal from both an intravascular (q1) and extravascular (q2, q3, q4, q5, q6) tissue component. This model was fit to every individual, and a representative individual is presented following administration of (b) A96, (c) A192, (c) S192, and (e) A96I96. (f) A comparison is presented of the five kinetic parameters exiting the central blood compartment, q1. (g) The renal and hepatic clearance are compared to the total clearance from the central blood compartment, q1. (h) Fitting observable tissue concentrations, enabled the non-invasive estimation of the blood half-life. (f–g) Values depict the Mean ± 95% CI (n = 3). | ||
| Parameter | 64Cu-A96 (n = 3) | 64Cu-A192 (n = 3) | 64Cu-S192 (n = 3) | 64Cu-A96I96 (n = 3) | Overall (n = 12) |
|---|---|---|---|---|---|
| Mean ± SD | Mean ± SD | Mean ± SD | Mean ± SD | Mean ± SD | |
| a Parameter fixed based on 0.63, 1.2, and 4.6% of body weight (g) for heart, kidneys, and liver respectively, all non-invasive estimates.b Parameter fixed as mass given by tumor length × width2/2, a non-invasive estimate.c Parameter fixed based on mouse body weight minus the mass of other tissues, a non-invasive estimate. | |||||
| mlivera (g) | 0.97 ± 0.01 | 0.96 ± 0.07 | 0.95 ± 0.06 | 0.98 ± 0.10 | 0.96 ± 0.06 |
| mtumorb (g) | 0.057 ± 0.015 | 0.068 ± 0.073 | 0.046 ± 0.030 | 0.060 ± 0.058 | 0.058 ± 0.043 |
| mkidneya (g) | 0.247 ± 0.002 | 0.244 ± 0.018 | 0.243 ± 0.014 | 0.250 ± 0.024 | 0.246 ± 0.015 |
| mmusclec (g) | 19.5 ± 0.2 | 19.2 ± 1.5 | 19.1 ± 1.1 | 19.7 ± 1.9 | 19.4 ± 1.2 |
| mhearta (g) | 0.132 ± 0.001 | 0.130 ± 0.010 | 0.129 ± 0.008 | 0.133 ± 0.013 | 0.131 ± 0.008 |
| V1 (ml) | 5.6 ± 0.3 | 5.4 ± 0.4 | 5.2 ± 0.3 | 4.8 ± 0.3 | 5.2 ± 0.4 |
| fliver | 0.67 ± 0.04 | 0.65 ± 0.05 | 0.62 ± 0.07 | 0.70 ± 0.06 | 0.66 ± 0.06 |
| ftumor | 0.14 ± 0.01 | 0.09 ± 0.02 | 0.14 ± 0.01 | 0.08 ± 0.05 | 0.11 ± 0.04 |
| fkidney | 0.70 ± 0.09 | 0.63 ± 0.07 | 0.56 ± 0.04 | 0.54 ± 0.11 | 0.61 ± 0.09 |
| fmuscle | 0.083 ± 0.002 | 0.066 ± 0.019 | 0.071 ± 0.010 | 0.029 ± 0.021 | 0.062 ± 0.025 |
| fheart | 0.993 ± 0.002 | 0.993 ± 0.002 | 0.994 ± 0.001 | 0.941 ± 0.052 | 0.980 ± 0.032 |
| k(2,1)liver (h−1) | 0.075 ± 0.030 | 0.038 ± 0.004 | 0.045 ± 0.006 | 0.105 ± 0.010 | 0.066 ± 0.031 |
| k(3,1)tumor (h−1) | 0.0009 ± 0.0003 | 0.0004 ± 0.0005 | 0.0002 ± 0.0001 | 0.0003 ± 0.0003 | 0.0005 ± 0.0004 |
| k(4,1)kidney (h−1) | 0.097 ± 0.005 | 0.013 ± 0.001 | 0.010 ± 0.001 | 0.012 ± 0.007 | 0.033 ± 0.039 |
| k(5,1)muscle (h−1) | 0.086 ± 0.034 | 0.019 ± 0.010 | 0.027 ± 0.007 | 0.015 ± 0.011 | 0.037 ± 0.034 |
| k(6,1)heart (h−1) | 0.14 ± 0.04 | 0.04 ± 0.02 | 0.05 ± 0.02 | 0.02 ± 0.03 | 0.06 ± 0.05 |
| k(0,2)liver (h−1) | 0.001 ± 0.003 | 0.009 ± 0.006 | 0.001 ± 0.001 | 0.001 ± 0.002 | 0.003 ± 0.005 |
| k(0,4)kidney (h−1) | 0.001 ± 0.002 | 0.011 ± 0.004 | 0.001 ± 0.002 | 0.002 ± 0.001 | 0.004 ± 0.005 |
| thalf,blood (h) | 1.8 ± 0.3 | 6.3 ± 0.3 | 5.3 ± 0.6 | 4.6 ± 0.5 | 4.5 ± 1.8 |
| Clhepatic (ml h−1) | 0.41 ± 0.15 | 0.20 ± 0.03 | 0.24 ± 0.04 | 0.51 ± 0.08 | 0.34 ± 0.15 |
| Clrenal (ml h−1) | 0.54 ± 0.04 | 0.07 ± 0.01 | 0.05 ± 0.01 | 0.06 ± 0.03 | 0.18 ± 0.22 |
| Cltotal (ml h−1) | 2.2 ± 0.3 | 0.6 ± 0.1 | 0.7 ± 0.1 | 0.7 ± 0.1 | 1.1 ± 0.7 |
The results of fitting this model (Fig. 7a) within representative mice administered with A96, A192, S192, and A96I96 are presented (Fig. 7b–e). A summary of the best-fit parameters for each protein polymer is provided (Table 2); furthermore, the kinetic rate constants for materials exiting the central blood compartment are plotted (Fig. 7f). The most notable observation is that the rate constant for influx into the tumor, k(3,1), is lower than for the other tissues. To a reasonable approximation the rate constants are proportional to the apparent permeability from the blood across the vasculature multiplied by the surface area of the vasculature.19 Naturally, large and highly vascularized tissues such as the liver, kidney, and heart are the major sinks for nanoparticles in circulation. When quantified using molecular imaging, the ‘muscle’ compartment represents simply a background compartment for uptake into the remaining mass of the animal that is unaccounted for by the other quantified tissues. Therefore, even though the apparent permeability into the ‘muscle’ compartment q5 may be low, the large surface area represented by all of the vasculature throughout the body makes q5 a substantial sink for the protein polymers (Fig. 7f). In contrast, the tumor may have a relatively low surface area due to their small mass 50–100 mg and limited vascularity.
Regardless of differences in magnitude between the kinetic rate constants exiting the central blood compartment, these rate constants (Fig. 7f) are powerful parameters for comparing tissue influx between different protein polymers. For example, the protein polymer nanoparticle (A96I96) have a large hydrodynamic radius compared to monomeric protein polymers of a similar molecular weight (A192, S192). Thus, they may reasonably be expected to increase their influx, k(2,1), into the liver. In fact, this approach detected a significant increase in the hepatic efflux of A96I96 k(2,1) = 0.11 ± 0.01 h−1 (SD, n = 3) vs. that for A192 with k(2,1) = 0.038 ± 0.004 h−1 (SD, n = 3, p = 0.005 vs. A96I96) and S192 with k(2,1) = 0.045 ± 0.006 h−1 (SD, n = 3, p = 0.009 vs. A96I96). In contrast, the data (Fig. 6b) also suggested that the renal influx for the lower molecular weight ELP, A96, would be relatively high. Likewise, this model revealed a significant increase in the influx rate into the kidney for A96 of k(4,1) = 0.097 ± 0.005 h−1 (SD, n = 3) vs. that for A192 with k(4,1) = 0.013 ± 0.001 h−1 (SD, n = 3, p = 5 × 10⁻⁸vs. A96), S192 with k(4,1) = 0.010 ± 0.001 h−1 (SD, n = 3, p = 4 × 10⁻⁸vs. A96), and A96S96 with k(4,1) = 0.012 ± 0.007 h−1 (SD, n = 3, p = 5 × 10⁻⁸vs. A96). Without analyzing waste byproducts (feces, urine) this modeling approach can also estimate the renal and hepatic blood clearance (Fig. 7g). Prolonged blood circulation is achieved by avoiding rapid renal clearance and opsonization by the mononuclear phagocytic system (MPS).41 Renal clearance can be slowed for nanocarriers with a hydrodynamic diameters greater than 5.5 nm.42 This was supported by the data obtained for A96 and A192 (Fig. 2a). Being the ELP with the shortest pentameric repeat with the smallest hydrodynamic radius, it is unsurprising that A96 was cleared more by the kidneys and has the shortest heart-activity half-life. Conversely an improved half-life was observed with the larger constructs. These exhibited similar circulation half-life regardless of the identity of the guest residue (A192 vs. S192) or nanostructure adopted (monomeric vs. nanoparticle).
In addition to quantifying the rate of tissue efflux, this model allows us to decouple the tissue activities from the concentration of the drug remaining in the blood, enabling the non-invasive estimation of the half-life in the blood (Fig. 7h). These values confirm that the half-life of activity in the heart (Fig. 4b) is a reasonable proxy measure for the half-life in the blood. However, the model (Fig. 7a) removes the potentially confounding accumulation of radioisotopes in the heart tissue, which dominate the signal at long time points (>24 hours). A192 has the longest blood half-life thalf,blood = 6.3 ± 0.3 h (SD, n = 3) vs. that for A96 with thalf,blood = 1.8 ± 0.3 h (SD, n = 3, p = 8 × 10⁻⁶vs. A192) and A96I96 with thalf,blood = 4.6 ± 0.5 h (SD, n = 3, p = 0.006 vs. A192). The blood half-lives for A192 and S192 did not differ significantly. Lastly, the rate constant for tumor influx trended towards faster transfer for A96 than for the other polymers; however, this effect was not significant. In future studies, we will use this model to explore whether k(3,1) can be influenced by ligands for tumor vasculature-specific transport processes.
In this study, no active targeting moiety was appended to the carriers and tumor sequestration was achieved only through passive or non-specific uptake mechanisms such as the enhance permeability retention (EPR) effect.43 While all of the constructs do exhibit tumor accumulation, no significant difference in extent of the accumulation was observed (Fig. 6d, 7f). Other than passive accumulation, no effort was made to characterize target-mediated delivery to the tumor; however, this model may have potential applications in future studies of targeted therapeutics. Active targeted delivery of therapeutic agents to tumor tissue remains a promising approach to improve cancer treatment, as it may deliver higher doses to tumor sites while minimizing exposure to normal tissues. This work shows that it is possible to tailor make specific protein polymer nanocarriers that shift their clearance from renal to hepatic routes of elimination; furthermore, both monomeric (A192) and nanoparticulate (A96I96) carriers appear to remain viable platforms for delivery. Partnered with molecular imaging to quickly select drug carriers with the most selective tumor accumulation, these protein polymer nanoparticles are an emerging solution to nanotherapeutics engineering.
Conclusion
Using microPET imaging this manuscript describes the effect of amino acid composition, molecular weight, and nanostructure on the biodistribution and pharmacokinetics of several ELP protein polymers. These data were interpreted using a customized six-compartment, image-driven pharmacokinetic model. The ELP diblock copolymer (A96I96) that assembles into nanoparticles is cleared more rapidly by the liver than a monoblock ELP (A192); however, the primary determinant of the blood half-life appears to be the ELP molecular weight. Through molecular imaging of stable AmBaSar/64Cu chelates, this library of protein polymers may now be optimized using non-invasive imaging to carry therapeutic proteins and drugs.Acknowledgements
This work was made possible by the University of Southern California, the National Institutes of Health R21EB012281, P30 CA014089 to the Norris Comprehensive Cancer Center, the Wright Foundation, the Stop Cancer Foundation, the American Cancer Society, the USC Ming Hsieh Institute to J.A.M., 121991-MRSG-12-034-01-CCE to Z.L., the USC Molecular Imaging Center, the USC Nanobiophysics Core Facility, and the Translational Research Laboratory at the School of Pharmacy. SMJ is a recipient of a Malaysian Public Services Department scholarship.References
- J. A. MacKay, et al. Self-assembling chimeric polypeptide-doxorubicin conjugate nanoparticles that abolish tumours after a single injection, Nat. Mater., 2009, 8, 993–999 CrossRef.
- D. E. Meyer, G. A. Kong, M. W. Dewhirst, M. R. Zalutsky and A. Chilkoti, Targeting a genetically engineered elastin-like polypeptide to solid tumors by local hyperthermia, Cancer Res., 2001, 61, 1548–1554 CAS.
- S. Aluri, S. M. Janib and J. A. Mackay, Environmentally responsive peptides as anticancer drug carriers, Adv. Drug Delivery Rev., 2009, 61, 940–952 CrossRef CAS.
- V. Schellenberger, et al., A recombinant polypeptide extends the in vivo half-life of peptides and proteins in a tunable manner, Nat. Biotechnol., 2009, 27, 1186–1190 CrossRef CAS.
- K. Numata and D. L. Kaplan, Silk-based delivery systems of bioactive molecules, Adv. Drug Delivery Reviews., 2010, 62, 1497–1508 CrossRef CAS.
- J. L. Frandsen and H. Ghandehari, Recombinant protein-based polymers for advanced drug delivery, Chem. Soc. Rev., 2012, 41, 2696–2706 RSC.
- M. Shah, P.-Y. Hsueh, G. Sun, H. Y. Chang, S. M. Janib and J. A. MacKay, Biodegradation of Elastin-like Polypeptide Nanoparticles, Protein Sci., 2012, 21, 743–750 CrossRef CAS.
- G. Sun, P. Y. Hsueh, S. M. Janib, S. Hamm-Alvarez and J. A. MacKay, Design and cellular internalization of genetically engineered polypeptide nanoparticles displaying adenovirus knob domain, J. Controlled Release, 2011, 155, 218–226 CrossRef CAS.
- W. Hassouneh, et al., Unexpected Multivalent Display of Proteins by Temperature Triggered Self-Assembly of Elastin-like Polypeptide Block Copolymers, Biomacromolecules, 2012, 13, 1598–1605 CrossRef CAS.
- J. K. Willmann, N. van Bruggen, L. M. Dinkelborg and S. S. Gambhir, Molecular imaging in drug development, Nat. Rev. Drug Discovery, 2008, 7, 591–607 CrossRef CAS.
- S. M. Janib, A. S. Moses and J. A. MacKay, Imaging and drug delivery using theranostic nanoparticles, Adv. Drug Delivery Rev., 2010, 62, 1052–1063 CrossRef CAS.
- J. Condeelis and R. Weissleder, In vivo Imaging in Cancer, Cold Spring Harbor Perspect. Biol., 2010, 2, 1–22 CrossRef.
- Z. Li and P. S. Conti, Radiopharmaceutical chemistry for positron emission tomography, Adv. Drug Delivery Rev., 2010, 62, 1031–1051 CrossRef CAS.
- M. E. Phelps, Positron emission tomography provides molecular imaging of biological processes, Proc. Natl. Acad. Sci. U. S. A., 2000, 97, 9226–9233 CrossRef CAS.
- P. Price, PET as a potential tool for imaging molecular mechanisms of oncology in man, Trends Mol. Med., 2001, 7, 442–446 CrossRef CAS.
- S. Liu, Bifunctional coupling agents for radiolabeling of biomolecules and target-specific delivery of metallic radionuclides, Adv. Drug Delivery Rev., 2008, 60, 1347–1370 CrossRef CAS.
- T. J. Wadas, E. H. Wong, G. R. Weisman and C. J. Anderson, Coordinating Radiometals of Copper, Gallium, Indium, Yttrium, and Zirconium for PET and SPECT Imaging of Disease, Chem. Rev., 2010, 110, 2858–2902 CrossRef CAS.
- M. Shokeen and C. J. Anderson, Molecular Imaging of Cancer with Copper-64 Radiopharmaceuticals and Positron Emission Tomography (PET), Acc. Chem. Res., 2009, 42, 832–841 CrossRef CAS.
- S. Qin, et al., An imaging-driven model for liposomal stability and circulation, Mol. Pharmacol, 2010, 7, 12–21 CrossRef CAS.
- K.-i. Fukukawa, et al., Synthesis and Characterization of Core–Shell Star Copolymers for In vivo PET Imaging Applications, Biomacromolecules, 2008, 9, 1329–1339 CrossRef CAS.
- E. Andreozzi, J. W. Seo, K. Ferrara and A. Louie, Novel Method to Label Solid Lipid Nanoparticles with 64Cu for Positron Emission Tomography Imaging, Bioconjugate Chem., 2011, 22, 808–818 CrossRef CAS.
- C.-W. Huang, Z. Li, H. Cai, T. Shahinian and P. S. Conti, Biological Stability Evaluation of the α2β1 Receptor Imaging Agents: Diamsar and DOTA Conjugated DGEA Peptide, Bioconjugate Chem., 2011, 22, 256–263 CrossRef CAS.
- N. Di Bartolo, A. M. Sargeson and S. V. Smith, New 64Cu PET imaging agents for personalised medicine and drug development using the hexa-aza cage, SarAr, Org. Biomol. Chem., 2006, 4, 3350–3357 CAS.
- S. D. Voss, et al., Positron emission tomography (PET) imaging of neuroblastoma and melanoma with 64Cu-SarAr immunoconjugates, Proc. Natl. Acad. Sci. U. S. A., 2007, 104, 17489–17493 CrossRef CAS.
- H. Cai, J. Fissekis and P. S. Conti, Synthesis of a novel bifunctional chelator AmBaSar based on sarcophagine for peptide conjugation and 64Cu radiolabelling, Dalton Trans., 2009, 5395–5400 RSC.
- D. W. Urry, Physical chemistry of biological free energy transduction as demonstrated by elastic protein-based polymers, J. Phys. Chem. B, 1997, 101, 11007–11028 CrossRef CAS.
- D. E. Meyer, B. C. Shin, G. A. Kong, M. W. Dewhirst and A. Chilkoti, Drug targeting using thermally responsive polymers and local hyperthermia, J. Controlled Release, 2001, 74, 213–224 CrossRef CAS.
- D. E. Meyer and A. Chilkoti, Quantification of the effects of chain length and concentration on the thermal behavior of elastin-like polypeptides, Biomacromolecules, 2004, 5, 846–851 CrossRef CAS.
- A. Chilkoti, M. R. Dreher and D. E. Meyer, Design of thermally responsive, recombinant polypeptide carriers for targeted drug delivery, Adv. Drug Delivery Rev., 2002, 54, 1093–1111 CrossRef CAS.
- J. A. Mackay, D. J. Callahan, K. N. Fitzgerald and A. Chilkoti, Quantitative Model of the Phase Behavior of Recombinant pH-Responsive Elastin-Like Polypeptides, Biomacromolecules, 2010, 11, 2873–2879 CrossRef CAS.
- J. R. McDaniel, J. A. Mackay, F. G. Quiroz and A. Chilkoti, Recursive directional ligation by plasmid reconstruction allows rapid and seamless cloning of oligomeric genes, Biomacromolecules, 2010, 11, 944–952 CrossRef CAS.
- E. Golemis and P. D. Adams, Protein–protein interactions: a molecular cloning manual, Cold Spring Harbor Laboratory Press, Cold Spring Harbor, N.Y., 2005, edn 2nd Search PubMed.
- S.-D. Li and L. Huang, Pharmacokinetics and Biodistribution of Nanoparticles, Mol. Pharmaceutics, 2008, 5, 496–504 CrossRef CAS.
- M. R. Longmire, M. Ogawa, P. L. Choyke and H. Kobayashi, Biologically Optimized Nanosized Molecules and Particles: More than Just Size, Bioconjugate Chem., 2011, 22, 993–1000 CrossRef CAS.
- C. C. Lee, J. A. MacKay, J. M. Frechet and F. C. Szoka, Designing dendrimers for biological applications, Nat. Biotechnol., 2005, 23, 1517–1526 CrossRef CAS.
- H. Cai, et al., Evaluation of Copper-64 Labeled AmBaSar Conjugated Cyclic RGD Peptide for Improved MicroPET Imaging of Integrin αvβ3 Expression, Bioconjugate Chem., 2010, 21, 1417–1424 CrossRef CAS.
- L. E. Gerlowski and R. K. Jain, Physiologically based pharmacokinetic modeling: principles and applications, J. Pharm. Sci., 1983, 72, 1103–1127 CrossRef CAS.
- H. W. Ding, Fang Images Guided Biodistribution and Pharmacokinetic Studies of Theranostics, Theranostics, 2012 DOI:10.7150/thno.4652.
- A. W. Opitz, E. Wickstrom, M. L. Thakur and N. J. Wagner, Physiologically based pharmacokinetics of molecular imaging nanoparticles for mRNA detection determined in tumor-bearing mice, Oligonucleotides, 2010, 20, 117–125 CrossRef CAS.
- T. Schluep, et al., Pharmacokinetics and tumor dynamics of the nanoparticle IT-101 from PET imaging and tumor histological measurements, Proc. Natl. Acad. Sci. U. S. A., 2009, 106, 11394–11399 CrossRef CAS.
- D. E. Owens Iii and N. A. Peppas, Opsonization, biodistribution, and pharmacokinetics of polymeric nanoparticles, Int. J. Pharm., 2006, 307, 93–102 CrossRef.
- H. S. Choi, et al., Renal clearance of quantum dots, Nat. Biotechnol., 2007, 25, 1165–1170 CrossRef CAS.
- Y. Matsumura and H. Maeda, A new concept for macromolecular therapeutics in cancer chemotherapy: mechanism of tumoritropic accumulation of proteins and the antitumor agent smancs, Cancer Res., 1986, 46, 6387–6392 CAS.
Footnote |
| † Electronic supplementary information (ESI) available. See DOI: 10.1039/c2ib20169k |
| This journal is © The Royal Society of Chemistry 2013 |