 Open Access Article
Creative Commons Attribution 3.0 Unported Licence
Feasibility and constraints of particle targeting using the antigen–antibody interaction†
Viola
Tokárová
a,
Anna
Pittermannová
a,
Vlastimil
Král
b,
Pavlína
Řezáčová
b and
František
Štěpánek
*a
aInstitute of Chemical Technology Prague, Department of Chemical Engineering, Technická 3, Prague 6, 166 28, Czech Republic. E-mail: frantisek.stepanek@vscht.cz; Tel: +420 220 443 236
bLaboratory of Structural Biology, Institute of Molecular Genetics, Academy of Sciences of the Czech Republic, v.v.i., Vídeňská 1083, Praha 4, 142 20, Czech Republic
First published on 7th October 2013
Abstract
This work is concerned with the surface modification of fluorescent silica nanoparticles by a monoclonal antibody (M75) and the specific bioadhesion of such particles to surfaces containing the PG domain of carbonic anhydrase IX (CA IX), which is a trans-membrane protein specifically expressed on the surfaces of several tumor cell lines. The adhesion strength of antibody-bearing silica nanoparticles to antigen-bearing surfaces was investigated under laminar flow conditions in a microfluidic cell and compared to the adhesion of unmodified silica nanoparticles and nanoparticles coupled with an unspecific antibody. Adhesion to cancer cells using flow cytometry was also investigated and in all cases the adhesion strength of M75-modified nanoparticles was significantly stronger than for the unmodified or unspecific nanoparticles, up to several orders of magnitude in some cases. The specific modification of nano- and microparticles by an antibody-like protein therefore appears to be a feasible approach for the targeting of tumor cells.
1 Introduction
Targeted drug delivery systems in the form of nano- or microparticles have attracted attention due to their fundamental interest and practical importance.1 The purpose of such delivery vehicles is to store a pharmacologically active compound at a high concentration, transport it through an environment in which the presence of the active compound is not required (or not desirable), and eventually anchor to the target site and release the encapsulated payload either spontaneously or upon an external stimulus.2,3 While encapsulation efficiency, stability and release kinetics of active compounds from colloidal delivery systems are widely studied,4,5 relatively less is known about the adhesion properties of such carrier particles towards real biological substrates under fluid flow conditions.6–9 The knowledge of the specific interaction of nanoparticles with the target point of release is essential if high specificity is to be achieved and side effects avoided, e.g. in cancer treatment.The so-called Enhanced Permeability and Retention effect (EPR effect)10 refers to a situation whereby colloidal particles can accumulate in a tumor due to their ability to permeate through porous walls of the developing vascularity in the tumor. Due to on-going angiogenesis (vascular network development) in a tumor, pores with characteristic dimensions in the range from 100 nm to several hundred nanometers exist in the capillary walls,10–14 which is not the case in healthy tissue. This means that convective transport does to some extent occur even in the interstitial space (i.e., outside the blood capillaries) and several studies have reported quantitative values of local shear rates in tumor tissue that typically range from 25 to 60 s−1 depending on the tumor type.12 For the design of colloidal particles for drug delivery to tumors, the adhesion to the target substrate under fluid flow conditions that result in similar shear rates is therefore of interest.
Several approaches are possible for measuring the adhesion strength between micro- or nano-particles and a substrate. One possibility is to measure the pull-out force directly using Atomic Force Microscopy (AFM).15–17 The advantage of this method is that it provides a direct value of the pull-out force; its disadvantage is that only individual particle adhesion is recorded, which may not be statistically representative. Another option is to use laminar fluid flow in order to exert a defined force (combination of hydrodynamic drag and lift force) on the particles.3,8,18,19 This has the advantage of allowing a statistically significant ensemble of particles to be measured simultaneously, and providing flexibility in the range of substrates and flow conditions (flow rate, temperature, fluid composition) used. Thus, the latter method has been used in the present work.
Carbonic anhydrase IX (CA IX) is a trans-membrane protein over-expressed in a wide variety of tumor types and induced by hypoxia.20 Tumor hypoxia is a situation where tumor cells have been depleted of oxygen by the process of their rapid growth. CA IX protein regulates intracellular pH during periods of hypoxia and thus plays a role in the regulation of cell proliferation, oncogenesis and tumor progression. The CA IX is a promising diagnostic and therapeutic target for a variety of cancers due to its almost exclusive expression in tumors and very limited expression in healthy tissues.21,22
This work describes the synthesis of mesoporous silica nanoparticles that can act as both diagnostic and therapeutic platforms and their surface modification with monoclonal antibody M75 (Fig. 1a). The antibody used in this work specifically binds to the PG domain of carbonic anhydrase IX, which is associated with several types of carcinomas (e.g. colorectal carcinoma, renal carcinoma, etc.). For the first set of experiments, chimeric protein PG-MBP (PG domain conjugated with Maltose Binding Protein) was used, because of simplicity of its expression and purification in comparison to the original protein CA IX. To simulate physiologically relevant conditions, adhesion studies under fluid flow conditions where a hydrodynamic drag force acts on the particles have been performed in a purpose-designed microfluidic flow-cell (Fig. 1b). The effect of flow rate and particle surface properties (unmodified silica, surface modified by an irrelevant antibody, and surface modified by the specific antibody) on the overall fraction of adhered particles has been investigated using both model and real substrates. As a model substrate, a flat monolayer of the PG-MBP domain has been formed; HT-29 and NIH 3T3 cells have been used as real substrates for the adhesion experiments.
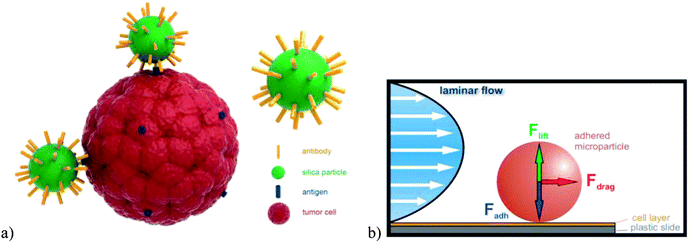 | ||
| Fig. 1 (a) Schematic illustration of SiO2 nanoparticles modified by a specific monoclonal antibody and their interactions with the trans-membrane antigen of a tumor cell. (b) Schematic of the principle of adhesion force measurement in a laminar flow field. | ||
2 Methods
2.1 Chemicals
The following chemicals were used: 3-(trimethoxysilyl)propyl methacrylate (MPS), tetraethyl orthosilicate (TEOS), and (3-aminopropyl)trimethoxysilane (APMS) were from Aldrich; albumin from bovine serum (BSA), IgG from human serum (IgG-X), (N-(3-dimethylaminopropyl)-N-ethylcarbodiimide) (EDC) and ammonium persulfate (APS) were from Sigma; fluorescein 5(6)-isothiocyanate (FITC) was purchased from Fluka and ethanol p.a. was from Lachner. Antibody protein M75, the proteoglycan-like domain of carbonic anhydrase IX (CA IX) – PG-MBP, the HT-29 cell line and phosphate buffer (PBS) were provided by the Laboratory of Structural Biology, IMG AS CR, v.v.i. Water was produced by a demineralized water generator Aqual 25.2.2 Cells and media
The following cell lines were used: HT-29 (colorectal adenocarcinoma; ATCC® HTB-38™) and NIH 3T3 (embryonic fibroblast, ATCC® CRL-1658™). The origin of the cells was described previously.23,24 The cells were grown in DMEM (D6429, Sigma-Aldrich) supplemented with 10% of heat inactivated FBS (10270-106, Invitrogen) and mix of antibiotics and antimycotis Anti–Anti (15240, Invitrogen) at 37 °C in a 5% CO2 atmosphere.2.3 Preparation of antibody modified SiO2 nanoparticles
Fluorescently labeled silica nanoparticles were synthesized according to the Stöber method.25 Briefly, 7.5 ml of ammonia (25% in water) was added to 100 ml of ethanol. The mixture was heated to 60 °C under continuous stirring with a magnetic stirrer in a two-neck round flask equipped with a reflux condenser. At 60 °C, the solution was equilibrated for 30 min and subsequently 3 ml of tetraethyl orthosilicate (TEOS) was added rapidly under stirring at approximately 200 rpm. Simultaneously, 3 ml of FITC solution (20 mg of FITC and 100 mg of AMPS in 10 g of ethanol) was added to the mixture.26 Within the first 10 min after the addition of TEOS, the colorless and clear solution became turbid, which indicates silica nucleation. At this stage the condensation reaction was allowed to proceed for 24 h at a constant temperature of 60 °C. The colloidal dispersion was then cooled down to room temperature and cleaned by repeated centrifugation (15 min at 12![[thin space (1/6-em)]](https://www.rsc.org/images/entities/char_2009.gif) 000 rpm) and washing. SiO2 nanoparticles were finally re-suspended in pure ethanol for further use and stored in a refrigerator.
000 rpm) and washing. SiO2 nanoparticles were finally re-suspended in pure ethanol for further use and stored in a refrigerator.
The size and shape of the SiO2 nanoparticles were characterized by transmission electron microscopy (Jeol JEM-1010) and their size distribution was evaluated by the dynamic light scattering method (Malvern Zetasizer Nano-ZS). The nanoparticles had a spherical shape and a narrow size distribution with a mean diameter of 42 nm (number-based mean from DLS measurement) and a polydispersity index (PDI) of 0.119 (Fig. 2b).
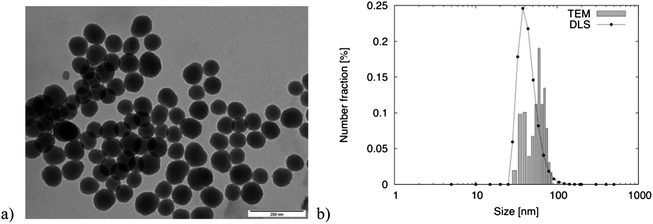 | ||
| Fig. 2 SiO2 nanoparticles: (a) TEM image (the scale bar represents 200 nm) and (b) size distribution obtained by DLS and TEM. | ||
Functionalization of the cleaned silica nanoparticles with 3-(trimethoxysilyl)propyl methacrylate (MPS) was carried out as reported by Karg et al.27 The desired amount of nanoparticles, dispersed in pure ethanol, was transferred into a two-neck round flask and MPS was added under continuous stirring. The amount of MPS was 23 mg per 1 g of SiO2 nanoparticles. After stirring for 12 h at room temperature, the dispersion was heated to its boiling point for 1 h to complete the surface reaction. Afterwards, the dispersion was cooled to room temperature and the SiO2 nanoparticles were dried in an oven at 65 °C for 6 h.
The covalent coupling of monoclonal antibody M75, irrelevant antibody IgG (IgG-X) and bovine serum albumin protein (BSA) was carried out as follows. The amount of 20 mg of functionalized SiO2 spheres was dispersed in 2 ml of activation buffer (commonly MES of pH 4.5–7.5). Then 20 mg of water soluble carbodiimide (EDC in our case) was added and the mixture was stirred for 15 min at room temperature. SiO2 nanoparticles were then washed (2×) and dispersed in 1 ml of coupling buffer (PBS). 1 ml of antibody M75 (1.4 mg ml−1) or unspecific antibody IgG-X in PBS or a 1% solution of BSA in PBS was added to the solution of SiO2 spheres and the mixture was stirred for 2 hours at room temperature. The antibody![[thin space (1/6-em)]](https://www.rsc.org/images/entities/char_2009.gif) :
:![[thin space (1/6-em)]](https://www.rsc.org/images/entities/char_2009.gif) SiO2 ratio was calculated so as to achieve a monolayer protein coverage on the silica particle surface based on the reported IgG capacity of 2.5 mg m−2. The antibody- or protein-modified SiO2 nanoparticles were washed, suspended in 2 ml of quenching solution (1% BSA) and mixed for 30 min. Finally, the nanoparticles were washed and suspended in a storage buffer (PBS) and kept at 4 °C for further use. Even after prolonged storage, the particles were easily redispersible in the storage buffer. In the following text, the four particle types will be called SiO2, SiO2-M75, SiO2-IgG-X and SiO2-BSA. The emission spectra of all four particle types have been measured by fluorescence spectrophotometry (excitation wavelength 493 nm) to verify that the emission spectra were not affected by the surface modification. In all four cases, the emission maximum was at 516 nm (see ESI 1†).
SiO2 ratio was calculated so as to achieve a monolayer protein coverage on the silica particle surface based on the reported IgG capacity of 2.5 mg m−2. The antibody- or protein-modified SiO2 nanoparticles were washed, suspended in 2 ml of quenching solution (1% BSA) and mixed for 30 min. Finally, the nanoparticles were washed and suspended in a storage buffer (PBS) and kept at 4 °C for further use. Even after prolonged storage, the particles were easily redispersible in the storage buffer. In the following text, the four particle types will be called SiO2, SiO2-M75, SiO2-IgG-X and SiO2-BSA. The emission spectra of all four particle types have been measured by fluorescence spectrophotometry (excitation wavelength 493 nm) to verify that the emission spectra were not affected by the surface modification. In all four cases, the emission maximum was at 516 nm (see ESI 1†).
2.4 ELISA-like test
The ELISA-like test was used to prove that the antigen binding site of monoclonal antibody IgG-M75 was not affected by conjugation with silica nanoparticles. Unlike indirect or sandwich ELISA tests, ELISA-like is more simplified. Since the monoclonal antibody IgG-M75 is covalently linked to the fluorescently labeled SiO2 nanoparticles, there is no need to use a secondary antibody for detection. A 100 μl of antigen domain (PG-MBP) solution with the concentration of 2.5 μg ml−1 and maltose binding protein (MBP) as a reference were added to each well of a microtiter plate (Medisorp, Nunc). The plate was stored overnight at 4 °C to ensure the proteins were adhered to the plastic through charge interactions. After washing in PBS (5 times), 200 μl of a 1% bovine serum albumin (BSA) solution in PBS was added to block any plastic surface in the well that remained uncoated by the antigen. The blocking time was 4 hours at 4 °C or 1 hour at room temperature. After washing in PBS (3 times), 100 μl of the particle solution was added into the well and left for 1 hour to allow the formation of particle–substrate bonds. After final washing in PBS the well was analyzed using a fluorescence spectrophotometer (Infinite M200, TECAN).2.5 Construction of a microfluidic adhesion cell
The adhesion strength of nanoparticles under fluid flow conditions was investigated using a microfluidic flow cell with controlled laminar flow (Fig. 1b). The adhesion cell consisted of three parts assembled together by a set of lock bolts (Fig. 3). The top and bottom parts were made from plexiglass and the middle part was made from rubber. The bottom part contained machine-milled spaces for microscopic plastic slides that were either modified by a protein layer so as to simulate the surface of a tumor cell (cf. Section 2.6 below) or were covered by the actual tumor cells (cf. Section 2.7 below). The upper part of the adhesion cell contained connectors for the inflow and outflow of the test fluid (water or PBS puffer at 20 °C). The fluid was fed to the flow cell by Tygon hoses connected to a syringe pump (Lambda laboratory instruments, VIT-FIT syringe pump) (Fig. 3b). The thickness of the rubber spacer that formed the middle part of the flow cell determined the flow velocity for a given volumetric flow rate. | ||
| Fig. 3 (a) Divided adhesion cell (upper part with inflow and outflow hoses, bottom part with milled space for plastic slides and rubber spacer) and (b) assembled adhesion cell connected to a syringe pump. | ||
2.6 Modification of plastic slides with PG-MBP (antigen domain carrying chimeric protein)
To simulate the tumor cell surface with a theoretical 100% coverage by the CA IX antigen domain, the PG-MBP, where the PG domain is specifically bound by IgG-M75, was linked to plastic slides (Thermanox® Coverslips by Thermo scientific, unmodified side) subsequently used in the adhesion flow cell. The method was the same as for the ELISA-like experiments. The amount of 50 μl of antigen solution (2.5 μg ml−1) was placed on the slide and left overnight in a wet chamber at 4 °C. The slides were then washed with a PBS solution. To eliminate any unspecific reaction or adsorption, 100 μl of blocking buffer (1% BSA in PBS) was placed on the slide and kept for 4 hours at 4 °C in the wet chamber. Finally, the slides were washed with PBS and kept in the wet chamber for further use.2.7 Modification of plastic slides with HT-29 cells
The cell line HT-29, derived from a human colorectal adenocarcinoma, was used for adhesion studies because HT-29 cells express a high amount of CA IX on the surface. HT-29 cells were grown under standard conditions (DMEM medium (Gibco) supplemented by 10% of fetal bovine serum (Gibco) at 37 °C in a 5% CO2 atmosphere). For the studies in the flow cell they were grown in standard six well plates for tissue culture (Corning) with plastic slides (Thermanox® Coverslips) in each well. Cells were seeded in density 0.2–0.5 × 10⁶ cells per well in 2 ml of growth media and they were cultured for 2 days prior to the studies in the flow cell.2.8 Adhesion experimental set-up and evaluation
The plastic slides containing either the protein layer or the tumor cells were placed inside the microfluidic flow cell and the amount of 50 μl of fluorescently labeled SiO2 nanoparticle suspension was deposited on the plastic slide and left still for a specified period of time to allow the formation of particle–substrate bonds (cf. Section 3.2). The flow cell was closed, connected to a syringe pump (Fig. 4b) and a volume of 10 ml was flown through the cell at a set flow rate that ranged from 1.0 to 20.0 ml min−1 in order to gradually increase the hydrodynamic force that acted on the particles. The flow cell was then disassembled, the plastic slides with adhered SiO2 nanoparticles were removed and the surface density of adhered particles was evaluated by image analysis from fluorescence microscopy images of the slides. The variable parameters during the adhesion experiments were: particle type (unmodified SiO2, SiO2-M75, SiO2-IgG-X and SiO2-BSA modified particles), fluid flow rate in the adhesion cell (corresponding to the mean velocity of 1.0 to 19.6 mm s−1) and the substrate (PG-MBP antigen domain covered slide or HT-29 cells).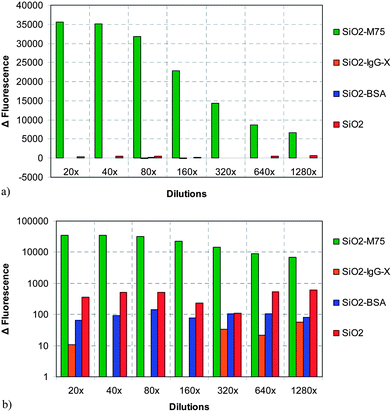 | ||
| Fig. 4 Fluorescence response of the ELISA-like test for 4 types of particles: (a) linear scale and (b) logarithmic scale. | ||
A confocal fluorescence microscope Olympus Fluoview FV-1000 was used for the image acquisition (excitation at 495 nm, emission at 519 nm). From each plastic microscope slide with deposited silica particles, 10 images (field of view 640 μm × 640 μm) from different locations were acquired. Following the thresholding of the images (software ImageJ), the area fraction of each image occupied by the particles was evaluated and an average value from the 10 acquired images was calculated. Since the volumetric concentration of the SiO2 nanoparticle suspensions that were used for the adhesion experiments was not constant (each SiO2 modification step resulted in somewhat different final dilutions of the particle suspension), the actual concentration of the nanoparticles was determined by fluorescence spectroscopy in each case (Agilent Cary Eclipse).
3 Results
3.1 ELISA-like tests
Specific adhesion of antibody modified silica nanospheres (SiO2-M75) with chimeric protein PG-MBP was proved by the ELISA-like test. The fluorescence responses of 4 types of particles were compared. The original particle solutions were diluted in a geometric sequence. The difference between specific (SiO2-M75) and unspecific (SiO2-IgG-X) interactions and BSA-modified particles (SiO2-BSA) or unmodified (SiO2) silica spheres is considerable for all dilutions as shown in Fig. 4.The test was repeated in a time sequence and no antibody deactivation was observed. The results from the ELISA-like tests performed after 1 and 7 months have still shown a very strong interaction of the specific antibody M75 molecule with the antigen in comparison to an irrelevant antibody and unmodified SiO2 nanoparticles for all studied dilutions (Fig. 5).
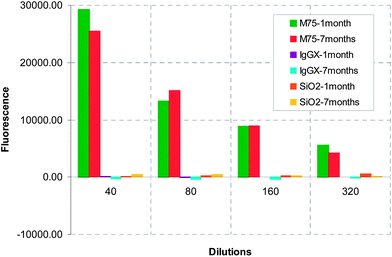 | ||
| Fig. 5 Effect of aging on particle adhesion in an ELISA-like test repeated after 1 and 7 months. | ||
3.2 Microscopic detection
For adhesion experiments in the flow cell, it was necessary to find the time period required for the M75-modified particles to form a bond with the antigen domain. SiO2-M75 particles were placed on slides modified with PG-MBP and washed in PBS after 1, 5, 10, 20 and 40 minutes. The slides were then imaged by fluorescence microscopy and evaluated by image analysis (Fig. 6). Fig. 7 shows the percentage of area occupied by SiO2-M75 particles on the modified slide. From the fluorescence microscopy images it is evident that after 20 min of interaction, the surface coverage no longer increases and the particles tend to agglomerate and form clusters. For further experiments we have therefore used a contact time of 20 minutes, which is considered a sufficient binding period for the specific antigen–antibody interaction. | ||
| Fig. 6 Fluorescence microscopy images of SiO2-M75 particles deposited on a PG-MBP modified slide after increasing the exposure time (the scale bar represents 100 μm). | ||
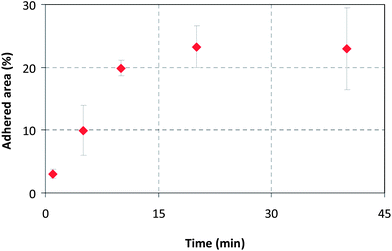 | ||
| Fig. 7 Time dependence of surface coverage by SiO2-M75 particles evaluated from the fluorescence microscopy images shown in Fig. 6. | ||
A detailed view of an interface between a region of the slide modified by the PG-MBP antigen domain and the surrounding area blocked by BSA is shown in Fig. 8. This can be considered as a further proof of the specific antigen–antibody interaction, since the surface density of adhered SiO2-M75 particles is clearly significantly higher in the region containing the antigen.
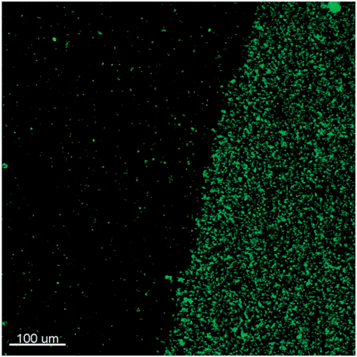 | ||
| Fig. 8 Fluorescence microscopy image of an interface between an area containing the PG-MBP antigen domain with deposited SiO2-M75 particles and the surrounding blocked area (the scale bar represents 100 μm). | ||
Adhesion experiments under flow conditions were then carried out with all four types of particles – unmodified SiO2 and modified SiO2 nanoparticles with specific monoclonal antibody IgG-M75, unspecific antibody IgG-X and protein BSA. The hydrodynamic drag and lift forces acting on the particles inside the flow cell increase proportionally to the flow rate, and individual particles remain attached to the substrate or are removed by the flowing fluid depending on the balance between the hydrodynamic forces and the adhesion force. From the known volumetric flow rate and cross-sectional area of the flow cell, the mean fluid velocity inside the cell was in the range of 1.0–19.6 mm s−1 which represents the wall shear rate in the range from 6.1 to 117.6 s−1. Assuming a mean fluid velocity of 19.6 mm s−1 the value of drag force calculated from the Stokes formula is 16.7 pN and the lift (Saffman) force acting on the particle in the normal direction is 31.3 × 10⁻³ pN. According to the literature, the adhesion force of the particle–cell interaction measured mostly by the AFM method varies in the range of several pN to nN. The adhesion force increases with increasing particle radius.28–30 For particles of around 300 nm the value of the reported force is in the range of 30–160 pN (ref. 28) which is in agreement with our measurement for particles with more than 6 times smaller diameter. The value of shear rate typically used to study the adhesion character of drug delivery systems inside microfluidic devices varies in the range of 15–250 s−1 according to the values of real circulation in the human body (50–100 s−1).9,12,18,31–34 The shear rates prevailing in tumor vasculature are typically in the range of 25–60 s−1 (ref. 12) due to lower volumetric flow rates present in tumors.
Fig. 9 shows examples of fluorescence microscopy images of adhered particles of each of the four types at increasing flow rates. An increase of fluid velocity caused a decrease of the fraction of adhered particles in all four cases. However, the extent of the decrease was different depending on the particle type. A similar trend was observed for different drug delivery systems where flow measurements were introduced.18,33 The percentage area of adhered particles as a function of flow rate, evaluated by image analysis from the fluorescence images, is summarized in Fig. 10. It can be clearly seen that the extent of adhesion for SiO2-M75 particles – due to the specific antigen–antibody interaction – was significantly higher than in the case of particles modified by the non-specific antibody or particles simply blocked by BSA. This observation is consistent with the ELISA-like tests and it is significant, since it proves that the specific particle–substrate adhesion, which works in a stagnant fluid (ELISA), also manifests itself under fluid flow conditions (flow cell). In order to overcome the force of the antigen–antibody bonds and to start removing the SiO2-M75 particles from the substrate, relatively high shear rates have to be reached as shown in Fig. 10b.
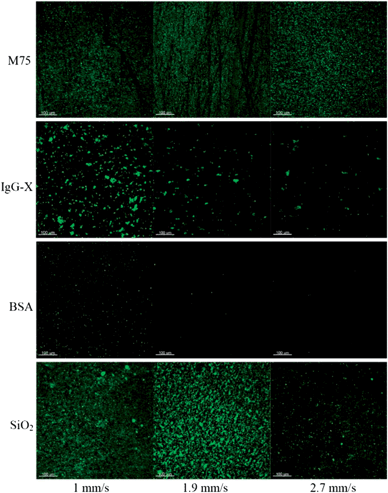 | ||
| Fig. 9 Fluorescence microscopy images of adhesion at three different fluid velocities for four particle types: (a) SiO2-M75; (b) SiO2-IgG-X; (c) SiO2-BSA; and (d) SiO2 (the scale bar represents 100 μm). | ||
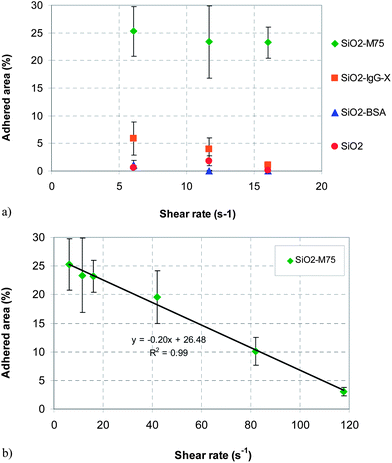 | ||
| Fig. 10 (a) Influence of shear rate inside the flow cell on the surface coverage for all four types of particles. (b) Effect of increasing shear rate on the removal of the M75 modified particles. | ||
It is interesting to point out that similar to the ELISA-like test, unmodified SiO2 particles show a somewhat stronger adhesion than either SiO2-BSA or SiO2-IgG-X. Since the concentration of the unmodified SiO2 nanoparticles in the solution that was initially deposited on the PG-MBP coated slide was higher than in the other three cases, the area occupied by the particles at the initial flow rate was re-scaled, using the concentration ratio as a basis (i.e., multiplying the fractional area evaluated by image analysis by a factor fi = cM75/ci where ci is the concentration of particles in the solution measured by fluorescence spectrophotometry and i = SiO2, BSA, IgG-X and M75).
3.3 Adhesion on HT-29 cells
The adhesion experiments in the microfluidic device were repeated using live HT-29 cancer cell layers grown on the microscope slides (cf. Section 2.7) instead of the antigen-coated slides. The cell-coated substrate differs in two important aspects – first, it is no longer flat (due to irregularities in the cell coverage and the individual cell shape) and secondly, the surface density of the PG domain is no longer 100% but some a priori unknown value that depends on how the cells express the CA IX protein. A comparison of adhesion of the four particle types on HT-29 cells at a fixed flow rate of 1.0 ml s−1 is shown in ESI 2.† Initially, there does not seem to be any systematic difference in the fraction of adhered particles, or one might even assume that the unmodified SiO2 particles adhered the most. However, after closer inspection it can be seen that the particles tend to accumulate in the grooves at cell–cell interfaces, meaning that steric factors rather than the particle–cell interaction probably dominate the force balance in this case.3.4 Flow cytometry on HT-29 and NIH 3T3 cells
As the adhesion on the HT-29 cell line inside the microfluidic cell led to inconclusive results, flow cytometry was used as an alternative quantitative method to investigate the particle adhesion to live cells. Besides testing the HT-29 cell line, the flow cytometry was applied also to the NIH 3T3 cells as a negative control with no CA IX expressed on their surface. Therefore, no specific interaction was expected in that case. Flow cytometry was performed using a BD LSRFortessa cell analyzer (BD Biosciences). The fluorescence of 10![[thin space (1/6-em)]](https://www.rsc.org/images/entities/char_2009.gif) 000 events was measured, using the excitation wavelength of laser 488 nm. Emission was read using a detector with a set of two dichroic mirrors 530/30 and 505LP. For the flow cytometry experiments, the amount of 20 μl (4 × 10⁵) HT-29 or NIH 3T3 cells was incubated for 20 minutes on ice in a dark environment in each Greiner well of a microtiter plate with 20 μl of studied nanoparticles (SiO2, SiO2-BSA, SiO2-IgG-X and SiO2-M75) at different dilutions. Then the amount of 200 μl of 1% BSA in PBS was added to each well and centrifuged (300g/4 °C/5 min). This washing step was repeated 3 times. Finally, cells with adhered nanoparticles were dispersed in 500 μl of 1% BSA solution in PBS and analyzed. The raw data were evaluated by software FlowJo 7.6.1 (Tree Star, Inc.).
000 events was measured, using the excitation wavelength of laser 488 nm. Emission was read using a detector with a set of two dichroic mirrors 530/30 and 505LP. For the flow cytometry experiments, the amount of 20 μl (4 × 10⁵) HT-29 or NIH 3T3 cells was incubated for 20 minutes on ice in a dark environment in each Greiner well of a microtiter plate with 20 μl of studied nanoparticles (SiO2, SiO2-BSA, SiO2-IgG-X and SiO2-M75) at different dilutions. Then the amount of 200 μl of 1% BSA in PBS was added to each well and centrifuged (300g/4 °C/5 min). This washing step was repeated 3 times. Finally, cells with adhered nanoparticles were dispersed in 500 μl of 1% BSA solution in PBS and analyzed. The raw data were evaluated by software FlowJo 7.6.1 (Tree Star, Inc.).
The results from flow cytometry are summarized in Fig. 11 and 12. As can be seen, only M75 modified silica particles bind specifically to the HT-29 cells, since the mean fluorescence intensity of all other particle types is essentially identical to the reference (HT-29 cells without any added SiO2 particles). Moreover, the mean fluorescence intensity of the M75 modified nanoparticles appears to increase monotonously with increasing nanoparticle concentration (Fig. 11b), indicating that the surface “capacity” of the HT-29 cells for the antibody-bearing SiO2 nanoparticles has not yet been reached. Even at a dilution of more than 1000× compared to the base case, the M75 modified nanoparticles still reveal a statistically significant increase of the fluorescence signal in the flow cytometry results compared to the other three particle types. This can be considered as a proof that the use of antibody-modified nanoparticles for specifically targeting tumor cells is feasible not only in a stagnant fluid, but also under fluid flow conditions.
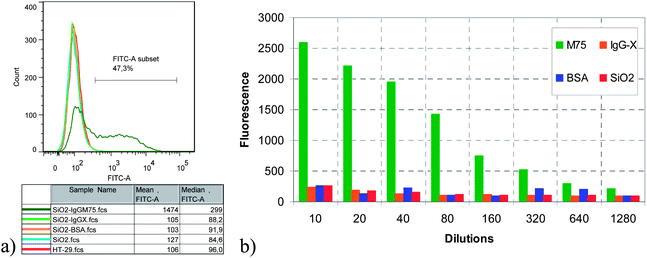 | ||
| Fig. 11 Comparison of flow cytometry results (fluorescence intensity distribution) for the adhesion of all four particle types to HT-29 cells. (a) Fluorescence intensity distribution at 80× dilution. (b) Comparison of the mean fluorescence intensity at several dilutions. | ||
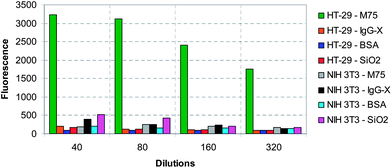 | ||
| Fig. 12 Summary of the flow cytometry results on HT-29 and NIH 3T3 cells (mean fluorescence intensity) for all four particle types as a function of dilution. | ||
In order to verify that the adhesion of M75 modified nanoparticles is indeed specific to cells expressing CA IX, a further negative control has been carried out using the NIH 3T3 cell line. A direct comparison between both cell lines and all four particle types carried out under identical settings of the flow cytometer at identical dilutions is shown in Fig. 12. As the results reveal, adhesion to the non-specific cell line is approximately one order of magnitude lower than for the specific M75-CA IX mediated adhesion, and comparable to adhesion of unmodified particles.
4 Conclusion
Fluorescently labeled silica nanoparticles were prepared and characterized. Covalent coupling of monoclonal antibody fragment M75, polyclonal antibody IgG-X and bovine serum albumin on the surface of the silica nanoparticles was performed and proven by the ELISA-like test with the PG domain of carbonic anhydrase IX (CA IX) as the antigen in fusion with MBP. The adhesion strength between the nanoparticles and the substrate was then investigated in a laminar flow cell. Significantly a stronger interaction between the specific (M75) antibody modified nanoparticles was observed compared to those modified by a non-specific antibody, BSA or unmodified particles. While adhesion tests carried out on HT-29 cells deposited on a flat solid support proved inconclusive probably due to surface irregularities, adhesion to the cells measured by flow cytometry has revealed an excellent specificity of the interaction between M75-modified silica nanoparticles and the cells. The use of such nanoparticles for further diagnostic and possibly also therapeutic applications would thus appear feasible.Acknowledgements
This work has been supported by the European Research Council (200580-Chobotix), by the Specific University Research (MSMT 20/2013), by the Grant Agency of the Czech Republic (GA ČR 13-37055S) and by the Institute of Molecular genetics, AS CR, v.v.i (RVO: 68378050).References
- J. Čejková and F. Stěpánek, Curr. Pharm. Des., 2013, 19, 6298–6314 CrossRef.
- A. Zadrazil, V. Tokarova and F. Stepanek, Soft Matter, 2012, 8, 1811–1816 RSC.
- V. Tokarova, A. Pittermannova, J. Cech, P. Ulbrich and F. Stepanek, Soft Matter, 2012, 8, 1087–1095 RSC.
- V. Tokárová, O. Kašpar, Z. Knejzlík, P. Ulbrich and F. Štěpánek, Powder Technol., 2013, 235, 797–805 CrossRef PubMed.
- P. Haufova, J. Dohnal, J. Hanus and F. Stepanek, Colloids Surf., A, 2012, 410, 52–58 CrossRef CAS PubMed.
- J. K. Vasir, K. Tambwekar and S. Garg, Int. J. Pharm., 2003, 255, 13–32 CrossRef CAS.
- G. Guillemot, S. Lorthois, P. Schmitz and M. Mercier-Bonin, Chem. Eng. Res. Des., 2007, 85, 800–807 CrossRef CAS.
- B. Prabhakarpandian, M. C. Shen, K. Pant and M. F. Kiani, Microvasc. Res., 2011, 82, 210–220 CrossRef PubMed.
- N. Doshi, B. Prabhakarpandian, A. Rea-Ramsey, K. Pant, S. Sundaram and S. Mitragotri, J. Controlled Release, 2010, 146, 196–200 CrossRef CAS PubMed.
- R. K. Jain and T. Stylianopoulos, Nat. Rev. Clin. Oncol., 2010, 7, 653–664 CrossRef CAS PubMed.
- H. Maeda, Adv. Enzyme Regul., 2001, 41, 189–207 CrossRef CAS.
- N. Funakoshi, M. Onizuka, K. Yanagi, N. Ohshima, M. Tomoyasu, Y. Sato, T. Yamamoto, S. Ishikawa and T. Mitsui, Microvasc. Res., 2000, 59, 361–367 CrossRef CAS PubMed.
- N. Hansen-Algenstaedt, C. Joscheck, C. Schaefer, K. Lamszus, L. Wolfram, T. Biermann, P. Algenstaedt, M. A. Brockmann, C. Heintz, W. Fiedler and W. Ruther, Eur. J. Cancer, 2005, 41, 1073–1085 CrossRef PubMed.
- F. Yuan, M. Dellian, D. Fukumura, M. Leunig, D. A. Berk, V. P. Torchilin and R. K. Jain, Cancer Res., 1995, 55, 3752–3756 CAS.
- M. Tanaka, M. Komagata, M. Tsukada and H. Kamiya, Powder Technol., 2008, 183, 273–281 CrossRef CAS PubMed.
- M. L. Ott and H. A. Mizes, Colloids Surf., A, 1994, 87, 245–256 CrossRef CAS.
- H. A. Zhang, W. Q. Ding, K. Y. Law and C. Cetinkaya, Powder Technol., 2011, 208, 582–589 CrossRef CAS PubMed.
- J. E. Blackwell, N. M. Dagia, J. B. Dickerson, E. L. Berg and D. J. Goetz, Ann. Biomed. Eng., 2001, 29, 523–533 CrossRef CAS.
- O. Abbassi, T. K. Kishimoto, L. V. Mcintire, D. C. Anderson and C. W. Smith, J. Clin. Invest., 1993, 92, 2719–2730 CrossRef CAS PubMed.
- V. Kral, P. Mader, R. Collard, M. Fabry, M. Horejsi, P. Rezacova, M. Kozisek, J. Zavada, J. Sedlacek, L. Rulisek and J. Brynda, Proteins, 2008, 71, 1275–1287 CrossRef CAS PubMed.
- R. G. Gieling and K. J. Williams, Bioorg. Med. Chem., 2013, 21, 1470–1476 CrossRef CAS PubMed.
- A. J. Kivela, A. Knuuttila, J. Rasanen, E. Sihvo, K. Salmenkivi, J. Saarnio, S. Pastorekova, J. Pastorek, A. Waheed, W. S. Sly, J. A. Salo and S. Parkkila, Bioorg. Med. Chem., 2013, 21, 1483–1488 CrossRef CAS PubMed.
- J. Zavada, Z. Zavadova, O. Machon, L. Kutinova, R. Opavsky and J. Pastorek, Int. J. Oncol., 1997, 10, 857–863 CAS.
- J. Zavada, Z. Zavadova, J. Pastorek, Z. Biesova, J. Jezek and J. Velek, Br. J. Cancer, 2000, 82, 1808–1813 CrossRef CAS PubMed.
- W. Stöber, A. Fink and E. Bohn, J. Colloid Interface Sci., 1968, 26, 62–69 CrossRef.
- J. Cejkova, J. Hanus and F. Stepanek, J. Colloid Interface Sci., 2010, 346, 352–360 CrossRef CAS PubMed.
- M. Karg, I. Pastoriza-Santos, L. M. Liz-Marzan and T. Hellweg, ChemPhysChem, 2006, 7, 2298–2301 CrossRef CAS PubMed.
- J. K. Vasir and V. Labhasetwar, Biomaterials, 2008, 29, 4244–4252 CrossRef CAS PubMed.
- N. Pyo, S. Tanaka, C. E. McNamee, Y. Kanda, Y. Fukumori, H. Ichikawa and K. Higashitani, Colloids Surf., B, 2006, 53, 278–287 CrossRef CAS PubMed.
- H. Shinto, Y. Aso, T. Fukasawa and K. Higashitani, Colloids Surf., B, 2012, 91, 114–121 CrossRef CAS PubMed.
- R. K. Jain, Cancer Res., 1988, 48, 2641–2658 CAS.
- S. T. Kang, A. Subramani, E. M. V. Hoek, M. A. Deshusses and M. R. Matsumoto, J. Membr. Sci., 2004, 244, 151–165 CrossRef CAS PubMed.
- M. F. Kiani, H. Yuan, X. Chen, L. Smith, M. W. Gaber and D. J. Goetz, Pharm. Res., 2002, 19, 1317–1322 CrossRef CAS.
- S. Liang, M. J. Slattery and C. Dong, Exp. Cell Res., 2005, 310, 282–292 CrossRef CAS PubMed.
Footnote |
| † Electronic supplementary information (ESI) available. See DOI: 10.1039/c3nr04340a |
| This journal is © The Royal Society of Chemistry 2013 |
