Cellular uptake and gene delivery using layered double hydroxide nanoparticles†
Shuangde
Li
ac,
Jinghuan
Li
b,
Chengle J.
Wang
c,
Qiang
Wang
c,
M. Zameel
Cader
b,
Jun
Lu
*a,
David G.
Evans
a,
Xue
Duan
a and
Dermot
O'Hare
*c
aState Key Laboratory of Chemical Resource Engineering, Beijing University of Chemical Technology, Beijing, 100029, P. R. China. E-mail: lujun@mail.buct.edu.cn; Fax: +86-10-64425385; Tel: +86-10-64412131
bDepartment of Physiology, Anatomy and Genetics, University of Oxford, South Parks Road, Oxford OX1 3QX, UK
cChemistry Research Laboratory, Department of Chemistry, University of Oxford, Mansfield Road, Oxford OX1 3TA, UK. E-mail: dermot.ohare@chem.ox.ac.uk; Tel: +44 (0)1865 272686
First published on 16th October 2012
Abstract
The cellular uptake of narrowly dispersed LDH {[Mg3Al(OH)8](CO3)0.5} nanoparticles into the Mouse Motor Neuron (NSC 34) cell line has been studied. The effect of LDH concentration and incubation time on the cellular uptake was investigated using fluorescein isothiocyanate (FITC) labelled LDH nanoparticles. We observed that cellular uptake increases with the increased LDHs concentration and incubation time. Confocal laser microscopy and transmission electron microscopy reveal that 20 nm LDHs nanoparticles intrude into the cytoplasm and then enrich in the cellular nucleus, while nanoparticles greater than 20 nm only locate in the cytoplasm. The 20 nm sized LDHs nanoparticles display similar uptake to both the cytoplasm and nucleus, and show little cytotoxicity with no significant decrease in NSC 34 cell proliferation and viability below 200 μg ml−1. DNA modified 20 nm LDH nanoparticles are successful in transfection of the pEGFP-N1 DNA plasmid to NSC 34 cells.
Introduction
Layered double hydroxides (LDHs) are a large family of layered inorganic materials, one class may be represented by the general composition [MII1−xMIIIx(OH)2](An−)x/n·mH2O (where MII and MIII are divalent and trivalent metals, respectively, and An− is the interlayer anion). LDHs structures are built by the periodical stacking of brucite-like positively charged layers due to the partial substitution of M3+ for M2+ and anionic species in the interlayers.1 Owing to the highly tunable LDH layer composition and the wide choice of anionic species, broad applications of LDHs hybrid materials have been reported, such as catalysis,2 photochemistry,3 and protein separation.4 In recent years, [Mg1−xAlx(OH)2](An−)x/n·mH2O (MgyAl-LDH; y = (1 − x)/x) nanoparticles which are biodegraded in the cellular cytoplasm (pH = 4–6), have found promising applications for the storage and delivery of biological molecules5–7 and for the cellular gene delivery as an effective non-viral agent.8,9 Xu et al. have carried biological tracking studies using four dye-labelled (fluorescein, fluorescein isothiocyanate, sulfonic acid derivatised pyrene and naphthalene) LDHs using confocal microscopy.5b Compared to the other inorganic nanoparticles, such as silica,10a quantum dots,10b carbon nanotubes,11a gold nanoparticles,11b LDHs nanoparticles possess a number of advantageous properties, such as the good biocompatibility, low cytotoxicity, high loading of anionic/polar drugs, pH-controlled release of guest molecules, and protection of drugs within the layer galleries.LDHs possess a large ion exchange capacity for negatively charged drugs or DNA molecules and so has the potential for efficient intracellular delivery of membrane-impermeable compounds.12 Choy et al. found that the encapsulation of anticancer drugs within the layers of LDH nanoparticles can improve the cellular uptake through clathrin-mediated endocytosis, which consequently suppresses the proliferation of cancer cells.13a The intercalation of anticancer drug methotrexate into LDHs has been found to overcome drug resistance in cancer cells.13b Xu et al. found that low molecular weight heparin (LMWH) incorporated in LDHs has ten times greater cellular uptake than that of LMWH alone and it exhibits significantly enhanced ability to inhibit vascular smooth muscle cell proliferation.14a,b Xu also proved that core–shell nanocomposites composed of a mesoporous silica shell surrounding an LDH core possesses an adjustable slow release property.14c
The use of LDHs nanoparticles as gene delivery vectors can not only enhance the thermal stability of DNA but also improve its cellular uptake efficiency.7b,12 Li et al. have demonstrated that LDHs can regulate DNA vaccine delivery which can enhance the anti-melanoma immune response.9 Xu et al. observed that LDH morphology influenced the targeting of different subcellular compartments in living cells.15 Hexagonal LDH nanoparticles ca. 100 nm mainly localise in the perinuclear area of the cytoplasm, while their rod-like counterparts are concentrated in the nucleus, which offers the possibility of targeted delivery. Hexagonal LDHs nanoparticles can efficiently deliver siRNA molecules to the perinuclear cytoplasm of mammalian cells dependent upon the nucleotide sequence, where siRNA-initiated mRNA degradation takes place.16
Positively charged LDHs in common with other nonviral cellular delivery vectors such as mesoporous silica,18 and polymers,19 can easily enter the cell cytoplasm because the cell membranes are negatively charged but they cannot normally penetrate the nucleus due to the impermeable nature of the nuclear membrane17 and the small size of nucleus pore. When nanoparticles are used as delivery vectors they are required to finally target the cell nucleus, where the genetic information is stored and the cell's function is regulated through the expression of genes.10b The diagnosis and treatment of disease such as targeted therapy and gene therapy could be greatly enhanced by the delivery of drugs into the nucleus.11b
Thus, substantial efforts have been undertaken in order to try and develop methods to enable the uptake of nanoparticles into the nucleus. A common approach is to modify the surface of nanoparticles and several targeted delivery strategies have been developed. Kuo et al. demonstrated that core–shell quantum dots (CdSe–ZnS) capping with various nucleus localisation signaling (NLS) peptides can get into the nucleus of CHO, NIH3T3, CV-1, and Hep G2 cells.10b Kuo also found that some very small quantum dots without NLS coating could enter the nucleus, suggesting that the size may play an important role.10b Gold nanoparticles bioconjugated with nucleus targeting peptides facilitate the nucleus transportation which can selectively disturb the division of cancer cells.11b However, these studies have shown that for efficient nucleus delivery, nanoparticles must be decorated by proteins or peptides with protein transduction domains. The other impediment is that the quantum dots or gold nanoparticles are not biodegraded in comparison with LDHs.
Previous studies have focused on the uptake of DNA or drug delivery into the cellular cytoplasm using LDH nanoparticles, and the cytotoxicity effects of >100 nm hexagonal LDHs particles. However, little is known about the effects of 20 nm LDHs nanoparticles on cells. This paper reports the synthesis of ca. 20 nm fluorescein isothiocyanate isomer I labelled Mg3AlCO3LDH nanoparticles, a comprehensive study of their cellular uptake (the cytoplasm and nucleus), a cytotoxicity study, and a preliminary study of their potential for gene delivery.
Experimental section
All chemicals were purchased from Sigma-Aldrich (UK).Synthesis
[Mg 3 Al(OH) 8 ](CO 3 ) 0.5 (CO 3 LDH) was prepared according to the literature with some modifications:20 a 50 ml solution containing 75 mmol l−1 Mg(NO3)2·6H2O, 25 mmol l−1 Al(NO3)3·9H2O and a 1.0 M NaOH solution were simultaneously added drop-wise to a basic Na2CO3 solution (50 ml, 25 mmol), the pH of the mixed solution was kept constant at 12.5. The resulting mixture was aged at room temperature for 24 h with continuous stirring.[Mg 3 Al(OH) 8 ]NO 3 (NO 3 LDH) was prepared by aqueous co-precipitation by mixing 100 ml salt solution containing 0.45 M Mg(NO3)2·6H2O and 0.15 M Al(NO3)3·9H2O with 22.5 ml of 4 M NaOH under nitrogen, followed by hydrothermal aging at 130 °C for 24 h.
[Mg 3 Al(OH) 8 ](CO 3 ) 0.5 -FITC (CO3LDH-FTIC) FITC absorbed on the Mg3AlCO3LDH surface was prepared by adding equal volumes of a 3 mg ml−1 Mg3AlCO3LDH slurry with a fluorescein isothiocyanate isomer I (FITC) aqueous solution (pH = 10.0, 3 mg ml−1), followed by stirring for 12 h at room temperature.
Mg 3 Al(OH) 8 (NO 3 ) 0.2 (FITC) 0.4 (NO 3 LDH-FITC) FITC intercalated NO3LDH was prepared by taking 0.3 g NO3LDH slurry (ca. 0.2 mmol) dispersed in 10 ml water and adding it to a fluorescein isothiocyanate isomer I (FITC) solution (0.2 mmol, 20 ml, pH = 10.1), followed by stirring at 60 °C for 24 h.
All the reactions mixtures were initially centrifuged and washed thoroughly with deionized water, followed by drying at 80 °C.
Cell uptake studies
Mouse Motor Neuron (NSC 34) cells purchased from ATCC (American Type Culture Collection) were grown in DMEM medium (Invitrogen Gibco) supplemented with 10% heat inactivated fetal bovine serum, 100 units ml−1 penicillin, and 100 mg ml−1 streptomycin in a humidified atmosphere (5% CO2 plus 95% air) at 37 °C. 2 × 10⁵ cells per well were incubated in 24 well plates for 24 h with 500 μl DMEM. The effect of different concentrations on the cellular uptake was investigated by replacing with fresh 500 μl DMEM containing various concentrations of the CO3LDH-FTIC suspension (6.25 to 100 μg ml−1) and incubated for further 3 h. The CO3LDH-FTIC suspension (25 and 75 μg ml−1) was added to the cell and incubated for 1, 2, 4, 6 and 7 h to detect the effect of incubation time to cellular uptake. After incubation, extracellular CO3LDH-FTIC was removed by washing the cells gently with PBS buffer 3 times, after which cells were lysed in PBS containing 1% Triton X-100, then incubated further for 15 minutes at room temperature. The plate was centrifuged to remove cell debris and then transferred 200 μl supernatant to 96 well plates to measure fluorescent at λEx = 485 nm and λEm = 520 nm with DMG FLUOStar OPTIMA machine.Control experiments
Suspensions of CO3LDH-FTIC nanoparticles at various concentrations (6.25 to 100 μg ml−1 in DMEM) were kept in an orbital shaker at constant gentle shaking at 37 °C for 3 h, then the suspensions were centrifuged at 12![[thin space (1/6-em)]](https://www.rsc.org/images/entities/char_2009.gif) 000 rpm for 8 min to collect the supernatant. Suspensions of 25 and 75 μg ml−1 CO3LDH-FTIC nanoparticles were centrifuged at pre-determined time intervals (1, 2, 4, 6 and 7 h) to collect the supernatants. Control experiments were performed with the above supernatant under identical conditions.
000 rpm for 8 min to collect the supernatant. Suspensions of 25 and 75 μg ml−1 CO3LDH-FTIC nanoparticles were centrifuged at pre-determined time intervals (1, 2, 4, 6 and 7 h) to collect the supernatants. Control experiments were performed with the above supernatant under identical conditions.
Confocal microscopy
5 × 10⁴ NSC 34 cells per well were pre-grown on round coverslips in 12 well plates for 30 h. The medium was then replaced by fresh CO3LDH-FITC suspensions with 6.25 and 10 μg ml−1 in 500 μl DMEM and incubated for 2.5 and 3 h, separately. Control experiments were performed with the centrifugal supernatant of 17 μg ml−1 CO3LDH-FITC DMEM suspension and only FITC (pH = 9.8, 6.25 μg ml−1) under the same conditions. The coverslips were washed gently with PBS 3 times before fixed with 3.7% formaldehyde in PBS for 15 min, and 0.1% Triton X-100 in PBS for 10 min, then dyed by DAPI (Vector, IVD H-1200) for 15 min. After that the sample was observed with a confocal microscope (LSM 510, ZEISS) using a 60× oil-immersion objective and a standard FITC filter set.Cellular fractionation
NSC 34 cells were fractioned into nucleus and cytoplasm fractions using the Lamond Lab protocols 2007 with some modification.21 In brief, 2 × 10⁵ NSC 34 cells per well in 24 well plates were exposed to CO3LDH-FTIC suspension with different concentration for 3 h before extracellular CO3LDH-FTIC was washed away with PBS twice. First, 200 μl of ice-cold buffer A (10 mM HEPES, 1.5 mM MgCl2, 10 mM KCl, 0.5 M DTT and 1 mini EDTA-free complete tablet in 10 ml water) was added to each well and kept in ice for 5 min. Second, breaking open cells to release the nuclei using a pre-chilled Dounce homogeniser (20 strokes with a tight pestle). Third, centrifuge dounced cells with 1000 rpm for 5 min at 4 °C, then collect the nucleus debris and lysed with 200 μl 1% Triton X-100 in PBS, the supernatant are retained as the cytoplasm fraction. Finally the 200 μl nucleus and the cytoplasm fraction (including cell membranes) are transferred to 96 well plates to measure fluorescence using a DMG FLUOStar OPTIMA.Cell proliferation and viability studies22
Cell proliferation assay: Briefly, cells were seeded in 24-well plates at 105 cells per well. At the time interval of 0, 24 and 48 h post-seeding, the cell culture medium was replaced by 500 μl fresh DMEM mediums containing 2, 10, 50, 200, and 500 μg ml−1 of CO3LDH nanoparticles, separately. After further 24 h incubation at normal growth conditions, aspirate all the medium from all the wells and added 200 μl PBS, then following added 25 μl MTT, 5 mg ml−1 in PBS, (3-(4,5-dimethylthiazol-2-yl)-2,5-diphenyltetrazolium bromide, Invitrogen, M6494) to each well and cells were incubated for further 30 min at 37 °C with shaking. Finally adding 600 μl DMSO to each well, 200 μl solution was measured at the absorbance of 544 nm using a DMG FLUOStar OPTIMA plate reader and normalised against the control. In addition, cell viability was monitored by counting viable cells on an Innovatis CEDEX HighRes® automated cell counter using trypan blue exclusion as the marker for viability 24, 48, and 72 h post-addition of the CO3LDH nanoparticles.DNA binding and delivery studies23
The pEGFP-N1 (4.7 kb in size from Clontech) was diluted to 1.6 μg μl−1 30 μl pEGFP-N1 was added to 1 ml CO3LDH LDH nanoparticle suspension (2.0 mg ml−1) and shaken using a thermal shaker for 4 h at 37 °C in a sealed sterile tube. Centrifugation (4 times) at 10![[thin space (1/6-em)]](https://www.rsc.org/images/entities/char_2009.gif) 000 rpm for 8 min followed by collection of the product, resuspension in 2 ml DMEM medium, denote with 1 mg ml−1 LDH–DNA, then dilute to 100 μg ml−1 with DMEM for using. NSC 34 cells were seeded in 24-well plates at a density of 105 cells per well and allowed to incubate at 37 °C for 24 h. The growth medium was then replaced with 2.0 ml of fresh DMEM medium that contained a 100 μg ml−1 LDH–DNA nano-hybrid. After 60 h incubation, cells were imaged using a fluorescence microscope (ZEISS, AxioCam HRc). Commercial transfection agent FuGENE®6 (Roche) was used in parallel with the above delivery tests.
000 rpm for 8 min followed by collection of the product, resuspension in 2 ml DMEM medium, denote with 1 mg ml−1 LDH–DNA, then dilute to 100 μg ml−1 with DMEM for using. NSC 34 cells were seeded in 24-well plates at a density of 105 cells per well and allowed to incubate at 37 °C for 24 h. The growth medium was then replaced with 2.0 ml of fresh DMEM medium that contained a 100 μg ml−1 LDH–DNA nano-hybrid. After 60 h incubation, cells were imaged using a fluorescence microscope (ZEISS, AxioCam HRc). Commercial transfection agent FuGENE®6 (Roche) was used in parallel with the above delivery tests.
Physical methods
Powder X-ray diffraction (XRD) patterns were measured on a PANalytical X'Pert Pro instrument in reflection mode with Cu Kα radiation under 40 kV with 40 mA. Fourier Transform Infrared spectroscopy (FT-IR) were recorded on a Bio-Rad FTS 6000 FTIR Spectrometer equipped with a DuraSamplIR II diamond accessory in attenuated total reflectance (ATR) mode in the range of 400–4000 cm−1. Chemical composition was determined by inductively coupled plasma and elemental analysis instrument. A Zeiss Supra 55 scanning electron microscope (SEM) with an accelerating voltage of 20 kV and a JEOL 2100 transmission electron microscopy (TEM) with an accelerating voltage of 200 kV were used to analyse sample morphology. Zeta potential and dynamic lighting scatting (DLS) diameter were conducted with photon correlation spectroscopy (PCS, Nanosizer Nano ZS, MALVERN Instruments). UV-Visible diffuse reflectance spectra were performed on a Lambda 750S UV-Vis spectrometer. The samples were first compressed into pellets with KBr. The fluorescence spectra were performed on LS55 Perkin Elmer Instruments spectrophotometer with the excitation at 490 nm, emission spectra of 495–700 nm.Results and discussion
Structure and morphology
In order to investigate how different sized LDHs nanoparticles interact with cells, we synthesised 20 nm [Mg3Al(OH)8](CO3)0.5; (CO3LDH) and 180 nm [Mg3Al(OH)8]NO3; (NO3LDH) nanoparticles. These materials were further labelled with fluorescein isothiocyanate isomer I (FITC) by either surface absorption to give CO3LDH-FTIC or by FITC intercalation to give NO3LDH-FTIC, respectively. The powder XRD (Fig. 1A) of CO3LDH, NO3LDH, CO3LDH-FTIC and NO3LDH-FTIC all exhibit a series of 00l Bragg reflections which are the characteristic reflections of the LDHs layered structure. The 003 Bragg reflection of CO3LDH-FTIC appears at (2θ = 11.6°, 0.76 nm) which is identical with the equivalent reflection in a pristine CO3LDH sample. Thus it can be inferred that the FITC was adsorbed on the surface of LDHs and not intercalated into the LDH. The full width at half maximum (FWHM) for the Bragg reflections of CO3LDH and CO3LDH-FTIC were almost the same, which suggests that there was no significant changes in the crystallinity following absorption of FITC. The SEM and TEM images (Fig. 1C and D) confirm that the individual CO3LDH nanoparticles are randomly dispersed and have average diameter of 20 nm with a narrow particle size distribution. The CO3LDH-FITC image (Fig. S1A in ESI†) exhibits a similar morphology with an unchanged platelet size. Particle size distribution measurements using dynamic light scattering (DLS) showed the average particle size was ca. 55 nm for CO3LDH, which then became 65 nm after the absorption of FITC (Fig. 1E and S1B†). This is in good agreement with the TEM data given the assumptions within the DLS analysis. The XRD of NO3LDH-FTIC shows an expanded interlayer spacing of 1.52 nm at 2θ = 5.8° (Fig. 1A), compared to that of NO3LDH (0.88 nm at 2θ = 10.1°), which is required in order to accommodate the larger FITC2− ion. Although not all the NO3− ions are removed from the LDH, the FITC2− ions act as interlayer props and expand all the interlayer galleries of the LDH. In the FTIR spectrum of NO3LDH-FTIC (Fig. 1B), we observe absorbances due to both NO3− and FITC2− vibrations. Based on the all spectroscopic data and the elemental composition data, NO3LDH-FTIC is best formulated as Mg3Al(OH)8(NO3)0.2(FITC)0.4. TEM and particle size distribution measurements show the particle size of NO3LDH was ca. 180 nm (Fig. S2†). The CO3LDH and NO3LDH as-prepared suspensions were transparent and homogenous which can be used to adsorb drug molecules or DNA as the cellular delivery agents.24 FT-IR spectra in Fig. 1B further confirmed the successful absorption and intercalation of the FITC anions into LDHs. The absorption peaks at 1574 cm−1 and 1461 cm−1 are assigned to the asymmetric and symmetric vibration bands of COO−.25 The vibrations at 1211 cm−1 and 1500 cm−1 are characteristic of the C–O–C and C–O (phenolic) bands, respectively.25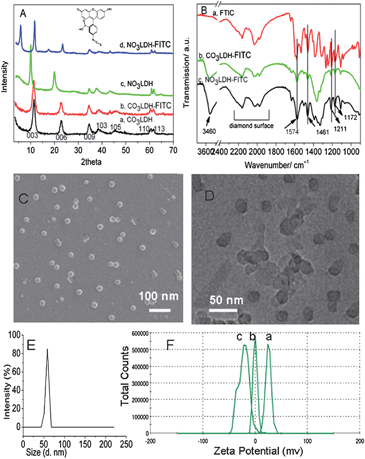 | ||
| Fig. 1 (A) XRD data for CO3LDH, NO3LDH and FITC labelled LDHs CO3LDH-FITC and NO3LDH-FITC; (B) FT-IR spectra for FITC and CO3LDH-FITC and NO3LDH-FITC; (C and D) SEM and TEM images for CO3LDH; (E) dynamic lighting scatting (DLS) results of CO3LDH. (F) Zeta-potential for (a) CO3-LDH with pH = 8.4; (b) 60 μg ml−1 CO3LDH-FITC aqueous suspension with pH = 8.1; (c) CO3LDH-FITC suspension in PBS buffer with pH = 8.3. | ||
The stable homogeneous suspension of the 20 nm CO3LDH nanoparticles has a narrow Zeta potential distribution at ca. 22.9 mV at pH = 8.4, which changes to −1.08 mV at pH = 8.1 after the absorption of FITC. The suspension of CO3LDH-FITC nanoparticles exhibits a Zeta potential of −20.4 mV at pH = 8.3 in PBS (phosphate buffered saline) buffer (Fig. 1F). This suggests that the FITC molecules exhibit electrostatic affinity for the LDHs surface and thus change the potential of the electrical double layer of the LDH particles.
Optical properties of the LDH nanoparticles
Solid samples of CO3LDH do not show any UV-vis absorption features (Fig. 2A). An aqueous solution of FITC (pH = 5.5, 1 × 10⁻⁵ M) exhibits an intense absorption at λmax = 480 nm with a shoulder at 453 nm,26 while solid FITC exhibits a broad absorption band within 300–600 nm with two distinct peaks at 453 and 540 nm (Fig. 2A). The solid state UV-vis absorption spectra of CO3LDH-FITC shows similar absorption properties to that of pure solid FITC, while the intercalated NO3LDH-FITC phase displays a blue shift absorption with two absorptions at 398 and 521 nm, which can be attributed to the enhanced host–guest intermolecular interactions. Similar phenomena has been observed previously for the intercalation of the 8-hydroxyquinolate-5-sulfonate metal complexes and 1-anilinonaphthalene-8-sulfonate into MgAl and ZnAl LDHs.3b,27 The photoluminescence spectra of a 1 × 10⁻⁵ M FITC solution at pH = 9.8, a suspension of 40 μg ml−1 CO3LDH-FITC nanoparticles and the suspension CO3LDH-FITC following cellular uptake studies are shown in Fig. 2B. They all show an emission at 520 nm following excitation at 490 nm. Therefore, the 520 nm emission from FITC was chosen as a way to detect the cellular uptake behavior.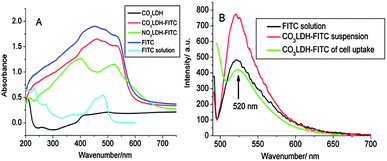 | ||
| Fig. 2 (A) Solid state, diffuse reflection UV–Vis absorption data for CO3LDH, CO3LDH-FITC, NO3LDH-FITC and FITC (solid and solution); (B) photoemission spectra (490 nm excitation) of FITC (1 × 10⁻⁵ M) and CO3LDH-FITC samples. | ||
Cellular uptake studies of the LDH nanoparticles
Choy verified that cellular uptake rates of LDHs were highly dependent on the particle concentration, incubation time, and the particle size in the range 50–350 nm.7b,28 In our experiments we have studied the cellular uptake of the 20 nm CO3LDH-FITC nanoparticles in NSC 34 cells. Fig. 3 shows the concentration dependent uptake of 20 nm CO3LDH-FITC. We observe that the level of uptake increases with increasing concentration from 6.25 to 100 μg ml−1. Two CO3LDH-FITC concentrations (25 and 75 μg ml−1) were chosen for time-dependent studies as shown in Fig. 4. Both LDHs samples show rapid initial uptake at incubation times up to 2 h, which then slows to a plateau after 7 h incubation. Moreover, the higher CO3LDH concentration experiments display an initial burst uptake, while the lower concentration display a relatively slow uptake within this same period (Fig. 4C). Choy et al.7b and Xu et al.15 have both reported similar responses for >100 nm LDH particles in NIH3T3 cells. Therefore, it appears that 20 nm CO3LDH nanoparticles exhibit similarities in cellular uptake in comparison to larger LDHs nanoparticles.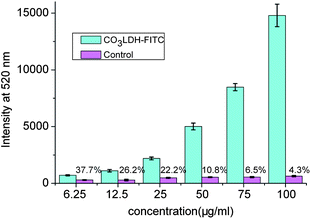 | ||
| Fig. 3 Cellular uptake curves for varied CO3LDH-FITC nanoparticles concentration dependence of the observed FITC fluorescence extracted from the NSC 34 cells. The quoted percent data is the cellular uptake fluorescence intensity ratio of CO3LDH-FITC compared to the control experiment. The data were obtained from three separated experiments. | ||
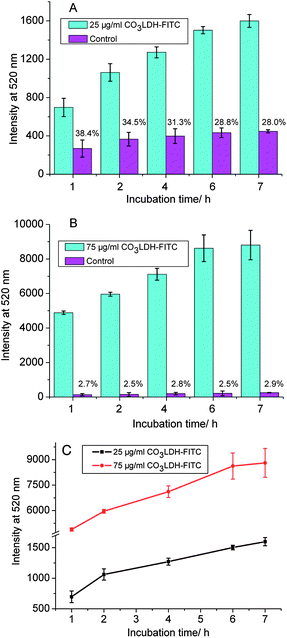 | ||
| Fig. 4 Cellular uptake kinetics into NSC 34 cells under different incubation times. The observed FITC fluorescence extracted from the cells in the presence of (A) 25 μg ml−1 and (B) 75 μg ml−1 CO3LDH-FITC nanoparticles; (C) comparison of the rate of FITC fluorescence uptake between the two concentrations. The data were obtained from duplicated experiments. | ||
Control experiments were performed in order to ensure that the fluorescence observed in the cell was due to the uptake of CO3LDH-FITC and not the uptake of FITC that might have been released from the LDH-FITC hybrids during the experiment. The supernatant liquor of CO3LDH-FITC suspension was chosen for the control experiments. The supernatant containing any released fluorescent marker was then analysed by a microplate reader to determine the balance release of the fluorescent markers from the nanoparticles. The amount of FITC released in vitro from the 25 and 75 μg ml−1 nanoparticles remains constant at pre-determined time intervals, representing a relatively stable binding of FITC. Looking at the effect of nanoparticle concentration on cellular uptake, it can be observed from Fig. 3 that the FITC released from CO3LDH-FITC shows weak uptake in the control experiments. We find that the greater the particle concentration, the less the uptake ratio of the supernatant solution to the suspension for the same concentration of CO3LDH-FITC. For example, the ratio is 37.7% for 6.25 μg ml−1 CO3LDH-FITC while it drops to 4.23% for 100 μg ml−1 CO3LDH-FITC as showed in Fig. 3. For the effect of incubation time on cell uptake, the ratio of the control experiments all show ca. 30% uptake of the 25 μg ml−1 nanoparticles, while it falls to below 3% for the 75 μg ml−1 nanoparticles (Fig. 4). From these results, we can infer that free FITC anions cannot intrude into the cells due to repulsive interactions between the negative-charged membrane and FITC, while the CO3LDH-FITC nanoparticles which exhibits a negative charge in PBS buffer can penetrate into the cellular membrane. Although the detailed mechanism of transferring LDHs into whole cells is not yet understood, it could proceed by the widely accepted endocytosis mechanism.5a,7b,15 Anionic gold nanorods modified with bovine serum albumin can also be uptaken by cells which is thought to proceed via receptor-mediated endocytosis.29 Another possible explanation is that the cell membrane can bind cationic, anionic, or both macromolecules because the cell membrane presents a negative charge, but it also contains both positively charged and neutral domains.30
Cellular fractionation uptake studies
The penetration of LDHs nanoparticles into the NSC 34 cells can be detected directly using confocal microscopy. As shown in Fig. 5A, the cytoplasm was observed in green fluorescence after the incubation with 6.25 μg ml−1 CO3LDH-FITC for 2.5 h, furthermore the nucleus fraction also showed weak green fluorescence, from which it can be inferred that the CO3LDH-FITC nanoparticles have also penetrated into the cellular nucleus. Incubation of the NSC 34 cells with an increased nanoparticle concentration of 10 μg ml−1 and incubation time to 3 h resulted in the green fluorescence spreading throughout the whole cell with increased fluorescence intensity (Fig. 5B). We performed a number of control experiments to ensure that the observed fluorescence within cells was due to the uptake of the CO3LDH-FITC nanoplatelets and not the uptake of FITC that may have leached from LDH surface during the experiment. Green fluorescence is not detected in the cells in the control experiment performed with the supernatant solution of 17 μg ml−1 CO3LDH-FITC and incubated for 3 h (Fig. 5C). Incubation of the cells with free FITC anions at a much higher concentration (6.25 μg ml−1) than that in the CO3LDH-FITC samples resulted in the uniformly weak green fluorescence within the cells because of the diffusion rather than endocytosis (Fig. 5D).15,31 Furthermore, the localisation of the 20 nm CO3LDH-FITC nanoparticles in the nucleus is visible from the TEM images (Fig. S5 in ESI†). In addition, incubation of NSC 34 cells with larger LDH nanoparticles (ca. 35 nm CO3LDH and 180 nm NO3LDH) did not result in the observation of fluorescence in the nucleus (Fig. S3 and S4†). Our results suggest that for an LDH nanoplatelet to act an effective carrier to enter into the nucleus is the minimum diameter is 20 nm. This may be that 20 nm diameter CO3LDH nanoparticles are able to pass through the cylinder-like nuclear pores (25–30 nm wide) and thus enter the nucleus after clathrin-mediated endocytosis and or is mediated by microtubule networks which are directed towards the nucleus.15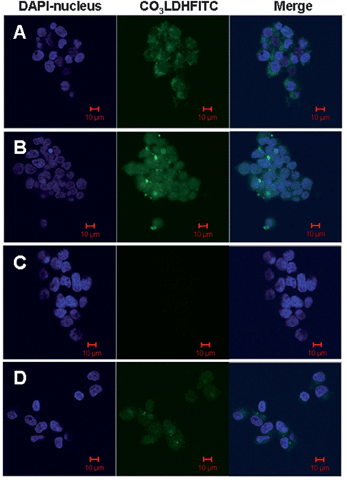 | ||
| Fig. 5 Confocal microscopic images of intracellular localization in NSC 34 cells: (A) 6.25 μg ml−1 CO3LDH-FITC, incubated for 2.5 h; (B) 10 μg ml−1 CO3LDH-FITC, incubated for 3 h; (C) control experiment performed with supernatant solution of 17 μg ml−1 CO3-LDH-FITC, incubated for 3 h; (D) free 6.25 μg ml−1 FITC anions incubated for 4 h. | ||
The amount of CO3LDH-FITC intruded into the cytoplasm and nucleus as a function of CO3LDH-FITC concentration was investigated. The amount of FITC localised in the nucleus and cytoplasm exhibits gradually an almost linear increase with the increasing CO3LDH-FITC concentration in the culture medium (Fig. 6), which suggested an enhanced nucleus translocation of CO3LDH-FITC nanoparticles. Previously Xu et al. showed that cellular uptake of LDH-FITC nanorods localised in the nucleus and cytoplasm increased with the extended incubation time at a fixed LDHs concentration.15
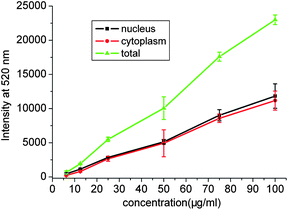 | ||
| Fig. 6 Cellular uptake curves for CO3LDH-FITC with NSC 34 cells. Intracellular distribution (nucleus and cytoplasm) as a function of concentration of CO3LDH-FITC. The data were obtained from three separated experiments. | ||
Cytotoxicity studies of the LDH nanoparticles
Cytotoxicity is one of the major concerns when using LDHs nanoparticles in biomedical applications and it has been studied by several groups.5a,7b The proliferation and viability of NSC 34 cells in the presence of various concentrations (2 to 500 μg ml−1) of CO3LDH-FITC nanoparticles were displayed in Fig. 7. As expected, an increase in the CO3LDH-FITC concentration leads to the lower proliferation and more cell death. We observe a decrease to 65% cell proliferation and 58% cell viability at a CO3LDH-FITC concentration of 500 μg ml−1. However, using CO3LDH-FITC nanoparticles below 200 μg ml−1 showed reduced cytotoxicity, as there was no significant decrease in cell proliferation and viability.7b,23 The concentration of LDHs materials used in drug and gene delivery systems is usually below 100 μg ml−1, which suggests that these LDH nanoparticles should be biologically safe materials for the drug and gene delivery.23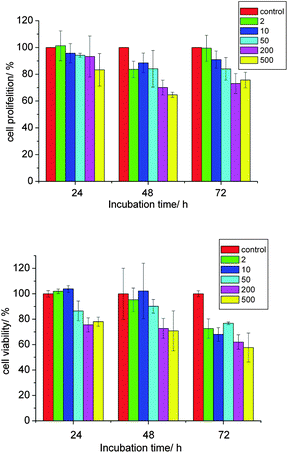 | ||
| Fig. 7 The proliferation and viability of the cells versus the various concentrations of CO3LDH-FITC from 2–500 μg ml−1 under 1–3 days incubation time. The cell proliferation data was from duplicated experiment. The cell viability date was from three separated experiments. | ||
Transfection effect of NSC 34 cells
Since we have established the minimal toxicity of 20 nm MgAl-LDH nanoparticles to NSC 34 cells, we proceeded to investigate if these nanoparticles can be utilised in gene transfection. Transfection studies were carried out with pEGFP-N1 DNA (4.7 kb) plasmid, which encodes for the enhanced green fluorescent protein (EGFP). DNA modified 20 nm CO3LDH (CO3LDH–DNA) nanoparticles were assessed for the in vitro transfection of pEGFP-N1 in NSC 34 cells. Xu's group indicated that there are a relatively strong interaction between an LDH and DNA because they do not migrate during a gel shift assay while DNA associates with NO3LDH particles.8 Following the transfection for 60 h, green fluorescent cells were observed through the expression of GFP as showed in Fig. 8A. Even brighter fluorescent cells were seen for the transfection of DNA modified NO3LDH (NO3LDH–DNA) as shown in Fig. 8B, while there is no expression of GFP with naked DNA for 3 days, which is not shown here.23 NO3LDH–DNA exhibits more GFP transfection compared to CO3LDH–DNA. This maybe due to the fact that the DNA in NO3LDH–DNA should be located in the interlayer region of the LDH following ion exchange with the nitrates ions while for CO3LDH–DNA the DNA can only be absorbed on the surface of the LDH nanoparticles as CO32− cannot be removed from an LDH by ion exchange. Consequently, NO3LDH–DNA should offer increased protection of the DNA from enzymatic degradation upon intercalation into the interlayers compared to the DNA bonded on the surface of CO3LDH.5a,8 The corresponding bright-field image indicates most cells are viable (Fig. 7D). Although 180 nm NO3LDH cannot enter the cell nucleus they exhibit gene expression, which may be due to dissociation of DNA from NO3LDH occurring close to the cell nucleus, so that the DNA could be protected until its entry into the nucleus.5a Although there are many more NSC 34 cells transfected with the commercial reagent FuGENE®6 under similar conditions (Fig. 7C), the LDH nanoparticles still offer a promising strategy for gene delivery to cells. Xu et al. has also demonstrated that the transfection efficiency using ca. 100 nm NO3LDH nanoparticles is still relatively low (ca. 3–6%) in comparison with 10–15% using the commercial agent FuGENE®6 under the similar conditions using fluorescence activated flow cytometry (FACS) analysis.23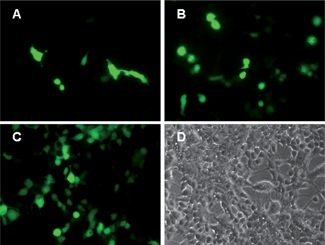 | ||
| Fig. 8 Fluorescence microscopic images of cells with pEGFP-N1 expressed 60 h after transfection using DNA modified (A) 100 μg ml−1 CO3LDH; (B) 100 μg ml−1 NO3LDH; (C) a commercial agent, FuGENE®6 at 5.0 μg ml−1; (D) bright field image of (A). | ||
Conclusion
This work reports the uptake of fluorescein isothiocyanate labelled 20 nm diameter LDH nanoplatelets into NSC 34 cells. For 20 nm LDH nanoparticles we find equivalent uptake into the cellular cytoplasm and nucleus, while for 180 nm NO3LDH-FITC we only observe intrusion into the cytoplasm fraction. A preliminary assessment of cytotoxicity for the 20 nm CO3LDH demonstrated the minimal effects on cellular viability. A successful gene transfection by a LDH–DNA composite also suggests that the LDHs nanoparticles may be potentially applied in the specific delivery of biologically active molecules.Acknowledgements
This work was supported by Natural Science Funds of China, and 111 Project (grant no.: B07004) of China, Central University Research Funds of 2011. We thank Gareth R. Williams, London Metropolitan University for the useful discussions.Notes and references
- (a) Q. Wang and D. O'hare, Chem. Rev., 2012, 112, 4124 CrossRef CAS; (b) X. Duan and D. G. Evans, Chem. Commun., 2006, 485 Search PubMed; (c) F. Leroux and C. Taviot-Gueho, J. Mater. Chem., 2005, 15, 3628 RSC.
- L. He, Y. Huang, A. Wang, X. Wang, X. Chen, J. J. Delgado and T. Zhang, Angew. Chem., Int. Ed., 2012, 51, 6191 CrossRef CAS.
- (a) S. Li, J. Lu, M. Wei, D. G. Evans and X. Duan, Adv. Funct. Mater., 2010, 20, 2848 CrossRef CAS; (b) S. Li, J. Lu, J. Xu, S. Dang, D. G. Evans and X. Duan, J. Mater. Chem., 2010, 20, 9718 RSC; (c) S. Li, J. Lu, H. Ma, J. Xu, D. Yan, M. Wei, D. G. Evans and X. Duan, Langmuir, 2011, 27, 11501 CrossRef CAS; (d) S. Li, J. Lu, H. Ma, D. Yan, Z. Li, S. Qin, D. G. Evans and X. Duan, J. Phys. Chem. C, 2012, 116, 12836 CrossRef CAS.
- M. Shao, F. Ning, J. Zhao, M. Wei, D. G. Evans and X. Duan, J. Am. Chem. Soc., 2012, 134, 1071 CrossRef CAS.
- (a) Z. P. Xu, Q. H. Zeng, G. Q. Lu and A. B. Yu, Chem. Eng. Sci., 2006, 61, 1027 CrossRef CAS; (b) A. W. Musumeci, G. M. Mortimer, M. K. Butler, Z. P. Xu, R. F. Minchin and D. J. Martin, Appl. Clay Sci., 2010, 48, 271 CrossRef CAS.
- A. I. Khan, A. Ragavan, B. Fong, C. Markland, M. O'Brien, T. G. Dunbar, G. R. Williams and D. O'Hare, Ind. Eng. Chem. Res., 2009, 48, 10196 CrossRef CAS.
- (a) D.-H. Park, J.-E. Kim, J.-M. Oh, Y.-G. Shul and J.-H. Choy, J. Am. Chem. Soc., 2010, 132, 16735 CrossRef CAS; (b) J.-H. Choy, S.-Y. Kwak, Y.-J. Jeong and J.-S. Park, Angew. Chem., Int. Ed., 2000, 39, 4041 CrossRef.
- K. Ladewig, M. Niebert, Z. P. Xu, P. P. Gray and G. Q. M. Lu, Appl. Clay Sci., 2010, 48, 280 CrossRef CAS.
- A. Li, L. L. Qin, W. R. Wang, R. R. Zhu, Y. C. Yu, H. Liu and S. L. Wang, Biomaterials, 2011, 32, 469 CrossRef CAS.
- (a) C. Kneuer, M. Sameti, U. Bakowsky, T. Schiestel, H. Schirra and C.-S. Lehr, Bioconjugate Chem., 2000, 11, 926 CrossRef CAS; (b) C.-W. Kuo, D.-Y. Chueh, N. Singh, F.-C. Chien and P. Chen, Bioconjugate Chem., 2011, 22, 1073 CrossRef CAS.
- (a) N. W. S. Kam, T. C. Jessop, P. A. Wender and H. J. Dai, J. Am. Chem. Soc., 2004, 126, 6850 CrossRef CAS; (b) B. Kang, M. A. Mackey and M. A. EI-Sayed, J. Am. Chem. Soc., 2010, 132, 1517 CrossRef CAS.
- K. M. Tyner, M. S. Roberson, K. A. Berghorn, L. Li, R. F. Gilmour, C. A. Batt and E. P. Giannelis, J. Controlled Release, 2004, 100, 399 CrossRef CAS.
- (a) J.-M. Oh, S.-J. Choi, S.-T. Kim and J.-H. Choy, Bioconjugate Chem., 2006, 17, 1411 CrossRef CAS; (b) S. J. Choi, G. E. Choi, J. M. Oh, Y. J. Oh, M. C. Park and J. H. Choy, J. Mater. Chem., 2010, 20, 9463 RSC.
- (a) Z. Gu, B. E. Rolfe, A. C. Thomas, J. H. Campbell, G. Q. Lu and Z. P. Xu, Biomaterials, 2011, 32, 7234 CrossRef CAS; (b) Z. Gu, B. E. Rolfe, A. C. Thomas, J. H. Campbell, G. Q. Lu and Z. P. Xu, Biomaterials, 2010, 31, 5455 CrossRef CAS; (c) J. Liu, R. Harrison, J. Z. Zhou, T. T. Liu, C. Z. Yu, G. Q. Lu, S. Z. Qiao and Z. P. Xu, J. Mater. Chem., 2011, 21, 10641 RSC.
- Z. P. Xu, M. Niebert, K. Porazik, T. L. Walker, H. M. Cooper, A. P. J. Middelberg, P. P. Gray, P. F. Bartlett and G. Q. Lu, J. Controlled Release, 2008, 130, 86 CrossRef CAS.
- (a) Y. Wong, H. M. Cooper, K. Zhang, M. Chen, P. Bartlett and X. P. Xu, J. Controlled Release, 2012, 369, 453 CAS; (b) K. Y. Wong, K. Markham, Z. P. Xu, M. Chen, G. Q. M. Lu, P. F. Bartlett and H. M. Cooper, Biomaterials, 2010, 31, 8770 CrossRef.
- J. M. de la Fuente and C. C. Berry, Bioconjugate Chem., 2005, 16, 1176 CrossRef CAS.
- Y.-S. Lin, C.-P. Tsai, H.-Y. Huang, C.-T. Kuo, Y. Hung, D.-M. Huang, Y.-C. Chen and C.-Y. Mou, Chem. Mater., 2005, 17, 4570 CrossRef CAS.
- K.-Y. Win and S.-S. Feng, Biomaterials, 2005, 26, 2713 CrossRef CAS.
- Q. Wang, H.-H. Tay, Z. Guo, L. Chen, Y. Liu, J. Chang, Z. Zhong, J. Luo and A. Borgna, Appl. Clay Sci., 2012, 55, 18 CrossRef CAS.
- http://www.lamondlab.com/f7nucleolarprotocol.htm .
- (a) S.-J. Choi, J.-M. Oh and J.-H. Choy, J. Nanosci. Nanotechnol., 2008, 8, 5297 CrossRef CAS; (b) S.-J. Choi, J.-M. Oh, T. Park and J.-H. Choy, J. Nanosci. Nanotechnol., 2007, 7, 4017 CrossRef CAS.
- Z. P. Xu, T. L. Walker, K. Liu, H. M. Cooper, G. Q. M. Lu and P. F. Bartlett, Int. J. Nanomed., 2007, 2, 163 CAS.
- Z. P. Xu, G. S. Stevenson, C.-Q. Lu, G.-Q. Lu, P. F. Bartlett and P. P. Gray, J. Am. Chem. Soc., 2006, 128, 36 CrossRef CAS.
- L. Wang, A. Roitberg, C. Meuse and A. K. Gaigalas, Spectrochim. Acta, Part A, 2001, 57, 1781 CrossRef CAS.
- (a) N. O. Mchedlov-Petrossyan, Y. V. Isaenko, N. A. Vodolazkaya and S. T. Goga, CPS, Phys. Chem., 2003, 0309005 Search PubMed; (b) R. Sjoback, J. Nygren and M. Kubista, Spectrochim. Acta, Part A, 1995, 51, L7 Search PubMed.
- Z. Sun, L. Jin, W. Shi, M. Wei, D. G. Evans and X. Duan, Langmuir, 2011, 27, 7113 CrossRef CAS.
- J.-M. Oh, S.-J. Choi, G.-E. Lee, J.-E. Kim and J.-H. Choy, Chem.–Asian J., 2009, 4, 67 CrossRef CAS.
- A. M. Alkilany, P. K. Nagaria, C. R. Hexel, T. J. Shaw, C. J. Murphy and M. D. Wyatt, Small, 2009, 5, 701 CrossRef CAS.
- E. C. Dreaden, A. M. Alkilany, X. Huang, C. J. Murphy and M. A. EI-Sayed, Chem. Soc. Rev., 2012, 41, 2740 RSC.
- R. A. Preston, R. F. Murphy and E. W. Jones, J. Cell Biol., 1987, 105, 1981 CrossRef CAS.
Footnote |
| † Electronic supplementary information (ESI) available: Size distribution and TEM image for CO3LDH-FITC and NO3LDH; the confocal and fluorescent microscope images for cellular uptake of CO3LDH and NO3LDH; TEM image for cellular uptake of CO3LDH. See DOI: 10.1039/c2tb00081d |
| This journal is © The Royal Society of Chemistry 2013 |
