First-principles thermodynamic calculations and experimental investigation of Sr–Si–N–O system—synthesis of Sr2Si5N8:Eu phosphor†
Yongseon
Kim
a,
Jaecheol
Kim
b and
Shinhoo
Kang
*b
aDepartment of Materials Science and Engineering, Inha University, Incheon, 402-751, Korea. E-mail: ys.kim@inha.ac.kr
bDepartment of Materials Science and Engineering, Seoul National University, Seoul, 151-742, Korea. E-mail: shinkang@snu.ac.kr; cheol@snu.ac.kr; Fax: +82-2-884-1578; Tel: +82-2-880-7167
First published on 25th October 2012
Abstract
Thermodynamic stabilities of the phases of Sr–Si–N–O system were evaluated by simulating phase diagrams at various conditions based on first-principles density functional theory calculations. Synthesis conditions and stability of the compounds belonging to the system, in which oxidation and nitridation reactions are involved complicatedly, could be interpreted through this first systematic investigation on the two-gas system. Practical synthetic methods of nitrides, such as hydrogen-reduction and nitridation or carbothermal reduction and nitridation reactions, were studied with special attention. This study enabled us to calculate proper conditions for synthesis of the Sr2Si5N8 phase, which is drawing attention as a new phosphor material for light emitting diodes. The types of impurities appearing with deviation from the proper synthetic conditions were also investigated, which may provide information about optimizing synthesis conditions. Synthesis of Sr2Si5N8:Eu phosphor using SiO2, instead of conventionally used Si3N4, was predicted by first-principles calculations, and we succeeded in synthesizing Sr2Si5N8:Eu phosphor for the first time using all oxide raw materials under normal pressure on this basis. The results of this study are expected to provide useful guidelines for synthesis of nitrides and the established simulation method may effectively be applied to other multi-gas systems.
1. Introduction
Non-oxide solids have recently attracted great interest as they are expected to show novel properties that cannot be provided by conventional oxide materials. Owing to their thermal, chemical, and mechanical stabilities, nitridosilicates, oxonitridosilicates, or oxonitridoaluminosilicates have been actively investigated.1–4 They are also known to exhibit more variety of structural features than silicates. Typical building units of silicates are SiO4 tetrahedra and the oxygen atoms are connected to only one or two Si atoms; whereas, it was reported that nitrogen atoms can have more connections, even to four silicon atoms, thus, the crystals including nitrogen atoms have a high structural diversity.5–9Considering this point, many researchers have been focusing on the preparation and characterization of new nitrido- or oxonitridosilicates, especially in the systems containing the Si–N–O framework and countercations, such as Ca, Sr, or Ba. These compounds have been studied as hosts for rare earths (RE) because the higher covalent character of nitrogen than that of oxygen bonding can induce photoluminescent excitation and emission in the much longer wavelength range than oxide materials, and the cations can provide a site for RE activators.10–12 MSi2O2N2:RE, MAlSiN3:RE, α- and β-SiAlON:RE, and M2Si5N8:RE have been extensively studied as new phosphor materials.13–18
Sr2Si5N8 may be one of the most successful outcomes of the research efforts. This material has emerged as a host for RE doped phosphor materials applied in light emitting diodes (LEDs).11,16,19,20 In phosphor converted LEDs, blue light generated from a semiconductor source is used to excite luminescent materials that emit a longer wavelength of light. YAl3O5:Ce3+ is widely used for white LEDs because the yellow emission of the phosphor can make white light, combined with the blue light from the GaN-based semiconductor. However, this combination is insufficient in terms of color rendering property because of the lack of red emission. Sr2Si5N8:Eu2+ is an excellent supplementation to this problem because it shows orange-red emission with high quantum efficiency and low thermal quenching under excitation with blue light, this makes it an encouraging red phosphor to improve the color rendering of white LEDs.19,21,22
Various synthetic routes were tried for the synthesis of M–Si–N system compounds. It was reported that nitride phases, such as SrSiN2, Sr2Si5N8, SrSi6N8, and SrSi7N10 were synthesized through a high temperature reaction of stoichiometric amounts of metals with silicon diimide,11,23–26 or reaction of all nitride materials under a nitrogen atmosphere.16,27 Recently, the carbothermal reduction and nitridation (CRN) method was used to produce the Sr2Si5N8:Eu2+ phosphor using SrCO3, Eu2O3, and Si3N4 as starting materials. Xie et al.11 reported that Sr2Si5N8:Eu2+ could be synthesized by firing SrCO3, Eu2O3, and Si3N4 mixtures under high N2 pressure. The resultant compound contained some amount of Sr2SiO4 as an impurity phase.
Although researchers have tried various methods and some of them were successful, difficulty in synthesis still seems to be the main obstacle for the investigation of compounds containing nitrogen. Unlike oxide materials whose synthesis is mainly controlled by the heating temperature, nitride or oxonitride preparation requires precise control of temperature, and nitrogen and oxygen partial pressures. The situation becomes more complicated by interactions of these conditions. Thus, it is necessary to investigate the synthesis conditions and their effects on the stability of phases in terms of a systematic thermochemical approach. Yet, to the best of our knowledge, there have been few attempts on this subject.
In this study, we investigated phase equilibria of the Sr–Si–N–O system by a first-principles thermodynamic calculation method. Energies of the compounds that belong to the system were calculated using density functional theory (DFT) and the enthalpies of nitrogen and oxygen molecules were determined through the combination of the first-principles calculation and experimental data. Through simulating phase stability of the compounds at various conditions, phase diagrams of the Sr–Si–N–O system were constructed. Phase equilibria under thermodynamic conditions of hydrogen-thermal reduction and nitridation (HRN) and CRN reactions—the methods that are generally used for commercial production—were especially deeply investigated. The calculations’ results showed excellent agreement with experimental data that supports the validity of our simulation model and methods, thus this first attempt of a systematic study is expected to provide a useful reference for synthesis and thermodynamic stabilities of the phases containing nitrogen.
2. Methods
Phase diagrams are formed with thermodynamically stable compounds at given conditions, thus comparison of the Gibbs free energies among the phases is necessary. To construct the ternary phase diagram of the Sr–Si–N–O quaternary system, the fourth element going in and out of the planar ternary diagram should be considered in comparing the phase stability. That is, for compounds with a general chemical formula of SraSibNcOd, the grand potential, which is expressed as follows, should be used as a measure of thermodynamic stability:For solid state compounds, it can be approximated as:28,29
Nitrogen exists in the gas state, thus 1/2 μN2 is used for the comparison of stability. Changes of μN2 and μO2 with temperature and pressure were reflected according to the data of JANAF thermochemical table30 because the effects of volume and entropy of gases cannot be neglected. For each phase, the position on a ternary diagram (x and y) and the grand potential value (z) can make a unique coordination in a 3-D space. Taking vertices and edges, which form a convex hull,31 to the −z direction and projecting them on a 2-D plane, ternary phase diagrams could be constructed.
The energy of each compound was calculated using DFT based on the generalized gradient approximation of Perdew–Burke–Ernzerhof and projector-augmented plane wave (PAW) pseudopotentials implemented in the Vienna ab initio simulation package (VASP),32–34 with an energy cutoff of 500 eV, 3 × 3 × 1 k-mesh points, and self consistency field (SCF) convergence of 10−5 eV. We allowed full relaxation of atomic positions and lattice vectors of the crystal models composed of one unit cell, for the structure optimization and calculation of energy. Compounds of Sr–Si–N–O system registered in the international crystal structure database (ICSD) were calculated,35 and new phases that have been reported recently were added.10,23–27,36–38 Because gas phases are difficult to calculate accurately, the room-temperature enthalpies of nitrogen and oxygen molecules were determined so that energies of nitride or oxide crystals calculated by DFT may agree with experimental data (section 3.1). All the calculated energies are presented in the ESI.†
The first-principles study was examined experimentally: synthesis of Sr2Si5N8, which draws interest for its potential application in LEDs, was tried under various conditions, and phases of the resulting powder samples were observed. SrCO3 (Sigma-Aldrich, 99.9%) and SiO2 (Alfa Aesar, 99.9%) were used as starting materials, and Eu2O3 (Sigma-Aldrich, 99.9%) was added for synthesis of the Eu-doped phosphor material. Si3N4 was also tested as a Si source instead of SiO2 and the results were compared. The raw materials were dry-mixed, ground, and embedded in graphite crucibles. The mixtures were fired in a tube furnace of 60 mm diameter and 700 mm length. Two types of reduction process, HRN and CRN reactions, were tested. For HRN reactions, a flow of 100 sccm of mixed gas H2–N2 5/95 was used. Active carbon granules were mixed with the raw powders and 100 sccm gas flow of pure N2 was used for CRN reactions. The amount of carbon was changed to examine the effect of change in oxygen partial pressure. The powder samples after firing were analyzed using X-ray diffraction (XRD, Rigaku D-max 2500). The photoluminescent property of Sr2Si5N8:Eu phosphor was measured using a spectrofluorometer (Jasco FP-5600) with Xe-lamp as a light source.
3. Calculation results and discussion
3.1. Determination of enthalpies of O2 and N2
For a thermochemical interpretation of a system that contains nitrides or oxides, the energy change of the nitridation or oxidation reaction must be calculated with accuracy. However, first-principles calculation often shows considerable errors because gaseous phases are difficult to make a proper structure model for, and calculation of binding energies between the atoms is often incorrect. It was also reported that GGA error occurs for oxygen when O2− is formed from O2 by adding electrons to p orbitals.28,39 Yet the overall errors related to the oxidation reactions can be corrected just by determining the proper enthalpy value of O2 molecules so that it may include all the errors, because they usually show a similar amount irrespective of the cations involved.39 Thus, determination of proper chemical potential values of N2 and O2 can compensate DFT errors conveniently and improve the accuracy of calculations for nitridation or oxidation reactions.We calculated the energies of nitrides or oxides of metals of various oxidation numbers (Mg, Ca, Al, Si, Zr, Nb) and compared them with the reported experimental standard formation enthalpy values, and then determined enthalpies of nitrogen and oxygen molecules so that the DFT calculations may agree with experimental data. That is, enthalpies of gas phases, which form the results of the following equation, dovetail into the existing data:
| ΔHf,calc(MxG2) = Hcalc(MxG2) − xHcalc(M) − H(G2) |
| = {Ecalc(MxG2) + PV(MxG2)} − x{Ecalc(M) + PV(M)} − H(G2) |
| ≈ Ecalc(MxG2) − xEcalc(M) − H(G2) |
Energies of nitrides and oxides calculated by DFT are shown in Fig. 1. The enthalpies of N2 and O2 (H(G2) of above equations) obtained by the method mentioned above are also presented in the figure. Although energies of nitrides (Mg3N2, Ca3N2, 2AlN, 1/2Si3N4, 2ZrN, 2NbN) and oxides (2MgO, 2CaO, 2/3Al2O3, SiO2, ZrO2, 2/5Nb2O5) are different depending on the cations involved, the enthalpies of N2 and O2 determined appeared nearly identical. This again indicates that a consistent thermodynamic calculation is possible regardless of the cations, just by determining the enthalpies of the gas phases to include all the error terms occurring with DFT calculations of nitridation or oxidation reactions.
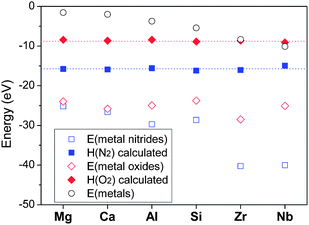 | ||
Fig. 1 Determination of chemical potentials of nitrogen and oxygen: calculated energies of metals (○), nitrides ( ), oxides ( ), oxides ( ), and room-temperature chemical potentials of nitrogen ( ), and room-temperature chemical potentials of nitrogen ( ) and oxygen ( ) and oxygen ( ) assigned so that they may make the calculation method agree with existing data of standard formation enthalpies. ) assigned so that they may make the calculation method agree with existing data of standard formation enthalpies. | ||
Another error factor that should be considered is that DFT calculation assumes 0 K while standard formation enthalpies are obtained at 298 K. Integration of the difference of heat capacities between metals and their nitrides or oxides from 0 K to 298 K should be corrected in principle. However, this error was reported to be negligible and of affects little, thus can be dispensed with.39 As a result, the room-temperature chemical potentials of 1 atm N2 and O2 were determined to be −16.05 eV per fu and –8.95 eV per fu, respectively (fu = formula unit). These values were used for all the nitridation and oxidation reactions in this study, with a modification of the effects of temperature and pressure based on the JANAF thermochemical table.
3.2. Sr–Si–N system and formation of Si3N4
Fig. 2 shows the room-temperature phase diagram of Sr–Si–N system, which was calculated excluding oxygen. The phase diagram shows that SrSi2, SrSi, and Sr2Si exist as stable phases on the Sr–Si line, and this result agrees well with experimental reports.40 Sr5Si3, which is reported to exist at room temperature, did not appear stable in the diagram, which is the only disagreement. Close examination revealed that the Gibbs free energy of Sr5Si3 was located just above the calculated convex hull, which indicates that the disagreement originates from a minute error of first-principles calculations. The phases on the Si–N and Sr–N lines also showed good agreement with previous reports.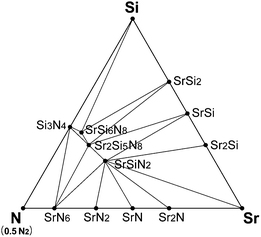 | ||
| Fig. 2 Equilibrium phase diagram of Sr–Si–N system at room temperature simulated by first-principles method. | ||
Nitrides of ternary components, such as SrSiN2, Sr2Si5N8, SrSi6N8, and SrSi7N10 are known to exist for the Sr–Si–N system, but SrSi7N10 did not appear to be stable in our simulation. Pilet et al.27 synthesized this phase for the time, but they reported that it was not a single phase and considerable amounts of Sr2Si5N8 and Si3N4 were mixed together. Further investigation may be necessary to verify whether SrSi7N10 is a thermodynamically stable phase or just a metastable compound that appears by kinetic reasons. Altogether, our simulation model seems to give an exact reflection of experimental results.
Fig. 3 shows the phase diagrams of Sr–Si–N system simulated for the conditions just before (Fig. 3a) and after (Fig. 3b) the appearance of Si3N4 as oxygen partial pressure was reduced. When O2 partial pressure is not sufficiently low, only oxides (SrSiO3, Sr2SiO4, and Sr3SiO5) existed as stable phases (Fig. 3a). As the partial pressure of oxygen becomes smaller, the Si3N4 phase appeared at certain points (Fig. 3b) which were reported to be pO2 = 10−18.7 MPa at 1623 K and 10−21 MPa at 1473 K.41 The O2 partial pressure of the points calculated in this study were 10−18.1 MPa and 10−20.7 MPa, respectively, for the same conditions, which shows excellent agreement with the experimental data. This observation again shows that the first-principles model of this study was well designed for precise simulation of the real situation.
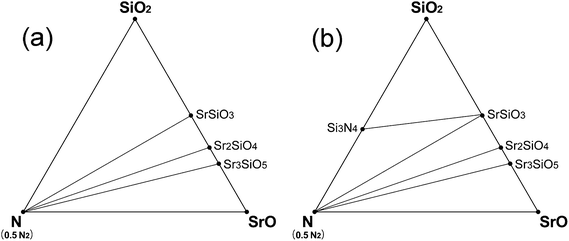 | ||
| Fig. 3 Phase diagrams of Sr–Si–N–O system simulated at the vicinity of appearance of the Si3N4 phase: (a) at 1620 K (pO2 = 10−17.6 MPa, μN2 = −19.07 eV, μO2 = −17.25 eV) or at 1470 K (pO2 = 10−20.0 MPa μN2 = −18.82 eV, μO2 = −17.10 eV), conditions that fall slightly short of the requirement for stability of Si3N4, and (b) at 1620 K (pO2 = 10−18.3 MPa μN2 = −19.07 eV, μO2 = −17.35 eV) or at 1470 K (pO2 = 10−20.9 MPa μN2 = −18.82 eV, μO2 = −17.20 eV), the necessary conditions for stability of Si3N4 are fulfilled by a narrow margin. pN2 is assumed to be 0.1 MPa for all the cases. | ||
3.3. Hydrogen-thermal and carbothermal reduction and nitridation (HRN and CRN)
HRN and CRN reactions are widely used for thermal reduction or synthesis of nitride materials. These methods reduce oxygen partial pressure by oxidation of hydrogen or carbon, and the equilibrium partial pressure changes with temperature. Equilibrium oxygen partial pressures of HRN and CRN reactions were read from the Ellingham diagram42 and presented with respect to temperature in Fig. 4 (empty symbols). Combining them with the room-temperature enthalpies obtained in section 3.1 and thermochemical data (HoT − Ho298, So) of the JANAF table, the chemical potential of O2 can be calculated for both of the reactions. They are presented in Fig. 4 (solid symbols).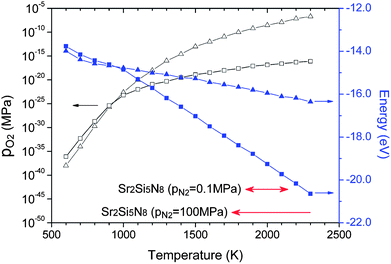 | ||
| Fig. 4 Equilibrium partial pressures (empty symbols) and chemical potentials (solid symbols) in hydrogen-thermal (triangles) and carbothermal (squares) reducing atmospheres read and calculated from the Ellingham diagram. The temperature range where Sr2Si5N8 appears as a stable phase is indicated at the bottom of the diagram at two different nitrogen pressures. | ||
Under a normal N2 flow condition without pressurizing, the N2 partial pressure was assumed to be 0.1 MPa (normal pressure). Then the N2 chemical potential at given temperatures could also be calculated from the room-temperature enthalpies calculated in section 3.1 and the data of the JANAF table, in the same way as the oxygen chemical potential mentioned above. Using the calculated N2 and O2 chemical potentials, the Sr–Si–N–O phase diagram under HRN condition was simulated (Fig. 5). Six phases—SrO, SiO2, N2, SrSiO3, Sr2SiO4, and Sr3SiO5—existed as thermodynamically stable forms that compose the convex hull. This did not change in the range of 1000–2300 K. It seems that the oxygen chemical potential is too high because of the high oxygen partial pressure for HRN conditions, making nitride phases unstable.
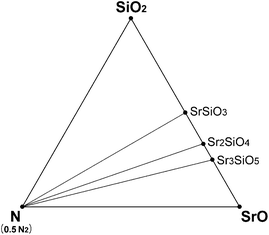 | ||
| Fig. 5 Phase diagram of Sr–Si–N–O system simulated for HRN conditions (T = 1000–2300 K). | ||
Phase diagrams for the CRN reaction were also simulated in the same way as that of HRN. Oxygen chemical potential under CRN conditions changed over a wider range with temperature, and therefore many phases emerged or disappeared with temperature change. The phase diagram of CRN at 1400 and 1500 K is given in Fig. 6a, which shows that only oxide compounds, such as SrSiO3, Sr2SiO4, and Sr3SiO5, are stable, probably because the O2 chemical potential is not low enough in the temperature range. In the diagram of 1600 K, Si3N4, the first nitride phase appeared (Fig. 6b).
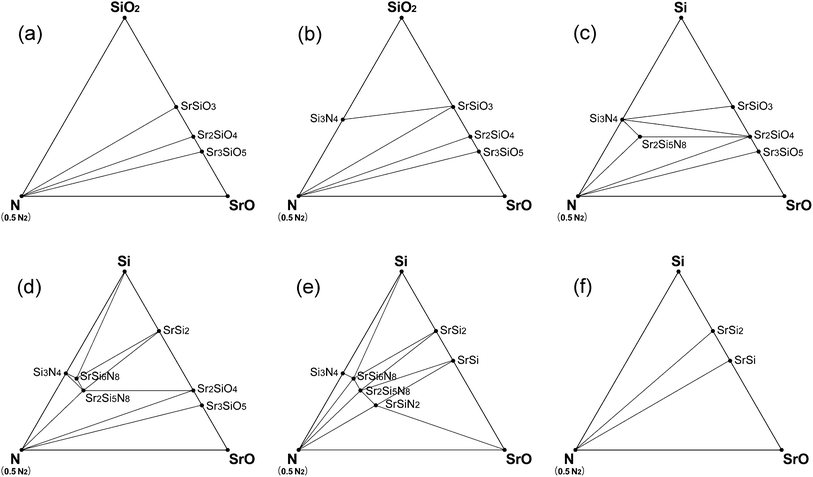 | ||
| Fig. 6 Phase diagrams of Sr–Si–N–O system simulated for CRN conditions: (a) at 1400–1500 K, (b) 1600–1800 K, (c) 1900 K, (d) 2000 K, (e) 2100 K, and (f) 2200 K. | ||
Si3N4 is generally used as a starting material for the synthesis of nitrido- or oxonitridosilicates10,11,16,20,23–27,36–38 because of the intuitive expectation that starting with Si3N4 would be more advantageous to the formation of the compounds than using SiO2. However, our simulation result gives an expectation that nitrides can be synthesized with SiO2 as a starting raw material instead of Si3N4 in CRN reactions. Fig. 6 shows that Si3N4 appears at a lower temperature than any other nitride compounds even if we start with oxide raw materials, which indicates that SiO2 raw material makes thermodynamically the same results as starting with Si3N4 for CRN reactions above 1600 K. Using SiO2 has great merit over Si3N4 in terms of cost.
Sr2Si5N8 appeared on the phase diagram of CRN at 1900 K and stayed stable until 2100 K (Fig. 6c–e). Other ternary nitride compounds, SrSi6N8 and SrSiN2 also appeared in this temperature range. They were stable over a narrower temperature range than Sr2Si5N8, which implies that synthesis of SrSi6N8 and SrSiN2 requires precise control of the reaction temperature and sustenance of the reducing atmosphere during the cooling process. Above 2200 K (Fig. 6f), all the nitride phases disappeared from the phase diagram of Sr–Si–N–O system and only compounds of the Sr–Si system remained. This is because both oxygen and nitrogen chemical potentials decrease as temperature increases, resulting in no more thermodynamic preference for formation of nitride phases.
3.4. Synthesis of Sr2Si5N8
Sr2Si5N8 is attracting special attention among the compounds of the Sr–Si–N–O system as the next generation of phosphor materials for fabrication of LEDs. Based on the simulation results, it seems that Sr2Si5N8 cannot be prepared by HRN reaction. But, we expected it could be synthesized via CRN reaction even under normal pressure of N2 atmosphere between 1850 and 2150 K (Fig. 6). It was also predicted that the synthesis becomes easier with high N2 pressure, a method which is frequently used for the synthesis of nitride compounds. The simulation of N2 pressure conditions under 100 MPa showed that the lowest limit of synthesis temperature was lowered by ∼100 K and the compound remained stable up to 2300 K, indicating that the possible temperature range of synthesis is widened. The temperature range for Sr2Si5N8 synthesis under 0.1 and 100 MPa of N2 pressure is presented in the bottom of Fig. 4.Some researchers reported that impurity phases existed together with their Sr2Si5N8 compounds.11,16,20 SrSiO3 and Sr2SiO4 commonly appeared, which was exactly predicted from our calculation; we mentioned that Sr2Si5N8 could be formed by CRN reaction at 1900 K. Two types of fluctuation in this synthesis condition—decrease of temperature (Fig. 7a) and increase of O2 partial pressure (Fig. 7b)—were simulated. The phase diagrams of both cases are presented in Fig. 7.
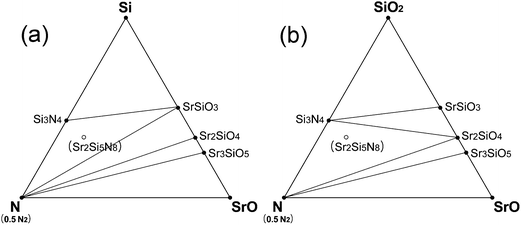 | ||
| Fig. 7 Prediction of impurity phases in the synthesis of Sr2Si5N8 phase by CRN reactions: (a) at the equilibrium CRN condition of 1800 K (pO2 = 2.512 × 10⁻¹⁸ MPa), whose temperature is not high enough for stable existence of Si2Si5N8, and (b) at 1900 K, a high enough temperature, but oxygen partial pressure is assumed to have increased to 2.397 × 10⁻¹⁷ MPa from the equilibrium pressure of 7.943 × 10⁻¹⁸ MPa for some reason. | ||
The equilibrium partial pressure and chemical potential of oxygen in CRN reaction at 1900 K are 7.943 × 10⁻¹⁸ MPa and −18.78 eV per fu, respectively, and the phase diagram simulated at this condition is given in Fig. 6c. By lowering the temperature from this condition, the Sr2Si5N8 phase becomes unstable and Si3N4 and SrSiO3 appear, as shown in Fig. 7a. That is, the SrSiO3 phase is expected to emerge by reaction (a) of the equation below with a temperature decrease. On the other hand, when oxygen partial pressure increases, while maintaining the temperature, the Sr2SiO4 phase is simulated to be generated. Fig. 7b shows the phase diagram calculated for the condition that the O2 chemical potential was increased to −18.60 eV per fu from the equilibrium value of −18.78 eV per fu in the CRN reaction at 1900 K. This change is equivalent to an increase of oxygen partial pressure to ∼2.4 × 10⁻¹⁷ MPa, from 7.943 × 10⁻¹⁸ MPa of the equilibrium partial pressure. The phase diagram of this condition shows that formation of Sr2SiO4 is thermodynamically more favorable and thus reaction (b) would be dominant with increasing oxygen partial pressure.
| Sr2Si5N8 + 3O2 = 2SrSiO3 + Si3N4 + 2N2 | (a) |
 | (b) |
From the above results, it is deduced that SrSiO3 appears as an impurity phase when the temperature is not high enough, or that it is formed during the cooling process, thus our simulation results suggest that in order to remove SrSiO3 secondary phase, Sr2Si5N8 should be synthesized at a high enough temperature and fast cooling after the synthesis seems to be desirable. Whereas, Sr2SiO4 is expected to be formed by increasing of O2 partial pressure at a high enough synthesis temperature, therefore momentary fluctuation of O2 partial pressure by leak-in of air should be avoided, and the carbon should be able to be fully oxidized so that the equilibrium atmosphere of the CRN reaction may be maintained at the given temperatures. We believe that these measures derived from the first-principles simulation of this study would be essential for synthesis of a uniform Sr2Si5N8 compound.
3.5. Application of the simulation to synthesis of Sr2Si5N8:Eu phosphor
The results so far have not considered doping of europium, but phase diagrams with Eu-doping are necessary to get information on the synthesis of Sr2Si5N8:Eu phosphor. However, DFT calculation of 4f rare earths with GGA-PBE often lacks accuracy. Moreover, to make a crystal model that contains ∼3 atom% of dopants, the size of the supercell becomes too large because it should include more than 30 Sr atoms. These limitations make it difficult to simulate phase diagrams of the Eu-doped Sr–Si–N–O system; therefore, validity of our first-principles investigation should be indirectly checked.We substituted part of the Sr atoms with Eu for the compounds that appear on the simulated phase diagrams, and calculated their energies (ESI†). Because of the constraints of supercell size, the doping amount of Eu was in the range of 6.25–12.5 atom%, much larger than that of Sr2Si5N8:Eu phosphors in practical use (about 3 atom%). The results showed that change of energy with doping was under ∼0.3%. Considering the large doping amount of Eu in our crystal models, the actual energy change with a conventional doping amount (∼3 atom%) of Eu is expected to be much smaller. With an assumption that energy change with doping is proportional to Eu-doping amount, we estimated the difference in energy between the compounds containing a practical amount of Eu (3 atom%) and those without doping, which turned out to be very small, within 0.1%.
For all the phases considered, Eu-doping changed the energy of the compounds in the same direction (all the energies decreased) and the change was very small, indicating that phase diagrams of Sr–Si–N–O system would be affected little with Eu-doping. The only exception was SrSi2, whose energy increased with doping and the amount of change was somewhat larger. Therefore, Eu-doped SrSi2, which is a little more unstable than the undoped, may not be able to exist as a stable phase in some cases. For Sr2Si5N8, it was predicted that the energy decreases by about 0.015%, and the lattice parameter change is −0.085 to −0.127% with 3 atom% of Eu-doping.
3.6. Limitation and corrections
In this section, we discuss several factors that were omitted to avoid making the simulation too complicated. First, melting of the solids was not considered. Compounds on the Sr–Si line, which are stable at elevated temperatures but have relatively low melting points,40 would appear as liquid phases. This would apply to Si (Tm = 1687 K), SrSi2 (Tm = 1393 K), and SrSi (Tm = 1468 K) in Fig. 6. Over the melting points, heats of melting should be added to the energy of the crystals and this modified energy (DFT-calculated crystal energy + melting heat) should be used for the simulation of phase diagrams. Unfortunately, the exact melting heats have not been reported, except for Si (Tm = 1687 K and ΔHm = 0.520 eV per fu).For a rough examination of the effect of melting, we assumed the melting heats of SrSi2 and SrSi to be similar to that of Si and then simulated phase diagrams of the CRN reaction (Fig. 8). Compared with Fig. 6, which did not consider melting, the phase diagrams with melting of the compounds were identical below 1800 K but showed differences at elevated temperatures. At 1900 K, SiO2 instead of Si appears stable presumably because melted Si is higher in energy than in the solid state by the heat of melting, and thus the energy of SiO2 lies between that of the solid and liquid phases of Si. At 2000–2100 K, oxide phases, such as SrSiO3, Sr2SiO4, and Sr3SiO5, were still stable on the Sr–Si line because of the increased energies of SrSi and SrSi2 with consideration of melting. Silicides appeared above 2200 K, and the ternary nitrides (SrSi6N8, Sr2Si5N8, SrSiN2) were still stable at these temperatures. Thus, by including the melting, the stability of compounds on the Sr–Si line changed. However, this change did not affect the types of secondary phases formed with change of temperature and O2 partial pressure for Sr2Si5N8 synthesis described in section 3.4.
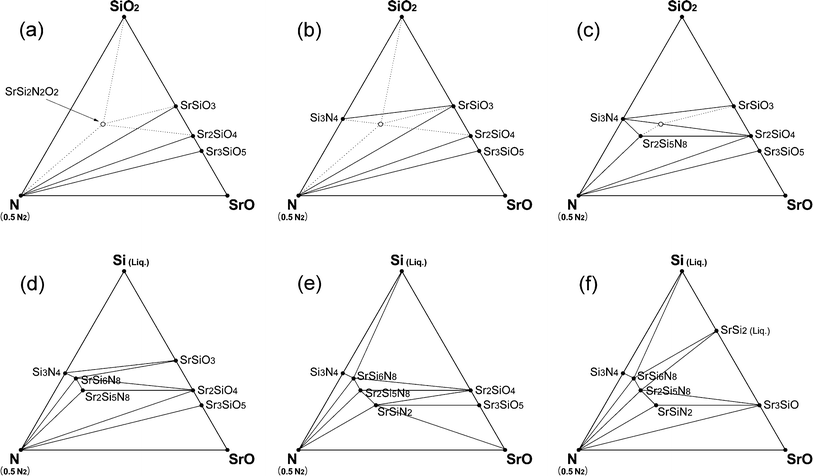 | ||
| Fig. 8 Phase diagrams of Sr–Si–N–O system simulated for CRN conditions considering melting of Sr–Si compounds. Imaginary point and lines from the simulation assuming that energy of SrSi2N2O2 is less than that of the calculated are also added as dotted lines. (a) 1400–1500 K, (b) 1600–1800 K, (c) 1900 K, (d) 2000 K, (e) 2100 K, and (f) 2200–2300 K. | ||
The SrSi2N2O2 phase also should be examined, which was not stable in our simulated phase diagrams but frequently appeared in actual experiments as is shown in the next section. This compound is attracting interest for its application as a green-yellow phosphor for LEDs, and is known to be easily synthesized if Si3N4 is used as a starting raw material even under a hydrogen atmosphere.37,43–47 However, this phase did not appear on the phase diagrams of this study. Two possible interpretations may explain this disagreement. The first hypothesis is that SrSi2N2O2 exists as a metastable phase, which appears by some kinetic reason, although it is not a thermodynamically stable phase. This interpretation seems plausible in that SrSi2N2O2 has been synthesized from Si3N4 and there is no report of synthesis with SiO2 as a Si source.
Another interpretation is the possibility of an error in the DFT calculation of energy of SrSi2N2O2. According to Oeckler et al.,38 SrSi2N2O2 belongs to the space group of P1 and there are four Sr atoms in a unit cell. Site occupancies of Sr are not one in the crystal, four Sr atoms are dispersed in eight sites—half of the sites have site occupancy of 0.8, and others have 0.2. This type of crystal is hard to calculate accurately because a large size supercell should be constructed to disperse Sr atoms in accordance with the actual distribution ratio. In addition, there are a numbers of possible configurations for placing Sr atoms at the sites and this requires determination of the minimum energy configuration as a prerequisite.
For these reasons, the structure was simplified so that in our simulations four major sites had 100% occupancy of Sr. If dispersion of Sr atoms, as in the real structure, lowers energy of the crystal, SrSi2N2O2 may be able to appear as a stable phase. We assumed that the energy of the real structure was less than that of the imaginary crystal used for the DFT calculation by ∼2.5% and simulated the phase diagrams of CRN reactions at 1500 K (Fig. 8). SrSi2N2O2 appeared as a stable phase with this modification of energy (Fig. 8a–c). The new stability lines formed with appearance of SrSi2N2O2 are shown as dotted lines in Fig. 8. If the assumption reflects the actual situation, the original lines crossing with the new dotted lines must be eliminated from the phase diagrams. This simulation implies the possibility that a dispersed distribution of Sr atoms in the real structure makes the phase more stable than the imaginary structure used for the simulation. More investigation of crystal structure and energy calculation of SrSi2N2O2 would be necessary for the exact interpretation of SrSi2N2O2:Eu phosphor synthesis.
4. Experimental results and discussion
To confirm the simulation results experimentally, we prepared a mixed powder of SiO2 and SrCO3 in the molar ratio of Sr![[thin space (1/6-em)]](https://www.rsc.org/images/entities/char_2009.gif) :
:![[thin space (1/6-em)]](https://www.rsc.org/images/entities/char_2009.gif) Si = 2
Si = 2![[thin space (1/6-em)]](https://www.rsc.org/images/entities/char_2009.gif) :
:![[thin space (1/6-em)]](https://www.rsc.org/images/entities/char_2009.gif) 5, which is the stoichiometric composition for synthesis of Sr2Si5N8, and examined the phases after firing at various conditions of atmosphere and temperature. Fig. 9a shows the XRD pattern of the powder fired at 1773 K under H2/N2 flow. The diffraction peaks were addressed to SiO2, SrSiO3, Sr2SiO4, and SrSi2N2O2 phases. This result agrees with the simulations presented in section 3.3 and the discussion of section 3.6 about SrSi2N2O2, which predicted SiO2, and SrSiO3, with or without SrSi2N2O2, may appear with HRN reactions. Detection of the Sr2SiO4 phase, which was the only disagreement, may be caused by regional nonhomogeneity of the composition with formation of SrSi2N2O2.
5, which is the stoichiometric composition for synthesis of Sr2Si5N8, and examined the phases after firing at various conditions of atmosphere and temperature. Fig. 9a shows the XRD pattern of the powder fired at 1773 K under H2/N2 flow. The diffraction peaks were addressed to SiO2, SrSiO3, Sr2SiO4, and SrSi2N2O2 phases. This result agrees with the simulations presented in section 3.3 and the discussion of section 3.6 about SrSi2N2O2, which predicted SiO2, and SrSiO3, with or without SrSi2N2O2, may appear with HRN reactions. Detection of the Sr2SiO4 phase, which was the only disagreement, may be caused by regional nonhomogeneity of the composition with formation of SrSi2N2O2.
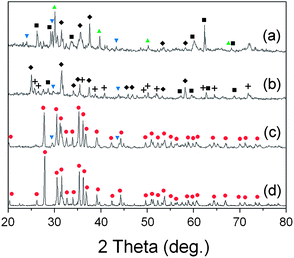 | ||
Fig. 9 XRD patterns after firing the mixed powder of SrCO3 and SiO2: (a) HRN reaction at 1773 K, (b) CRN reaction at 1673 K, (c) CRN at 1773 K, and (d) CRN at 1873 K. The raw materials were mixed in 2![[thin space (1/6-em)]](https://www.rsc.org/images/entities/char_2009.gif) : :![[thin space (1/6-em)]](https://www.rsc.org/images/entities/char_2009.gif) 5 molar ratios intending to get the Sr2Si5N8 phase. (■: SiO2, 5 molar ratios intending to get the Sr2Si5N8 phase. (■: SiO2,  : SrSiO3, : SrSiO3,  : Sr2SiO4, ✚: Si3N4, ◆: SrSi2N2O2, : Sr2SiO4, ✚: Si3N4, ◆: SrSi2N2O2,  : Sr2Si5N8). : Sr2Si5N8). | ||
Fig. 9b–d show XRD patterns of CRN reactions at 1673, 1773, and 1873 K, respectively. Diffraction peaks of SrSiO3, SrSi2N2O2, Si3N4, and SiO2 were detected with firing at 1673 K (Fig. 9b). The simulated phase diagram (Fig. 8b) predicted Si3N4 and SrSiO3 phases would appear stable for this condition because the temperature is not high enough to synthesize the nitride phase of Sr2Si5N8. Except detection of a small amount of SiO2, this remained supposedly because of partial incompletion of the reaction, the XRD pattern in Fig. 9b shows good agreement with the previous calculations.
In the CRN reaction at 1773 K (Fig. 9c) mainly Sr2Si5N8 was produced, with weak peaks from SrSiO3 and a trace of Si3N4. This seems to be an intermediate state between Fig. 8b and c and thus shows good agreement with the simulations. In the previous sections we deferred the decision whether SrSi2N2O2 is thermodynamically a stable phase or not. If it is, the broken lines in Fig. 8 would form a convex hull of stable phases, then Si3N4 and SrSi2N2O2 would appear as the main impurity phases in CRN reaction at 1773 K because the composition of powder (Sr![[thin space (1/6-em)]](https://www.rsc.org/images/entities/char_2009.gif) :
:![[thin space (1/6-em)]](https://www.rsc.org/images/entities/char_2009.gif) Si = 2
Si = 2![[thin space (1/6-em)]](https://www.rsc.org/images/entities/char_2009.gif) :
:![[thin space (1/6-em)]](https://www.rsc.org/images/entities/char_2009.gif) 5) becomes located in the area of Si3N4–SrSi2N2O2–N. However, this did not happen, rather diffraction peaks from SrSiO3 were observed in reality. Thus, SrSi2N2O2 is not supposed to be a thermodynamically stable phase in the system.
5) becomes located in the area of Si3N4–SrSi2N2O2–N. However, this did not happen, rather diffraction peaks from SrSiO3 were observed in reality. Thus, SrSi2N2O2 is not supposed to be a thermodynamically stable phase in the system.
Pure Sr2Si5N8 phase could be obtained with firing at 1873 K (Fig. 9d), agreeing with the simulation, which predicted Sr2Si5N8 stably exists on the phase diagram above 1850 K. Thus, all the experimental results of HRN and CRN reactions showed excellent agreement with the calculations with temperature errors of less than 100 K. Considering that general errors related to measurement of temperatures and deviations of temperature with positions in the furnace are dozens of K, it can be concluded that the simulation of this study provides useful information about the synthesis of Sr2Si5N8 with good accuracy.
The type of impurity phases appearing with firing conditions also supported the reliability of our simulation. It was discussed from the simulation in section 3.5 that SrSiO3 would appear as an impurity if the temperature of CRN reaction is not high enough, whereas Sr2SiO4 appears if the oxygen partial pressure is not sufficiently low even at high enough temperatures (Fig. 7). We reduced the amount of carbon for CRN reactions; the XRD patterns of the products are presented in Fig. 10. With a smaller amount of carbon, the Sr2SiO4 phase appeared mixed with Sr2Si5N8 (Fig. 10b) because of the increased oxygen pressure as predicted from the calculations. Interestingly, when we used a cracked tube of the furnace accidentally, we also obtained Sr2Si5N8 containing Sr2SiO4 impurity (Fig. 10c). The oxygen partial pressure may have increased with an inflow of outer air through the crevices. Fig. 9c shows an example of low temperature synthesis, in which SrSiO3 appeared as an impurity. All these results again support the reliability of our simulation models and method.
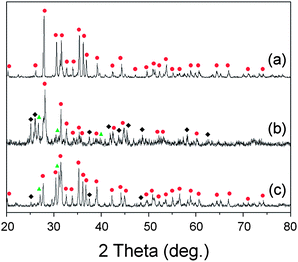 | ||
Fig. 10 XRD patterns after firing the mixed powder of SrCO3 and SiO2: (a) CRN reaction at 1873 K, (b) the same condition as (a), but with smaller amount of carbon (50% of (a)), (c) the same condition as (a), but tube of the furnace was cracked. The raw materials were mixed in Sr![[thin space (1/6-em)]](https://www.rsc.org/images/entities/char_2009.gif) : :![[thin space (1/6-em)]](https://www.rsc.org/images/entities/char_2009.gif) Si = 2 Si = 2![[thin space (1/6-em)]](https://www.rsc.org/images/entities/char_2009.gif) : :![[thin space (1/6-em)]](https://www.rsc.org/images/entities/char_2009.gif) 5 molar ratios intending to get Sr2Si5N8 phase. (■: SiO2, 5 molar ratios intending to get Sr2Si5N8 phase. (■: SiO2,  : SrSiO3, : SrSiO3,  : Sr2SiO4, ✚: Si3N4, ◆: SrSi2N2O2, : Sr2SiO4, ✚: Si3N4, ◆: SrSi2N2O2,  : Sr2Si5N8). : Sr2Si5N8). | ||
Lastly, based on the simulation results we predicted that the Sr2Si5N8:Eu phosphor could be synthesized via a CRN reaction using SiO2 as a starting material instead of Si3N4, which is conventionally used (section 3.3). The experimental results are briefly presented in Fig. 11, and the details of synthetic conditions, optical properties, and other characteristics will be reported in a separate paper. Fig. 11a and b are photos of as-sintered Sr2Si5N8:Eu powders from Si3N4 and SiO2, respectively, both of them show the typical red body color of the Sr2Si5N8:Eu phosphor. XRD patterns of products exactly matched with that of Sr2Si5N8 phase, and the photoluminescent property of a strong red emission indicated that a Sr2Si5N8:Eu phosphor of good quality was obtained (Fig. 11c). Thus, synthesis of Sr2Si5N8:Eu phosphor using SiO2 was predicted by first-principles calculations, and the possibility was confirmed through experiments. This is a good model which indicates that the simulation method of this study can be applied to nitride systems and be utilized as a useful tool for cost reduction by examining the potential application of cheap oxide raw materials.
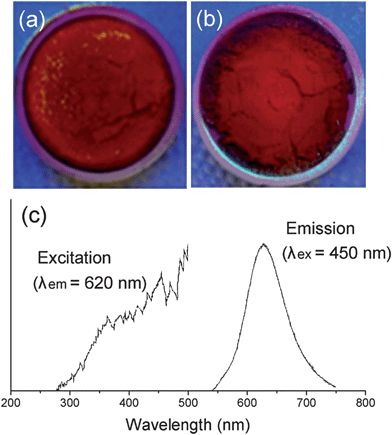 | ||
| Fig. 11 Photo images of Sr2Si5N8:Eu phosphors synthesized with Si3N4 (a) or SiO2 (b) as a raw material. The photoluminescent property of sample (b) is presented in (c). | ||
5. Conclusion
Thermodynamic stabilities and phase diagrams of Sr–Si–N–O system compounds were simulated using a first-principles method based on DFT calculations. The system includes two kinds of gas species, nitrogen and oxygen, whose chemical potentials were determined from comparison between DFT calculations and thermochemical data reported by experiments so that they agree with each other. The chemical potentials were adjusted to reflect enthalpy and entropy changes with temperature and pressure for higher accuracy of simulations. We constructed phase diagrams for HRN and CRN conditions through the simulations and predicted synthetic conditions of nitride or oxonitride compounds.The results implied that nitridosilicates appear as stable phases under CRN reaction conditions at elevated temperatures above 1800 K, while the HRN reaction is not suitable for the synthesis because of the high equilibrium partial pressure of oxygen. It was found that impurity phases appearing with Sr2Si5N8 differ with synthetic conditions: a shortfall in reaction temperature generates SrSiO3, while Sr2SiO4 appears with an increase in oxygen partial pressure. Si3N4 appeared stable at a lower temperature than any other nitrides in our simulation, raising the possibility that nitride compounds, including Sr2Si5N8:Eu phosphor, could be synthesized using SiO2 as a starting raw material instead of costly Si3N4. We examined the expectations of our simulations by experiments and confirmed that they show excellent agreement with experimental results. On this basis, we succeeded in synthesizing the Sr2Si5N8:Eu phosphor for the first time using all oxide raw materials under normal pressure.
Thus, this study successfully provides a systematic thermodynamic interpretation of the Sr–Si–N–O system in which nitridation and oxidation reactions are involved complicatedly. These can be useful guidelines for the synthesis of compounds of this system. We expect that the first-principles methodology for a two-gas system established in our investigation may be effectively applied to other multi-gas systems.
Acknowledgements
This work was supported by INHA UNIVERSITY Research Grant (INHA-2012). We also acknowledge the use of facilities at the Research Institute of Advanced Materials in Seoul National University and the Suncheon Center of the Korea Basic Science Institute.References
- W. Schnick and H. Huppertz, Chem.–Eur. J., 1997, 3, 679 CrossRef CAS.
- A. Rosenflanz, Curr. Opin. Solid State Mater. Sci., 1999, 4, 453 CrossRef.
- W. Schnick, Int. J. Inorg. Mater., 2001, 3, 1267 CrossRef CAS.
- G. Petzow and M. Herrmann, Struct. Bonding, 2002, 102, 47 CrossRef CAS.
- D. Peters, E. Paulus and H. Jacobs, Z. Anorg. Allg. Chem., 1990, 584, 129 CrossRef CAS.
- T. Schlieper and W. Schnick, Z. Anorg. Allg. Chem., 1995, 621, 1535 CrossRef CAS.
- T. Schlieper and W. Schnick, Z. Kristallogr., 1996, 211, 254 CrossRef CAS.
- M. Woike and W. Jeitschko, Inorg. Chem., 1995, 34, 5105 CrossRef CAS.
- H. Huppertz and W. Schnick, Angew. Chem., Int. Ed. Engl., 1996, 35, 1983 CrossRef CAS.
- Z. Gál, P. Mallinson, H. Orchard and S. Clarke, Inorg. Chem., 2004, 43, 3998 CrossRef.
- R. Xie, N. Hirosaki, T. Suehiro, F. Xu and M. Mitomo, Chem. Mater., 2006, 18, 5578 CrossRef CAS.
- G. Blasse and B. Grabmaier, Luminescent Materials, Springer, Berlin, Germany, 1994, Ch. 2 Search PubMed.
- R. Xie, M. Mitomo, K. Uheda, F. Xu and Y. Akimune, J. Am. Ceram. Soc., 2002, 85, 1229 CrossRef CAS.
- R. Xie, N. Hirosaki, M. Mitomo, Y. Yamamoto, T. Suehiro and K. Sakuma, J. Phys. Chem. B, 2004, 108, 12027 CrossRef CAS.
- N. Hirosaki, R. Xie, K. Kimoto, T. Sekiguchi, Y. Yamamoto, T. Suehiro and M. Mitomo, Appl. Phys. Lett., 2005, 86, 211905 CrossRef.
- Y. Li, G. de With and H. Hintzen, J. Lumin., 2006, 116, 107 CrossRef CAS.
- Y. Li, G. de With and H. Hintzen, J. Mater. Chem., 2005, 15, 4492 RSC.
- K. Uheda, N. Hirosaki, Y. Yamamoto, A. Naoto, T. Nakajima and H. Yamamoto, Electrochem. Solid-State Lett., 2006, 9, H22 CrossRef CAS.
- R. Mueller-Mach, G. Mueller, M. Krames, H. Höppe, F. Stadler, W. Schinick, T. Juestel and P. Schmidt, Phys. Status Solidi A, 2005, 202, 1727 CrossRef CAS.
- X. Piao, T. Horikawa, H. Hanzawa and K. Machida, Appl. Phys. Lett., 2006, 88, 161908 CrossRef.
- J. Kechele, O. Oeckler, F. Stadler and W. Schnick, Solid State Sci., 2009, 11, 537 CrossRef CAS.
- H. Höppe, H. Lutz, P. Morys, W. Schnick and A. Seimeier, J. Phys. Chem. Solids, 2000, 61, 2001 CrossRef.
- T. Schlieper, W. Milius and W. Schnick, Z. Anorg. Allg. Chem., 1995, 621, 1380 CrossRef CAS.
- F. Stadler and W. Schnick, Z. Anorg. Allg. Chem., 2007, 633, 589 CrossRef CAS.
- F. Stadler, R. Kraut, O. Oeckler, S. Schmid and W. Schnick, Z. Anorg. Allg. Chem., 2005, 631, 1773 CrossRef CAS.
- F. Stadler, O. Oeckler, J. Senker, H. Höppe, P. Kroll and W. Schnick, Angew. Chem., Int. Ed., 2005, 44, 567 CrossRef CAS.
- G. Pilet, H. Höppe, W. Schnick and S. Esmaeilzadeh, Solid State Sci., 2005, 7, 391 CrossRef CAS.
- L. Wang, T. Maxisch and G. Ceder, Chem. Mater., 2007, 19, 543 CrossRef CAS.
- S. Ong, W. Wang, B. Kang and G. Ceder, Chem. Mater., 2008, 20, 1798 CrossRef CAS.
- M. Chase, JANAF Thermochemical Tables, American Chemical Society, New York, 1986 Search PubMed.
- C. Barber, D. Dobkin and H. Huhdanpaa, ACM Trans. Math. Software, 1996, 22, 469 CrossRef.
- G. Kresse and D. Joubert, Phys. Rev. B: Condens. Matter Mater. Phys., 1999, 59, 1758 CrossRef CAS.
- G. Kresse and J. Furthmuller, Phys. Rev. B: Condens. Matter, 1996, 54, 11169 CrossRef CAS.
- J. P. Perdew, K. Burke and M. Ernzerhof, Phys. Rev. Lett., 1996, 77, 3865 CrossRef CAS.
- Inorganic Crystal Structure Database, http://icsd.kisti.re.kr/, accessed December 2009.
- H. Kojitani, M. Kido and M. Akaogi, Phys. Chem. Miner., 2005, 32, 290 CrossRef CAS.
- S. Römer, T. Dörfler, P. Kroll and W. Schnick, Phys. Status Solidi B, 2009, 246, 1604 CrossRef.
- O. Oeckler, F. Stadler, T. Rosenthal and W. Schnick, Solid State Sci., 2007, 9, 205 CrossRef CAS.
- L. Wang, T. Maxisch and G. Ceder, Phys. Rev. B: Condens. Matter Mater. Phys., 2006, 73, 195107 CrossRef.
- A. Palenzona and M. Pani, J. Alloys Compd., 2004, 373, 214 CrossRef CAS.
- M. Chaudhuri, R. Dey, M. Mitra, G. Das and S. Mukherjee, Sci. Technol. Adv. Mater., 2008, 9, 015002 CrossRef.
- H. Ellingham, J. Soc. Chem. Ind., 1944, 63, 125 CrossRef CAS.
- M. Alcalá, J. Criado, F. Gotor and C. Real, J. Mater. Sci., 2006, 41, 1933 CrossRef.
- G. Li, X. Li, H. Wang and Z. Li, Appl. Phys. A: Mater. Sci. Process., 2008, 93, 471 CrossRef CAS.
- Y. Li, A. Delsing, G. de Wirth and H. Hintzen, Chem. Mater., 2005, 17, 3242 CrossRef CAS.
- F. Stadler, O. Oeckler, H. Höppe, M. Möller, R. Pöttgen, B. Mosel, P. Schmidt, V. Duppel, A. Simon and W. Schnick, Chem.–Eur. J., 2006, 12, 6984 CrossRef CAS.
- X. Song, R. Fu, S. Agathopoulos, H. He, X. Zhao and R. Li, J. Electrochem. Soc., 2010, 157, J34 CrossRef CAS.
Footnote |
| † Electronic supplementary information (ESI) available. See DOI: 10.1039/c2tc00223j |
| This journal is © The Royal Society of Chemistry 2013 |


