Coupling liquid chromatography/mass spectrometry detection with microfluidic droplet array for label-free enzyme inhibition assay†
Xiu-Li
Wang‡
a,
Ying
Zhu‡
a and
Qun
Fang
*ab
aInstitute of Microanalytical Systems, Department of Chemistry, Zhejiang University, Hangzhou, 310058, China. E-mail: fangqun@zju.edu.cn; Fax: +86-571-88273572; Tel: +86-571-88206771
bKey Laboratory for Biomedical Engineering of Ministry of Education of China, Zhejiang University, Hangzhou, 310027, China
First published on 15th October 2013
Abstract
In this work, the combination of droplet-based microfluidics with liquid chromatography/mass spectrometry (LC/MS) was achieved, for providing a fast separation and high-information-content detection method for the analysis of nanoliter-scale droplets with complex compositions. A novel interface method was developed using an oil-covered droplet array chip to couple with an LC/MS system via a capillary sampling probe and a 4 nL injection valve without the need of a droplet extraction device. The present system can perform multistep operations including parallel enzyme inhibition reactions in nanoliter droplets, 4 nL sample injection, fast separation with capillary LC, and label-free detection with ESI-MS, and has significant flexibility in the accurate addressing and sampling of droplets of interest on demand. The system performance was evaluated using angiotensin I and angiotensin II as model samples, and the repeatabilities of peak area for angiotensin I and angiotensin II were 2.7% and 7.5% (RSD, n = 4), respectively. The present system was further applied to the screening for inhibitors of cytochrome P450 (CYP1A2) and measurement of the IC50 value of the inhibitor. The sample consumption for each droplet assay was 100 nL, which is reduced 10–100 times compared with conventional 384-multi-well plate systems usually used in high-throughput drug screening.
Introduction
Liquid chromatography/mass spectrometry (LC/MS) is a powerful chemical analysis technique that combines the high-resolution separation capability of LC with the molecular structure analysis capability of MS. With the advantages of high sensitivity, reproducibility, and versatility in dealing with various samples, LC/MS has been widely used, enabling new discoveries in many research fields, including proteomics,1 metabolomics,2 drug development,3 and pharmacokinetics.4Recently, there has been a growing trend for using capillary LC with small-diameter columns and low flow rates of the mobile phase before MS identification.5–8 The small-diameter capillary columns can reduce the sample injection volumes, generate less waste of solvents and reagents, and increase the separation efficiency. The low flow rate of the mobile phase can significantly enhance the ionization efficiency of electrospray ionization mass spectrometry (ESI-MS), resulting in the high sensitivity of LC/MS analysis. These features are especially beneficial for many biological studies where only limited amounts of samples are available.9–12 For example, more recently, Li's group9 described a capillary-LC/MS-based analysis platform for protein identification from samples containing only 500 circulating tumor cells (CTCs) isolated from human blood. However, despite the advantage of capillary-LC/MS in the analysis of small-amount samples with nanoliter-scale sample injection volumes, the sample pretreatment operations prior to LC/MS analysis usually require relatively large volumes of samples and reagents in the range of microliters to milliliters.13
Droplet-based microfluidics has become a promising platform for miniaturized chemical and biological reactions and assays with picoliter- to nanoliter-scale volumes. Surrounding the droplet with immiscible oil can reduce evaporation, eliminate dispersion and dilution, accelerate mass and heat transfer, and provide a biocompatible microenvironment.14,15 Droplet-based systems have been successfully demonstrated in enzyme inhibition assay,16 single-cell analysis,17 and protein crystallization screening.18 Various analytical techniques have also been developed to measure the chemical contents in small-volume droplets, including microscopic imaging,19 laser induce fluorescence,20 electrochemical detection,21 capillary electrophoresis,22–25 and mass spectrometry.26–31 However, the ability to analyze the droplets especially with complicated compositions remains challenging, which limits the broad applicability of droplet-based microfluidics.
ESI-MS has been well demonstrated as a rapid, sensitive, label-free and high-information-content detection technique for droplet analysis.26–31 It allows the direct quantification of substrate and product in an in-droplet enzyme reaction without the need for fluorescent or chromogenic labeling, and enables enzyme reactions with native biological substrates to be performed in more in vivo-like modes. To eliminate the influence of oil on ESI-MS detection, droplets are commonly required to be extracted from segmented phase to aqueous phase with an electrical pulse,26 an array of cylindrical posts,13 or a selectively hydrophilic/hydrophobic patterned microchannel.27 Preloaded droplets in a capillary, a nanowell chip, or a digital microfluidic device can be directly coupled with ESI-MS using a nanospray emitter driven by syringe pumps28,29 or an electrical field.30,31 In most of the above-mentioned droplet systems, water-soluble organic solvents and volatile buffers are usually required in the sample droplets for compatibility with MS detection. However, in real-world applications, to maintain biomolecular activities, biochemical assays are commonly carried out in complicated matrices containing high-concentration non-volatile salts and additives, which could significantly suppress the signals of the analytes in MS analysis and also contaminate the MS instrument. Capillary LC/MS would be an ideal and versatile sample purification, separation and detection method for droplet systems. In an LC/MS system, the sample matrix can be easily separated from the analytes of interest with liquid chromatography and the whole analysis process can be automatically carried out with an autoinjector. The combination of LC/MS detection with droplet analysis will significantly extend the scopes of application of droplet-based microfluidics, especially for droplet samples with complicated compositions.
In this work, the combination of a droplet-based microfluidic system and capillary LC/MS was achieved using a capillary sampling probe to interface the injection valve of the LC/MS system with an oil-covered droplet array built on the basis of our previously reported sequential operation droplet array (SODA) system.32 Multiple parallel reactions for multiple different samples were performed in the droplet array, and the sampling for droplets was conveniently carried out by directly inserting the sampling probe connected with the nanoliter injection valve into the droplet of interest through the cover oil and load the droplet solution to the injection valve. The sample consumption for each LC/MS analysis cycle was 100 nL and the volumes of droplet reactions were in the range of 100–600 nL. To demonstrate its ability in the label-free analysis of real biological samples, the present system was applied in cytochrome P450 inhibition assays.33
Experimental
Fabrication of nanowells array chip
A 7 × 7 nanowell array was fabricated using a drill on a 2 × 2 × 0.2 cm (length × width × height) glass plate. For chips with shallow nanowells, the dimension of each nanowell was 1.0 mm in depth and 1.0 mm in diameter. The distance between the centers of two adjacent wells was 2.0 mm. For chips with deep wells, the dimension of each well was 1.6 mm in depth and 1.1 mm in diameter, and the distance between the centers of two adjacent wells was 2.2 mm. For chips with deep wells, an individual oil cover was used for each wall, and thus a two-step method was used to perform selective surface modification for the wells. Before the treatment, the chip surface was activated with 1 M sodium hydroxide solution for 10 min and rinsed to neutral pH with deionized water. After drying in an oven at 120 °C for 1 h, the surface of the microchip was modified with 0.5% (v/v) octadecyl-trichlorosilane (OTCS) in isooctane for 15 min to obtain a hydrophobic surface. The microchip was sequentially washed with isooctane for 5 min, ethanol for 5 min, deionized water for 5 min, and ethanol for 5 min, then dried at 60 °C for 1 h. The second-step modification was performed to treat the surface of the bottom region of each well to be hydrophilic, by adding 0.6 μL of 5 M sodium hydroxide solution into each well for 30 min at room temperature to remove the silanized layer. Finally, the microchip was washed with deionized water for 5 min and ethanol for 5 min, and dried at 60 °C for 1 h.Fabrication of monolithic column
An in situ thermal initiated polymerization method34 was utilized to fabricate the monolithic column in a fused silica capillary (100 μm i.d., 375 μm o.d.). Prior to the polymerization, the inner wall of the capillary was sequentially treated by 0.1 M sodium hydroxide for 30 min, deionized water for 5 min, 0.1 M HCl for 30 min, deionized water for 5 min, and acetone for 5 min. After drying with N2 for 6 h, the capillary was filled with a solution of 30% (v/v) 3-(trimethoxysilyl)propyl methacrylate in acetone and sealed with rubber, and then allowed to react for 12 h in a water bath set at 45 °C. Following this pretreatment, the vinylized capillary wall was washed with acetone and dried with N2 for 6 h. A solution for polymerization reaction containing 74 μL lauryl methacrylate (LMA), 41 μL ethylene glycol dimethacrylate (EDMA), 100 μL 1-propanol, 80 μL 1,4-butanediol, and 1.0 mg 2,2′-azobisisobutyronitrile (AIBN) was first sonicated for 20 min to degas and obtain a homogeneous solution. After the capillary was filled with the polymerization solution and sealed with plastic plugs, it was immersed in a water bath set at 60 °C for 6 h. Finally, the capillary was washed with acetone to remove unreacted monomer and porogenic solvent.Setup of the system
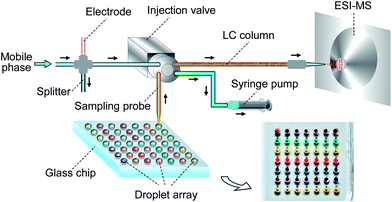
The droplet array-HPLC/MS system consisted of a SODA system with a nanowell array chip, a capillary-based HPLC system and an ion trap mass spectrometer (LCQ DECA XP, Thermo-Fisher, Waltham, USA). The SODA system was composed of a tapered capillary, a syringe pump and nanowell array chip. The microchip and a 384-well plate for containing samples and reagents were fixed horizontally on an x–y–z translation stage (Daheng New Epoch Technology Co., Beijing, China) under the control of a computer program. The capillary-based HPLC system consisted of two HPLC pumps (LC-20AD, Shimadzu Co., Kyoto, Japan) for mobile phase driving, a 4 nL four-port injection valve (Valco Instruments Co., Houston, USA), and a 6 cm-long home-made monolithic column for chromatographic separation. A 2.5 cm-long fused-silica capillary (50 μm i.d., 375 μm o.d., Reafine Chromatography Co., Yongnian, China) with a tapered tip (40 μm i.d., 300 μm o.d.) was connected to the inlet port of the valve and used as a sampling probe. A syringe pump (PHD2000, Harvard Apparatus, Holliston, USA) was connected to the outlet port of the valve for aspirating the droplet sample solution into the valve. The relative position between the droplet and the sampling probe inlet was adjusted with the x–y–z stage. A 17 mm fused-silica capillary (75 μm i.d., 375 μm o.d.) with a tapered tip (∼20 μm i.d.) was used as the MS emitter, which was connected to the outlet of the capillary column via a microcross. The capillary emitter was fixed on a stage at a distance of 2 mm from the tip end to the MS inlet orifice. The electrical contact for the capillary emitter with a high-voltage source was achieved using a stainless-steel tubing connected to the microcross. The effluent from the LC pumps was split pre-column to obtain a flow rate of 400 nL min−1 for chromatographic separation and ESI-MS detection (Fig. 1). The MS instrument was operated in ‘Tune Plus’ view and automatically tuned in all ESI-MS experiments. The enzyme reaction products and internal standard were ionized in the ESI interface in positive ion mode and detected using selective reaction monitoring mode (SRM). The SRM detection channels for the product acetaminophen and internal standard chlorpropamide were m/z 152→110 and 276.5→191.7, and the corresponding collision energies were 31% and 25%, respectively.Procedure
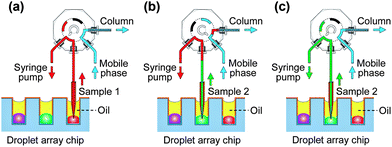
Droplets in the nanowell array chip were generated using the SODA system. Before droplet generation, for chips with shallow nanowells, the mineral oil was added into the Petri dish; for chips with deep wells, cover oil was added to each well individually without the use of bulk oil to cover the whole droplet array. Then the nanowells on the chip were deposited sequentially with 134 nL of human liver microsomes and an NADPH-generating system, 134 nL of test compounds, 134 nL of phenacetin, and 200 nL of chlorpropamide solutions respectively, to form a 2D droplet array for the enzyme inhibition assay. The sample loading in valve was performed by moving the x–y–z stage to switch the target droplet in a nanowell to the sampling probe, and allowing the sampling probe to insert the droplet through the cover oil and aspirate a definite volume of the sample solution into the 4 nL sampling loop of the valve with the syringe pump (Fig. 2a). Then, the 4 nL sample solution was injected into the LC monolithic column for chromatographic separation and MS detection (Fig. 2b). The sample changing was conducted by moving the x–y–z stage to switch the next sample droplet to the sampling probe for the loading and injection of the new sample (Fig. 2b and 2c). Fig. S1† shows the setup of the droplet array–LC/MS system.For the droplet-based enzyme inhibition assay, 268 nL of droplets containing 0.75 mg mL−1 human liver microsomes, the NADPH generating system (4.95 mM glucose-6-phosphate, 1.95 mM of NADP+, 4.95 mM magnesium chloride, and 0.6 U mL−1 glucose-6-phosphate dehydrogenase), and test compounds with different concentrations were generated, respectively. The droplet array chip was first incubated for 15 min at 37 °C. Then, 134 nL of 300 μM phenacetin solution was added to each droplet, and the droplet array chip was allowed to react for 1 h set at 37 °C. Finally, the reactions in the droplets were quenched by adding 200 nL of 50% ice-cold acetonitrile solution containing 20 μM chlorpropamide to each droplet. The enzyme inhibition assay was based on the inhibition of CYP1A2 with inhibitor, impeding the conversion of the substrate phenacetin to acetaminophen.
Result and discussion
System design
Our objective was to develop a flexible and robust interface for a droplet array chip and LC/MS for achieving separation and analysis of different samples with complicated compositions. In most of the reported droplet-based microfluidic systems, droplets were transferred and manipulated in closed chip channels under continuous flow mode. With such a closed mode, it is difficult to achieve on-demand sample injection in an LC system for target droplets of different samples, since it will need a complicated droplet indexing and control system to identify, catch and deliver the definite droplet from a number of continuously-flowing droplets into the LC injection valve.We have developed a two-dimensional oil-covered droplet array system with ESI-MS detection, and successfully applied it in complex sample pretreatment and multiple sample analysis.30 A novel interfacing method was proposed for coupling the semi-closed droplet array chip with ESI-MS detection using a capillary probe and off-line sampling mode. In the present work, on the basis of this method, we built the sample introduction system to couple LC/MS with the droplet array, which consisted of a 2.5 cm-long capillary with a tapered tip as a sampling probe, a 4 nL injection valve, and a syringe pump. Benefiting from the semi-closed property of the droplet array system, the sample injection for LC was simply achieved by directly immersing the sampling probe in the droplet through the cover oil and aspirating the droplet solution into the valve sampling loop with the syringe pump without the need for a droplet extraction operation. The sample changing could also be conveniently conducted by moving the microchip.
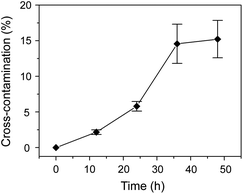
In a typical 2D droplet array chip, the whole chip is usually covered by bulk oil to eliminate liquid evaporation and sample diffusion in droplets. However, this may lead to the risk of cross-contamination between adjacent droplets due to the dissolution of some in-droplet components in the oil. We tested the carryover between sample droplets of 10 mM acetaminophen in 30% acetonitrile solution and adjacent blank droplets of 30% acetonitrile solution. The blank droplets were analyzed with the ESI-MS instrument at times of 0, 12, 24, 36, and 48 h. Evident carryovers of acetaminophen were observed (Fig. 3) in the blank droplets after 10 h. In the following experiments, an individual oil-covering method was utilized to completely eliminate the potential cross-contamination between the droplets. With this method, deep nanowells were used in the droplet array chip, and individual cover oil was added to each well without the oil mixing between different nanowells.
We also tested the performance of the deep nanowells with different well surface properties including hydrophilic, hydrophobic and hydrophilic/hydrophobic surfaces. With the hydrophilic-surface nanowells, the hydrophilic nanowell surface has a relatively low wettability to the cover oil which may result in incomplete enclosing of the aqueous droplet in the nanowell. With the hydrophobic-surface nanowells, the droplet was enclosed by oil with a shape approximate to a sphere, which resulted in the difficulty in droplet sampling owing to the droplet deforming or sliding when the capillary probe was inserted into the nanowell for sampling. Therefore, we used the selective modification method to produce nanowells with the upper hydrophobic surface compatible with the cover oil and the lower hydrophilic surface for holding and catching the aqueous droplet. With such a measure, not only is the droplet evaporation effectively eliminated (no evident evaporation in 8 h at 37 °C), but also the sampling operation from the nanoliter-scale droplet can be performed reliably.
Performance of the system
We first tested the sample loading volume required by the injection valve using a 5 μM fluorescein solution as a model sample with a sample aspirating flow rate of 150 nL min−1 (Fig. S2†). The fluorescein peak height increased with the loading volume in the range of 50–200 nL, and reached a steady state for 200–1500 nL.Since the dead volume of the capillary sampling probe (2.5 cm long, 50 μm i.d.) connected with the injection valve was 50 nL, a relatively larger sample solution was required to be aspirated into the capillary to wash the previously-remaining sample, compared with the small injection volume of 4 nL of the valve. In the following experiments, a sample loading volume of 100 nL was chosen for reducing the sample consumption, which could reach 94% of the peak height of the steady level. We also performed a preliminary experiment to further reduce the sample consumption in the sample loading process using the air-bubble segmented flow method. By using an air plug to replace part of the sample solution during the sample loading process, the sample loading volume could be reduced from 100 to 50 nL at a aspirating flow rate of 150 nL min−1. When a 5 μM fluorescein solution was used as the model sample, the fluorescein peak height increased with the loading volume of 50 nL reaching 93% of that with a 100 nL loading volume.
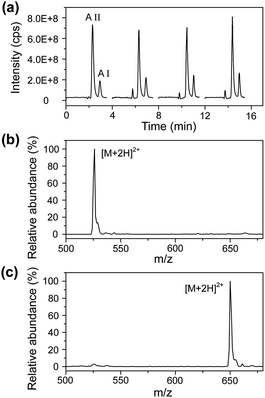
Under the optimized conditions, a mixture solution of angiotensin I and angiotensin II was used as the model sample to evaluate the performance of the LC/MS-based droplet analysis system with an aspirating flow rate of 150 nL min−1 and a sample loading volume of 100 nL (see Fig. 4). Angiotensin I and angiotensin II were separated within 3.3 min using an elution program of 5 min linear gradient of 10–30% acetonitrile (0.1% formic acid, v/v) at a mobile phase flow rate of 400 nL min−1. The repeatabilities of the retention time and peak area for angiotensin I were 2.8% and 2.7% (RSD, n = 4), and 1.5% and 7.5% for angiotensin II (RSD, n = 4), respectively. These analysis performances are comparable to those reported in other LC/MS systems,35 demonstrating the successful sample injection and separation for droplet samples.
Enzyme inhibition assay
The enzyme inhibition assay plays an essential role in high-throughput drug screening, with numerous different samples needing to be assayed. Droplet-based microfluidic systems provide attractive platforms for performing enzyme inhibition assays due to their advantages of low sample/reagent consumption and being dilution-free.14 Although the enzyme inhibition assay has been demonstrated in droplet-based systems,20,36 coupling LC/MS with a droplet-based system has still not been achieved.Cytochrome P450 enzymes are the major enzymes involved in drug metabolism, accounting for about 75% of the currently marketed therapeutics.37 CYP1A2 is one of the major metabolizing enzymes expressed in the liver, and constitutes approximately 15% of the total microsomal P450 content in human liver. Phenacetin O-deethylation is one of the recommended probe reactions for detecting CYP1A2-based drug interaction potential in vitro. We applied the present system in the CYP1A2 inhibition assay to demonstrate its potential feasibility for low-consumption drug screening.
First, we analyzed the enzyme reaction solutions in droplets after incubation with the LC/MS system, which contained 0.1 M potassium phosphate buffer, 0.5 mg mL−1 human liver microsomes, NADPH generation system, 100 μM substrate phenacetin for CYP1A2, and 6.7 μM chlorpropamide (Fig. 5a). The measurement for one droplet sample including sample injection, analyte separation, sample matrix modification, and ESI-MS detection was achieved within 8 min (Fig. 5a). In the LC separation, isocratic elution mode with 40% acetonitrile (0.1% formic acid, v/v) mobile phase was used instead of the gradient mode as the previous experiment, since the gradient mode required a 6 min re-equilibration period before the separation for a new sample, which would significantly reduce the throughput of the present system in multiple sample analysis.
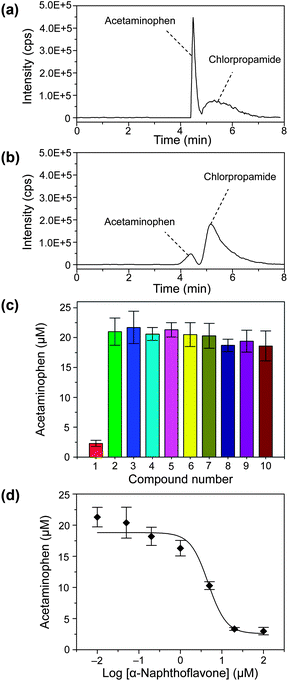 | ||
| Fig. 5 SRM chromatograms of quenched enzyme assay mixtures without (a) and with (b) 20 μM of inhibitor α-naphthoflavone. (c) Screening of enzyme inhibitor for CYP1A2 from 9 compounds. Compounds: concentration, 20 μM; (1) α-naphthoflavone; (2) negative control; (3) sulfameter; (4) quercetin; (5) erythromycin; (6) miconzole; (7) cimetidime; (8) chlorpheniramine; (9) quinidine; (10) reserpine; each compound was measured in triplicate. (d) Inhibition curve of inhibitor α-naphthoflavone for CYP1A2 for the concentrations of 0.01, 0.05, 0.2, 1, 5, 20, and 100 μM. Conditions: enzyme, 0.5 mg mL−1 human liver microsomes; substrate, 100 μM phenacetin; the SRM detection channels chlorpropamide was m/z 276.5→191.7. Other conditions as in Fig. 3. | ||
We also perform a comparison experiment using the same sample by directly introducing a 20 μM acetaminophen solution with an enzyme reaction matrix and acetonitrile (60/40, v/v) to the ESI-MS instrument via the LC system and a pulled capillary emitter without the LC separation. As shown in Fig. 6, compared with the high signal intensity of acetaminophen obtained with the LC/MS system, no evident acetaminophen signal is observed in the results of MS analysis without the LC separation. This is because the CYP1A2 reaction requires the addition of a buffer solution for pH adjustment with a potassium phosphate concentration of 100 mM. The existence of a high-concentration non-volatile salt in the sample will significantly depress the ionization of the analytes during the electrospray process.38 This result demonstrated the effectiveness of the LC separation in matrix modification of complex droplet samples since the analytes in the droplets were separated from the salts by the LC system. The enzyme inhibition assay and enzyme inhibitor screening require the quantitative determination of products of enzymatic reactions. An internal standard, chlorpropamide, was added to the sample droplets.39 A calibration curve was measured with an acetaminophen concentration ranging from 0.5 to 100 μM and a fixed chlorpropamide concentration of 6.7 μM. The acetaminophen concentration range was chosen on the basis of the amount of acetaminophen formed during the in-droplet enzymatic reaction. A good linear relationship between the relative peak area and acetaminophen concentration was obtained with a correlation coefficient r2 = 0.9948. Without the calibration of the internal standard, the correlation coefficient (r2) was 0.8825.
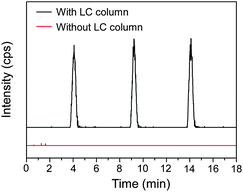 | ||
| Fig. 6 SRM chromatograms of acetaminophen standard in the enzyme reaction matrix with and without LC separation. Conditions as in Fig. 3. | ||
This droplet array–HPLC/MS system was used in the enzyme inhibitor screening for CYP1A2 from 9 compounds, including α-naphthoflavone, sulfameter, quercetin, erythromycin, miconzole, cimetidime, chlorpheniramine, quinidine, and reserpine. The total analysis time for one droplet sample was 8 min including sample injection, analyte separation, sample matrix modification, and ESI-MS detection. As shown in Fig. 5c, α-naphthoflavone shows strong inhibition on CYP1A2, and other compounds show no evident inhibition effects. These results are consistent with those of previously-reported multi-well plate-based CYP1A2 inhibition screening systems.40–42Fig. 5a and 5b show typical SRM chromatograms of in-droplet enzymatic reaction mixtures without and with the inhibitor α-naphthoflavone, respectively. The acetaminophen peak area is significantly reduced after the addition of α-naphthoflavone. The Z value for α-naphthoflavone is 0.55, which shows the good reliability of the present system.43
We also measured the inhibition curve of α-naphthoflavone to CYP1A2 using the present droplet–LC/MS system and droplets with different α-naphthoflavone concentrations of 0, 0.01, 0.05, 0.2, 1, 5, 20, and 100 μM (Fig. 5d). The half-maximal inhibitory concentration (IC50) of α-naphthoflavone deduced from the inhibition curve is 4.67 μM. The sample and reagent consumptions for each measurement were significantly reduced from the microliter scale to several hundred nanoliters.
Conclusions
In the present work, the combination of droplet-based microfluidics and the LC/MS detection technique for the fast analysis of multiple samples was achieved for the first time using a droplet array system and off-line interfacing mode.28,30,44 The use of the semi-closed oil-covered 2D droplet array under the off-line mode evidently facilitates the accurate droplet indexing, parallel in-droplet reactions, and on-demand droplet sampling without the need of droplet extraction interface. Furthermore, this interfacing method for the droplet system and LC/MS can flexibly adjust the in-droplet reaction time, droplet sampling sequence, and LC/MS separation and detection speed, to match the requirement of multiple sample analysis. The successful application in the screening for inhibitors of CYP1A2 preliminarily demonstrated its potential in low-consumption drug screening. In addition to the low-consumption screening, the present system also has the potential to be used as a pretreatment platform for micro amounts of samples before LC/MS analysis.Droplet systems have proved to be promising interfaces for coupling two separation systems, since they can use segmented flow to store nanoliter-scale fractions eluted from the first separation system, and then introduce the droplet samples to the second separation system.25,44,45 Compared with these systems under continuous flow mode, the present system using the semi-closed 2D droplet array under the off-line interfacing mode is more convenient for performing droplet indexing, reaction, pretreatment and on-demand sampling, as well as coordinating the difference in separation speed between different separation systems. Thus, it may have the potential to be developed into a versatile method for connecting different separation systems in the multi-dimensional separation of complicated samples, such as those in proteomics or metabolomics researches.
Acknowledgements
Financial supports from Natural Science Foundation of China (Grants 20825517, 21105089, and 21227007) and Major National Science and Technology Programs (Grant 2013ZX09507005) are gratefully acknowledged.References
- A. J. Link, J. Eng, D. M. Schieltz, E. Carmack, G. J. Mize, D. R. Morris, B. M. Garvik and J. R. Yates, Nat. Biotechnol., 1999, 17, 676–682 CrossRef CAS PubMed.
- U. Lutz, R. W. Lutz and W. K. Lutz, Anal. Chem., 2006, 78, 4564–4571 CrossRef CAS PubMed.
- Y. Choi, K. Jermihov, S. J. Nam, M. Sturdy, K. Maloney, X. Qiu, L. R. Chadwick, M. Main, S. N. Chen, A. D. Mesecar, N. R. Farnsworth, G. F. Pauli, W. Fenical, J. M. Pezzuto and R. B. van Breemen, Anal. Chem., 2011, 83, 1048–1052 CrossRef CAS PubMed.
- X. C. S. Tong, J. Y. Wang, S. Zheng, J. V. Pivnichny, P. R. Griffin, X. L. Shen, M. Donnelly, K. Vakerich, C. Nunes and J. Fenyk-Melody, Anal. Chem., 2002, 74, 6305–6313 CrossRef CAS.
- J. Xie, Y. Miao, J. Shih, Y. C. Tai and T. D. Lee, Anal. Chem., 2005, 77, 6947–6953 CrossRef CAS PubMed.
- K. B. Tomer, M. A. Moseley, L. J. Deterding and C. E. Parker, Mass Spectrom. Rev., 1994, 13, 431–457 CrossRef CAS.
- S. Sauer, B. M. H. Lange, J. Gobom, L. Nyarsik, H. Seitz and H. Lehrach, Nat. Rev. Genet., 2005, 6, 465–476 CrossRef CAS PubMed.
- G. Desmet and S. Eeltink, Anal. Chem., 2013, 85, 543–556 CrossRef CAS PubMed.
- N. Wang, M. Xu, P. Wang and L. Li, Anal. Chem., 2010, 82, 2262–2271 CrossRef CAS PubMed.
- P. Mao, R. Gomez-Sjoberg and D. Wang, Anal. Chem., 2013, 85, 816–819 CrossRef CAS PubMed.
- A. Holste, A. Tholey, C. W. Hung and D. Schaumloffel, Anal. Chem., 2013, 85, 3064–3070 CrossRef CAS PubMed.
- W. Ni, J. Bones and B. L. Karger, Anal. Chem., 2013, 85, 3127–3135 CrossRef CAS PubMed.
- R. T. Kelly, J. S. Page, I. Marginean, K. Q. Tang and R. D. Smith, Angew. Chem., Int. Ed., 2009, 48, 6832–6835 CrossRef CAS PubMed.
- H. Song, D. L. Chen and R. F. Ismagilov, Angew. Chem., Int. Ed., 2006, 45, 7336–7356 CrossRef CAS PubMed.
- D. T. Chiu, R. M. Lorenz and G. D. M. Jeffries, Anal. Chem., 2009, 81, 5111–5118 CrossRef CAS PubMed.
- S. Sun, T. R. Slaney and R. T. Kennedy, Anal. Chem., 2012, 84, 5794–5800 CrossRef CAS PubMed.
- M. Y. He, J. S. Edgar, G. D. M. Jeffries, R. M. Lorenz, J. P. Shelby and D. T. Chiu, Anal. Chem., 2005, 77, 1539–1544 CrossRef CAS PubMed.
- B. Zheng and R. F. Ismagilov, Angew. Chem., Int. Ed., 2005, 44, 2520–2523 CrossRef CAS PubMed.
- L. Li, D. Mustafi, Q. Fu, V. Tereshko, D. L. Chen, J. D. Tice and R. F. Ismagilov, Proc. Natl. Acad. Sci. U. S. A., 2006, 103, 19243–19248 CrossRef CAS PubMed.
- L. F. Cai, Y. Zhu, G. S. Du and Q. Fang, Anal. Chem., 2012, 84, 446–452 CrossRef CAS PubMed.
- Z. Y. Han, W. T. Li, Y. Y. Huang and B. Zheng, Anal. Chem., 2009, 81, 5840–5845 CrossRef CAS PubMed.
- J. S. Edgar, C. P. Pabbati, R. M. Lorenz, M. Y. He, G. S. Fiorini and D. T. Chiu, Anal. Chem., 2006, 78, 6948–6954 CrossRef CAS PubMed.
- G. T. Roman, M. Wang, K. N. Shultz, C. Jennings and R. T. Kennedy, Anal. Chem., 2008, 80, 8231–8238 CrossRef CAS PubMed.
- M. Wang, G. T. Roman, M. L. Perry and R. T. Kennedy, Anal. Chem., 2009, 81, 9072–9078 CrossRef CAS PubMed.
- X. Z. Niu, B. Zhang, R. T. Marszalek, O. Ces, J. B. Edel, D. R. Klug and A. J. Demello, Chem. Commun., 2009, 6159–6161 RSC.
- L. M. Fidalgo, G. Whyte, B. T. Ruotolo, J. L. P. Benesch, F. Stengel, C. Abell, C. V. Robinson and W. T. S. Huck, Angew. Chem., Int. Ed., 2009, 48, 3665–3668 CrossRef CAS PubMed.
- Y. Zhu and Q. Fang, Anal. Chem., 2010, 82, 8361–8366 CrossRef CAS PubMed.
- J. Pei, Q. Li, M. S. Lee, G. A. Valaskovic and R. T. Kennedy, Anal. Chem., 2009, 81, 6558–6561 CrossRef CAS PubMed.
- J. Pei, Q. Li and R. T. Kennedy, J. Am. Soc. Mass Spectrom., 2010, 21, 1107–1113 CrossRef CAS PubMed.
- Y. Su, Y. Zhu and Q. Fang, Lab Chip, 2013, 13, 1876–1882 RSC.
- S. C. C. Shih, H. Yang, M. J. Jebrail, R. Fobel, N. McIntosh, O. Y. Al-Dirbashi, P. Chakraborty and A. R. Wheeler, Anal. Chem., 2012, 84, 3731–3738 CrossRef CAS PubMed.
- Y. Zhu, Y. X. Zhang, L. F. Cai and Q. Fang, Anal. Chem., 2013, 85, 6723–6731 CrossRef CAS PubMed.
- J. Wu, C. S. Hughes, P. Picard, S. Letarte, M. Gaudreault, J. F. Levesque, D. A. Nicoll-Griffith and K. P. Bateman, Anal. Chem., 2007, 79, 4657–4665 CrossRef CAS PubMed.
- E. C. Peters, M. Petro, F. Svec and J. M. J. Frechet, Anal. Chem., 1997, 69, 3646–3649 CrossRef CAS.
- F. M. Musteata, M. Walles and J. Pawliszyn, Anal. Chim. Acta, 2005, 537, 231–237 CrossRef CAS PubMed.
- W. B. Du, M. Sun, S. Q. Gu, Y. Zhu and Q. Fang, Anal. Chem., 2010, 82, 9941–9947 CrossRef CAS PubMed.
- C. D. Sohl, Q. Cheng and F. P. Guengerich, Nat. Protoc., 2009, 4, 1252–1257 CrossRef CAS PubMed.
- E. T. Gangl, M. Annan, N. Spooner and P. Vouros, Anal. Chem., 2001, 73, 5635–5644 CrossRef CAS.
- S. Jeong, P. D. Nguyen and Z. Desta, Antimicrob. Agents Chemother., 2009, 53, 541–551 CrossRef CAS PubMed.
- M. Unger and A. Frank, Rapid Commun. Mass Spectrom., 2004, 18, 2273–2281 CrossRef CAS PubMed.
- L. Zhang, M. J. Wei, C. Y. Zhao and H. M. Qi, Acta Pharmacol. Sin., 2008, 29, 1507–1514 CrossRef CAS PubMed.
- H. K. Lim, N. Duczak, Jr, L. Brougham, M. Elliot, K. Patel and K. Chan, Drug Metab. Dispos., 2005, 33, 1211–1219 CrossRef CAS PubMed.
- J. H. Zhang, T. D. Y. Chung and K. R. Oldenburg, J. Biomol. Screening, 1999, 4, 67–73 CrossRef PubMed.
- J. Ji, L. Nie, L. Qiao, Y. X. Li, L. P. Guo, B. H. Liu, P. Y. Yang and H. H. Girault, Lab Chip, 2012, 12, 2625–2629 RSC.
- J. S. Edgar, G. Milne, Y. Q. Zhao, C. P. Pabbati, D. S. W. Lim and D. T. Chiu, Angew. Chem., Int. Ed., 2009, 48, 2719–2722 CrossRef CAS PubMed.
Footnotes |
| † Electronic supplementary information (ESI) available: Details of chemicals and materials, and enzyme inhibition assay procedure are included. See DOI: 10.1039/c3an01917a |
| ‡ These authors contributed equally to this work. |
| This journal is © The Royal Society of Chemistry 2014 |

