Biologically inspired membrane design with a heparin-like interface: prolonged blood coagulation, inhibited complement activation, and bio-artificial liver related cell proliferation†
Shengqiang
Nie‡
ab,
Min
Tang‡
ab,
Chong (Sage)
Cheng
*ab,
Zehua
Yin
ab,
Lingren
Wang
ab,
Shudong
Sun
ab and
Changsheng
Zhao
*ab
aCollege of Polymer Science and Engineering, State Key Laboratory of Polymer Materials Engineering, Sichuan University, Chengdu 610065, People's Republic of China. E-mail: sagecheng@163.com; zhaochsh70@163.com; zhaochsh70@scu.edu.cn; Fax: +86-28-85405402; Tel: +86-28-85400453
bNational Engineering Research Center for Biomaterials, Sichuan University, Chengdu 610l064, People's Republic of China
First published on 17th September 2013
Abstract
In the present work, inspired by the chemical structure of heparin molecules, we designed a polyethersulfone (PES) membrane with a heparin-like surface for the first time by physically blending sulfonated polyethersulfone (SPES), carboxylic polyethersulfone (CPES), and PES at rational ratios. Evaporation and phase-inversion membranes of PES/CPES/SPES were prepared by evaporating the solvent in a vacuum oven, and by a liquid–liquid phase separation technique, respectively. Scanning electron microscopy (SEM) images revealed that the structures of the PES/CPES/SPES membranes were dependent on the proportions of the additives and no obvious phase separation was detected. The blood compatibility of the modified membrane surfaces was characterized in terms of bovine serum fibrinogen (BFG) adsorption, platelet adhesion, thrombin–antithrombin (TAT) generation, percentage of platelets positive for CD62p expression, clotting times (activated partial thromboplastin time (APTT) and prothrombin time (PT)), and complement activation on C3a and C5a levels. The results indicated that the blood compatibility of PES matrix was improved due to the biologically inspired membrane design with a heparin-like interface by introducing functional sulfonic acid and carboxylic acid groups. Furthermore, cell morphology observation and cell culture assays demonstrated that the modified membranes showed better performance in bio-artificial liver related cell proliferation than the pristine PES membrane. In general, the intriguing PES/CPES/SPES membranes, especially the phase-inversion one, showed improved blood and cell compatibility, which might have great potential application in the blood purification field.
1. Introduction
With the development of modern medicine, artificial materials are widely applied in the biomedical field during hemodialysis, cardiopulmonary by-pass, and other procedures that require disposable clinical instruments. Excellent biocompatibility is the essential and highly pursued character for the design of advanced artificial devices used to substitute for or operate in contact with blood, live tissues and organs. Among various evaluation indices, blood compatibility has been considered to be the most essential part of biocompatibility for blood-contact devices. The formation of a thrombus can be aggravated when blood proteins are adsorbed onto the material, which can cause artery occlusion. The reduction in blood supply caused by thrombosis can result in severe injury, including heart attack, and even death.1 Thus, blood compatibility has been extensively evaluated to avoid thrombosis and other material-related adverse events in the hematic environment.2Among the materials used in the blood-contact field, polyethersulfone (PES) and PES-based materials, which have good oxidative, thermal, and hydrolytic stabilities, as well as good mechanical and film-forming properties, have been widely applied in the fields of artificial organs and medical devices used for blood purification.3–8 However, as a blood-contact material, the blood compatibility of pristine PES membrane is not adequate and its application in blood-contacting devices is greatly limited, e.g. hemodialysis and artificial organs.9,10 Thus, the blood compatibility of PES should be improved to adapt to the hematic environment when it is used as a blood-contact material. With respect to the hydrophilicity and blood compatibility of PES,11 modifications have been reported in many previous efforts. The modification techniques for PES membranes generally include blending, surface assembly and coating, surface physical treatment, and surface grafting.12–18 For the improvement of blood compatibility of PES membranes, one of the key events is finding materials with good blood compatibility to modify the PES matrix.
Heparin, which is composed primarily of sulphated disaccharides, is the most commonly used anticoagulant in haemodialysis and the most widely applied biopolymer in surface modification.19 A number of studies suggested that the heparin grafted surfaces showed a diminished thrombogenic response.20,21 Nevertheless, with the long-term usage of heparinized materials, the dramatic loss of bioactivity and degradation in vivo may occur due to covalent or noncovalent binding with blood components.22 Moreover, these methods also suffer from some inherent drawbacks, e.g., some hazardous reagents are used in the grafting process, which are difficult to remove completely and may contaminate the obtained materials, and many of these methods are complicated and require additional steps in the preparation process, which may restrict the application of heparin-immobilized materials.23–26
Inspired by the biological blood and cell compatibility of heparin, we have produced many efforts to design heparin-like macromolecules to improve the biocompatibility of PES membranes by mimicking the structure of heparin via the introduction of the functional groups, such as sulfonic acid group or carboxylic acid group containing polymers.27–30 Through a facile physical blending approach, these functional heparin-like macromolecules have been used for improving the blood compatibility of PES membranes. In previous studies,27–29 the prepared heparin-like PES membranes have revealed good blood compatibility with inhibited platelet adhesion and activation, prolonged clotting time, etc. However, the amount of polymer blended into the PES matrix was limited due to poor miscibility between the polymers and PES.
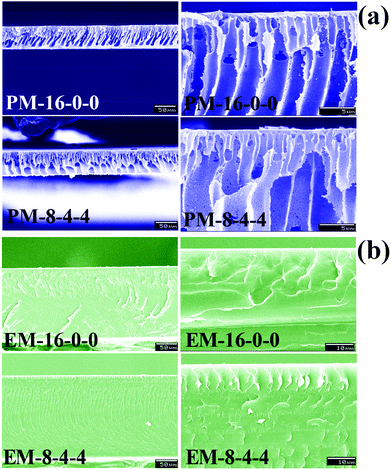
In the present work, inspired by the chemical structure of heparin, we design a PES membrane with a heparin-like surface for the first time by blending sulfonated polyethersulfone (SPES), carboxylic polyethersulfone (CPES), and PES at different ratios. To assess the performance of the prepared PES/CPES/SPES membrane in detail, two of the most common approaches for membrane fabrication are taken; evaporation and phase-inversion membranes of PES/CPES/SPES were prepared by evaporating the solvent in a vacuum oven, and by a liquid–liquid phase separation technique, respectively. Scanning electron microscopy (SEM) images revealed that the structures of the PES membranes were dependent on the proportions of the additives, and the blending system exhibited good miscibility and no obvious phase separation was observed due to the same polymer backbone of SPES, CPES and PES. ATR-FTIR and XPS tests were used to confirm the surface aggregation of these heparin-like macromolecules on the PES membrane surface. Furthermore, the effect of functional groups and preparation methods on the blood compatibility and cell proliferation was investigated by observing the following characteristics: water contact angle, protein adsorption, blood compatibility (platelet adhesion, thrombin–antithrombin (TAT) generation, platelet activation, clotting time, complement activation (C3a and C5a), and cytocompatibility (cell morphology and cell viability assays).
2. Materials and methods
2.1 Materials
Polyethersulfone (PES, Ultrason E6020P) was purchased from BASF, Germany. Chlorosulfonic acid (CSA) and dichloromethane (CH2Cl2, reagent grade) were purchased from Chengdu Kelong Chemical Inc. (Chengdu, China), and used without further purification. Acetyl chloride (CH3COCl) was purchased from Tianjin Kemel Chemical Reagent Company. N-Methyl-2-pyrrolidone (NMP; AR, 99.0%) was purchased from Chengdu Kelong Chemical Inc. (Chengdu, China), and used as the solvent. KMnO4 was purchased from Chengdu Changlian Chemical Reagent Company. Bovine serum fibrinogen (BFG) was obtained from Sigma Aldrich, USA. Micro BCA™ Protein Assay Reagent kits were the products of PIERCE. Anti-CD62PPE antibodies were purchased from Beckman Coulter, CA. Thrombin–antithrombin complex (TAT) (Enzygnost TAT micro) was obtained from Assay Pro, USA. C3a and C5a ELISA kits were purchased from Cusbio Biotech Co., Ltd, China. 3-(4,5-Dimethylthiazol-2-yl)-2,5-diphenyl tetrazolium bromide (MTT) was purchased from Sigma. All the other chemicals (analytical grade) were obtained from the Chengdu Kelong Inc, China, and were used without further purification.2.2 Synthesis and characterization of SPES and CPES
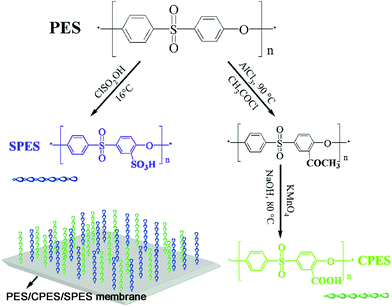
SPES was prepared according to the developed method from previous work,31,32 as shown in Scheme 1. Briefly, 10 g of PES, which had been dried in a vacuum oven at 110 °C for 1 h, was dissolved in 80 mL CH2Cl2. Then, chlorosulfonic acid solution (CH2Cl2 as the solvent, the molar ratio of chlorosulfonic acid to PES was 10![[thin space (1/6-em)]](https://www.rsc.org/images/entities/char_2009.gif) :
:![[thin space (1/6-em)]](https://www.rsc.org/images/entities/char_2009.gif) 1) was added drop-wise to the PES solution under stirring at 16 °C for about 30 minutes, then an additional hour was taken to complete the reaction, and the whole process was under nitrogen protection to inhibit the side reaction. The mixture was then gradually precipitated into deionized water under agitation, and the resulting precipitate was obtained by filtration, washing with deionized water until the pH value of the filtrate was the same as the deionized water. Finally, the obtained SPES was dried at 30 °C in a vacuum oven for about 48 h.
1) was added drop-wise to the PES solution under stirring at 16 °C for about 30 minutes, then an additional hour was taken to complete the reaction, and the whole process was under nitrogen protection to inhibit the side reaction. The mixture was then gradually precipitated into deionized water under agitation, and the resulting precipitate was obtained by filtration, washing with deionized water until the pH value of the filtrate was the same as the deionized water. Finally, the obtained SPES was dried at 30 °C in a vacuum oven for about 48 h.
Carboxylic polyethersulfone (CPES) was prepared according to our recent study,33 as shown in Scheme 1. Briefly, PES was dissolved in NMP with a concentration of 20 wt% for the acetylating reaction. Acetyl chloride (used as an acetylating reagent) and AlCl3 (used as catalyst) were mixed with NMP. The mixed solution was then poured into the PES solution slowly at a temperature of 90 °C. After 2 h, the product (PES-COCH3) was washed with double distilled water and dried in an oven for 24 h. In the oxidation reaction procedure, PES-COCH3 was dissolved in NMP with a concentration of 20 wt%. KMnO4 and NaOH were dissolved in a mixed solution of double distilled water and NMP. The mixed solution was then added into the PES-COCH3 solution slowly at 80 °C with stirring. After 6 h, the product was obtained through a centrifugal process using a centrifugal machine at approximately 4000 rpm. The obtained CPES was dried in a vacuum oven for 24 h.
1H-NMR spectra were recorded with a Bruker DRX 300 spectrometer (Bruker Co., Germany) to analyze SPES and CPES, using deuterated dimethyl sulfoxide (DMSO-d6) as a solvent. FTIR analysis of the polymers was performed using a Nicolet 560 spectrometer (America). The SPES and CPES were first dried in a vacuum oven overnight at room temperature, and then ground with KBr and pressed into tablets. A pristine PES sample was also prepared.
2.3 Preparation and characterization of modified PES membranes
The casting solutions were prepared as follows: PES, SPES and CPES were dissolved in NMP, and the solution was vigorously stirred until a clear homogeneous solution was obtained. The total concentration of all the polymers was 16 wt%. In the study, different kinds of membranes were prepared by changing the amounts of PES, SPES and CPES in the casting solutions, and the ratios of PES, CPES and SPES were 16![[thin space (1/6-em)]](https://www.rsc.org/images/entities/char_2009.gif) :
:![[thin space (1/6-em)]](https://www.rsc.org/images/entities/char_2009.gif) 0
0![[thin space (1/6-em)]](https://www.rsc.org/images/entities/char_2009.gif) :
:![[thin space (1/6-em)]](https://www.rsc.org/images/entities/char_2009.gif) 0, 8
0, 8![[thin space (1/6-em)]](https://www.rsc.org/images/entities/char_2009.gif) :
:![[thin space (1/6-em)]](https://www.rsc.org/images/entities/char_2009.gif) 8
8![[thin space (1/6-em)]](https://www.rsc.org/images/entities/char_2009.gif) :
:![[thin space (1/6-em)]](https://www.rsc.org/images/entities/char_2009.gif) 0, 8
0, 8![[thin space (1/6-em)]](https://www.rsc.org/images/entities/char_2009.gif) :
:![[thin space (1/6-em)]](https://www.rsc.org/images/entities/char_2009.gif) 6
6![[thin space (1/6-em)]](https://www.rsc.org/images/entities/char_2009.gif) :
:![[thin space (1/6-em)]](https://www.rsc.org/images/entities/char_2009.gif) 2, 8
2, 8![[thin space (1/6-em)]](https://www.rsc.org/images/entities/char_2009.gif) :
:![[thin space (1/6-em)]](https://www.rsc.org/images/entities/char_2009.gif) 4
4![[thin space (1/6-em)]](https://www.rsc.org/images/entities/char_2009.gif) :
:![[thin space (1/6-em)]](https://www.rsc.org/images/entities/char_2009.gif) 4, 8
4, 8![[thin space (1/6-em)]](https://www.rsc.org/images/entities/char_2009.gif) :
:![[thin space (1/6-em)]](https://www.rsc.org/images/entities/char_2009.gif) 2
2![[thin space (1/6-em)]](https://www.rsc.org/images/entities/char_2009.gif) :
:![[thin space (1/6-em)]](https://www.rsc.org/images/entities/char_2009.gif) 6, and 8
6, and 8![[thin space (1/6-em)]](https://www.rsc.org/images/entities/char_2009.gif) :
:![[thin space (1/6-em)]](https://www.rsc.org/images/entities/char_2009.gif) 0
0![[thin space (1/6-em)]](https://www.rsc.org/images/entities/char_2009.gif) :
:![[thin space (1/6-em)]](https://www.rsc.org/images/entities/char_2009.gif) 8.
8.
To prepare the phase-inversion membrane, the casting solution was vacuum degassed and then prepared into membrane by a spin coating method based on a liquid–liquid phase separation method at room temperature, which produced a white-coloured opaque membrane. The prepared phase-inversion membrane was a uniform thickness of about 70–100 μm.
To prepare the evaporation membrane, the obtained casting solution was spread on a glass plate at room temperature under an air atmosphere for 24 h to evaporate the solvent; the membrane was then dried at 40 °C in a vacuum oven for 48 h to eliminate the residual solvent; then a golden-coloured transparent membrane was obtained. The thickness of the evaporation membrane was about 300 μm.
After the membrane preparation process, the as-prepared membranes were immediately immersed in distilled water to remove the solvent of NMP. The membranes were immersed in distilled water for at least a week, and the water was changed three times a day. The residual solvent quantity was detected by an UV-Vis spectrophotometer (UV-1750, Shimadzu Co., Ltd, Japan) at a wavelength of 200 to 500 nm and is shown in ESI Fig. S1† (UV-Vis spectra, before and after one week).
The white opaque membranes prepared via the phase inversion method were termed PM-16-0-0, PM-8-8-0, PM-8-6-2, PM-8-4-4, PM-8-2-6 and PM-8-0-8; while the golden-coloured transparent membranes prepared by the evaporation method were termed EM-16-0-0, EM-8-8-0, EM-8-6-2, EM-8-4-4, EM-8-2-6 and EM-8-0-8 (the compositions are shown in Table 1).
| Membrane type | Membrane no. | PES (wt%) | CEPS (wt%) | SPES (wt%) |
|---|---|---|---|---|
| Phase-inversion membrane | PM-16-0-0 | 16 | 0 | 0 |
| PM-8-8-0 | 8 | 8 | 0 | |
| PM-8-6-2 | 8 | 6 | 2 | |
| PM-8-4-4 | 8 | 4 | 4 | |
| PM-8-2-6 | 8 | 2 | 6 | |
| PM-8-0-8 | 8 | 0 | 8 | |
| Evaporation membrane | EM-16-0-0 | 16 | 0 | 0 |
| EM-8-8-0 | 8 | 8 | 0 | |
| EM-8-6-2 | 8 | 6 | 2 | |
| EM-8-4-4 | 8 | 4 | 4 | |
| EM-8-2-6 | 8 | 2 | 6 | |
| EM-8-0-8 | 8 | 0 | 8 |
The hydrophilicity of the membrane surfaces was characterized based on the static contact angle measurement using a contact angle goniometer (OCA20, Dataphysics, Germany) equipped with a video capture device. A piece of 2 × 2 cm2 membrane was attached to a glass slide and mounted on the goniometer. For the static contact angle measurements, 3 μL double distilled water was dropped on the air-side surface of the membrane at room temperature, and the contact angle was measured after 10 seconds. At least eight measurements were averaged to get a reliable value. The measurement error was ±3°.
2.4 Blood compatibility
All the membranes were treated with phosphate-buffered solutions (PBS, pH = 7.4) before the blood compatibility and cytocompatibility experiments.![[thin space (1/6-em)]](https://www.rsc.org/images/entities/char_2009.gif) :
:![[thin space (1/6-em)]](https://www.rsc.org/images/entities/char_2009.gif) 1, v/v) and centrifuged at 1000 rpm and 4000 rpm for 15 minutes to obtain platelet-rich plasma (PRP) and platelet-poor plasma (PPP), respectively. The plasma was stored at −20 °C until use.26
1, v/v) and centrifuged at 1000 rpm and 4000 rpm for 15 minutes to obtain platelet-rich plasma (PRP) and platelet-poor plasma (PPP), respectively. The plasma was stored at −20 °C until use.26
![[thin space (1/6-em)]](https://www.rsc.org/images/entities/char_2009.gif) 000 platelet events on a FacsCalibur Flow Cytometer (Becton Dickison). Platelets without further treatment and isotypic IgG monoclonal antibodies (Mouse, Bechman Coulter, CA) were used as a negative control and isotype control, respectively.
000 platelet events on a FacsCalibur Flow Cytometer (Becton Dickison). Platelets without further treatment and isotypic IgG monoclonal antibodies (Mouse, Bechman Coulter, CA) were used as a negative control and isotype control, respectively.
2.5 Cytocompatibility
3. Results and discussion
3.1 Characterization of SPES and CPES
Fig. 1(A) shows the 1H-NMR spectra for PES, SPES and CPES. As shown in the spectra, for SPES, a significant chemical shift from δ = 8.0 to δ = 8.3 ppm of the hydrogen located in the o-position at the aromatic ring to the sulfone groups is observed, which indicated the sulfonic acid groups have been introduced to the aromatic rings, and the result is consistent with the description in the literature.32,38 For CPES, the peak at δ = 10.6 is the chemical shift of –COOH, which confirmed that –COOH was introduced onto the PES molecular chain after the oxidation reaction. Moreover, a split of the peak between δ = 7.0 and δ = 8.0 is found, which could also be attributed to the grafted carboxylic groups.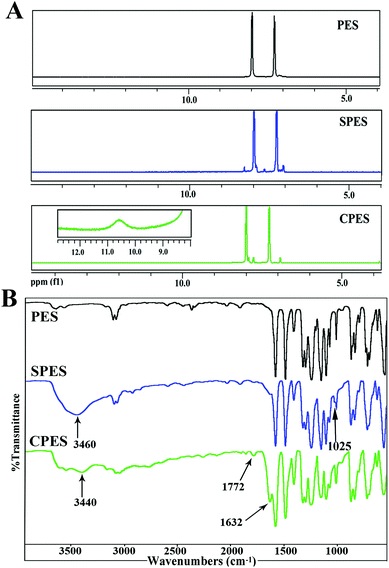 | ||
| Fig. 1 (A) 1H-NMR spectra of SPES and CPES. For CPES, the inserted figure of chemical shift at 9–12 ppm was obtained by amplifying the baseline; (B) FTIR spectra of SPES and CPES. | ||
FTIR spectra were also used to confirm the presence of the sulfonic and carboxylic groups of SPES and CPES, respectively. The FTIR spectra of PES, SPES and CPES are shown in Fig. 1(B), and it is found that the spectra of SPES and CPES are different from that of PES. For SPES, the peak at 1025 cm−1 could be assigned to the aromatic sulfonic group (–SO3H) symmetric stretching vibrations and the peak at 3460 cm−1 was the characteristic peak of the hydroxyl of the sulfonic groups. For CPES, the peaks at 3440 cm−1 and 1772 cm−1 indicated the presence of the –OH and –C![[double bond, length as m-dash]](https://www.rsc.org/images/entities/char_e001.gif) O, which should be attributed to the –COOH groups. In summary, the results of 1H NMR and FTIR spectra confirmed that SPES and CPES were successfully synthesized.
O, which should be attributed to the –COOH groups. In summary, the results of 1H NMR and FTIR spectra confirmed that SPES and CPES were successfully synthesized.
3.2 Composition and structure of the modified PES membranes
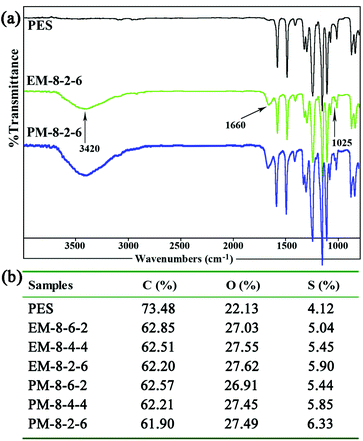 | ||
| Fig. 2 (a) FTIR spectra of the PES and the modified PES membranes; (b) the contents of the elements C, O, and S in the modified membranes detected by XPS (mass fraction). | ||
In order to determine the component and composition of the membrane surfaces, the modified membranes were detected by XPS with a take-off angle of 70 degrees. From the data, it can be observed that the contents of element S increase with the SPES increment both for the evaporation and phase-inversion membranes. Compared with the evaporation membrane, the contents of element S in the phase-inversion membranes are lower, since surface aggregation of SPES and CPES could occur more intensively in the phase-inversion membrane during the membrane preparation procedure. From the ATR-FTIR and XPS results, it could be demonstrated that the CPES and SPES were successfully immobilized on the modified membrane surface in an appropriate ratio.
3.3 Water contact angles (WCA)
Fig. 4 shows the WCAs for both the phase-inversion and evaporation membranes. It is observed that the water contact angle decreased with the addition of CPES in the membranes. The addition of SPES further decreased the WCA. Higuchi39 and Nakagawa40 pointed out that a material with –CH2SO3– segments had better hydrophilic property. Moreover, from this figure, it is found that the WCAs of the phase-inversion membranes decreased significantly compared to those of the evaporation membranes. This fact might be explained by the results that the surface morphology of the evaporation membrane were much more different from those of the phase-inversion membrane due to the different driving forces and different solvent migration times during the membrane preparation process. More detailed work is needed to explore the different effect of phase-inversion and evaporation membranes on the WCAs. In general, the decreased WCAs of the modified membranes indicate that the blending of SPES and CPES could enhance the hydrophilic property of the PES membrane surface.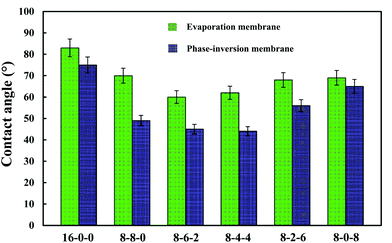 | ||
| Fig. 4 The water contact angles of the membranes (phase-inversion membrane and evaporation membrane). The results are expressed as means ± SD (n = 8). | ||
3.4 Blood compatibility
Fig. 5 shows the adsorption results of BFG on the membrane surface from PBS solutions (1 mg mL−1). As shown in the figure, it is found that the amounts of adsorbed BFG decreases with the addition of CPES for the two kinds of membranes, and further decreases with blending SPES, attributed to the synergistic influence of the CPES and SPES additives. The reduced BFG adsorption was in good agreement with the increased hydrophilicity of the membrane surfaces. The hydrophilic/hydrophobic character of the membrane material played a relatively important role in the interaction between protein and membrane. Since the hydrophilic surface preferentially adsorbed water rather than solutes, many researchers had followed the idea of increasing the hydrophilicity of a membrane material with the goal of reducing protein fouling and/or protein adsorption.46 In this study, the CPES and SPES contained hydrophilic functional groups, which endowed the modified membrane surfaces with high hydrophilicity. Han et al.47 suggested that negatively charged sulfonate groups exhibited relative low BFG adsorption amounts. Furthermore, with the synergistic effect of the sulfonic acid and carboxylic acid groups, the BFG adsorption of the PES/CPES/SPES was lower than that on the pristine PES membrane. The hydrophilicity and the negatively charged groups of the membrane surfaces should be responsible for the decrease of the protein adsorption.
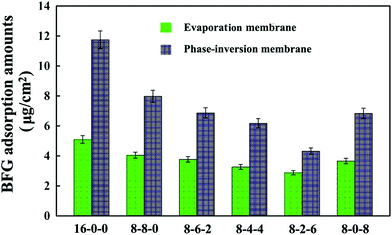 | ||
| Fig. 5 Bovine serum fibrinogen (BFG) adsorption amounts onto the membranes. The results are expressed as means ± SD (n = 3). | ||
In addition, it could be observed that the adsorbed BFG amounts on the phase-inversion membranes were higher compared with those on the evaporation membranes. The results could be attributed to the different surface morphologies of the phase-inversion and evaporation membranes which were formed during the phase-inversion and evaporation process, respectively. Furthermore, the two types of modified membrane exhibited the lowest amount of BFG adsorption when the ratio of SPES to CPES was 6![[thin space (1/6-em)]](https://www.rsc.org/images/entities/char_2009.gif) :
:![[thin space (1/6-em)]](https://www.rsc.org/images/entities/char_2009.gif) 2. These results indicate that the BFG adsorption could be visibly decreased due to the CPES and SPES, which provided carboxylic and sulfonic groups, respectively. The decreased protein adsorption was caused by these functional groups, which might improve the blood compatibility of the membranes; and the modified membranes might exhibit a heparin-like anticoagulant activity,48 which will be discussed in the following sections.
2. These results indicate that the BFG adsorption could be visibly decreased due to the CPES and SPES, which provided carboxylic and sulfonic groups, respectively. The decreased protein adsorption was caused by these functional groups, which might improve the blood compatibility of the membranes; and the modified membranes might exhibit a heparin-like anticoagulant activity,48 which will be discussed in the following sections.
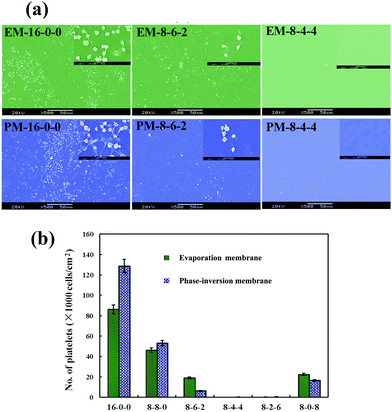
Fig. 6(a) shows the SEM micrographs of the platelets adhering onto the evaporated PES and modified PES membranes. As shown in the figure, with the same amplification multiple, it is observed that on the pristine PES membrane surface, numerous platelets are adhered and aggregated. Platelet aggregation on the pristine PES membrane indicated that thrombus formation might occur at the surface of the membrane, which is a life-threatening phenomenon for patients. However, for the modified membranes, very few platelets are found; and the platelets express a rounded morphology with nearly no pseudopodium and deformation. Fig. 6(b) shows the numbers of the platelet clusters adhered on the phase-inversion membranes from platelet-rich plasma. The modified membranes show a much lower number of adhered platelets compared with that of the PES membrane. From these figures, it could be observed that the platelet adhesion was distinctly decreased, and most platelets retained their discoid shape on the modified membranes. As the ratio of CPES to SPES varied, the adhering platelet number changed; remarkably, barely any adhered platelet was found on the surface of the M-8-4-4. The platelet adhesion results were consistent with the previous BFG adsorption. Fibrinogen was a known mediator for platelet adhesion and aggregation.49 The reduced platelet adhesion should be attributed to the surface introduction of the sulfonic and carboxylic groups of the modified membrane and the resulting decrease in BFG adsorption. Therefore, based on the platelet adhesion results, the modified membranes might have improved blood compatibility.
The results of platelet activation showed a slight increase in the percentages of CD62p-positive PLTs for both phase-inversion and evaporation membranes compared with the control sample. For the 8-4-4 membranes, the percentages of CD62p-positive PLTs showed no difference from that of the negative control (ESI Fig. S2†). The results indicated that the activation of platelets for the modified membranes with both sulfonic and carboxylic groups was significantly decreased compared to the pure PES membrane, and that the heparin-like structure of the surface could decrease platelet activation due to the functional groups.
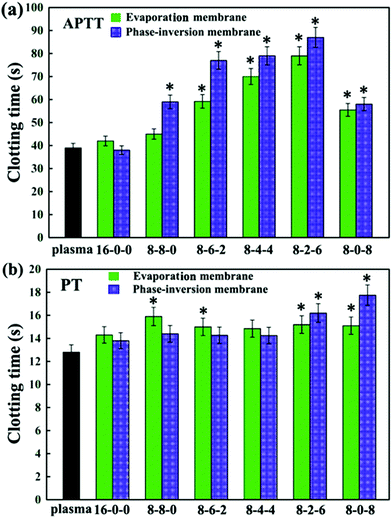 | ||
| Fig. 7 (a) APTT, and (b) PT assays for the PES and modified PES membranes. The results are expressed as means ± SD (n = 3), *P < 0.05 compared to the values of the 16-0-0 membrane (APTT and PT). | ||
Comparing Fig. 7(a) and (b), for most of membranes it is obvious that the APTT and PT of the modified membranes prepared by the phase inversion method were longer than those prepared by the evaporation method, with an increase of about 10 seconds. This might be due to the different formation processes for evaporation and phase-inversion membranes, which led to different surface morphology. Moreover, the results could also be attributed to the surface aggregation amounts of the SPES and CPES.50
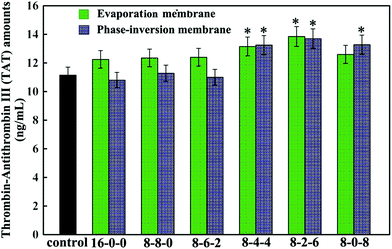
Fig. 8 shows the thrombin–antithrombin III (TAT) generation results of the membranes. Compared with the control sample, no significant increase is observed in the values of the TAT generation amounts for the PES-based membranes, which suggested that the TAT generation was not affected by the addition of the SPES and CPES. The results suggested that no obvious activation of the coagulation cascade occurred after the modified PES membranes contacting with blood, and the modified PES membranes had good blood compatibility.
In addition, the phase-inversion membranes showed slightly decreased TAT generation compared with the evaporation membranes. This was in good accordance with the results of platelet adhesion and anticoagulant activity assay. This could also be explained by the different formation processes.
Thus, it could be concluded that phase inversion method modified membrane had great potential to approach the highly blood compatible membranes, and this study provided enlightening information for the design of a modified membrane using phase-inversion and evaporation.
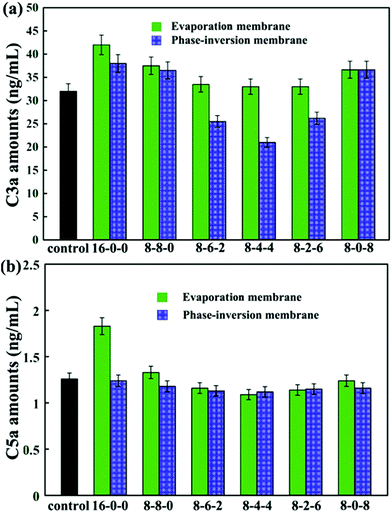
The concentrations of C3a and C5a are used to evaluate the complement activation, and the results are presented in Fig. 9. As shown in Fig. 9(a), by blending SPES and CPES in the membranes, the activated C3a concentrations decreased compared with that of the pristine PES membrane, especially for the phase inversion membranes. Moreover, the membranes (PM-8-6-2, PM-8-4-4, and PM-8-2-6) prepared by the phase inversion method showed significantly decreased concentrations of complement fragment C3a compared with the control sample. However, the membranes (EM-8-6-2, EM-8-4-4, and EM-8-2-6) prepared by the evaporation process showed no obvious difference when compared with the control sample at the C3a level. These results demonstrate that the PES/CPES/SPES membranes successfully inhibited the formation of soluble C3a in blood plasma compared with the PES membrane.
Similar results are observed for the C5a concentrations (Fig. 9(b)). No significant difference in C5a levels is observed for the modified membranes compared to the control sample, except that the pristine PES membrane prepared by evaporation method showed a significant increase in C5a level.
Some researchers pointed out that the surface contact activation usually occurred when blood-contacting materials contacted with blood, especially negatively charged surfaces, which then led to the activation of the coagulation cascade.51,52 This activation of the coagulation cascade could result in the formation of thrombin and fibrin clots.53 Simultaneously, the formed thrombin and fibrin could activate platelets and promote the formation of a thrombus. In this study, in order to mimic the heparin-like surface, –COOH and –SO3H groups (negatively charged groups) were introduced to the modified PES membrane surface. From the results of CD62p-positive platelets expression and TAT complex amounts, it could be found that no significant evidence for contact phase activation occurred, especially in the modified membranes PM-8-4-4 and EM-8-4-4. Thus, the contact phase activation could be controlled by regulating the –COOH and –SO3H density in an appropriate range. Moreover, from the results of the blood compatibility test, it could be observed that when we introduced both –COOH and –SO3H, the blood compatibility of the modified membranes was better than that of the modified membrane that only had –COOH or –SO3H introduced. Therefore, it could be speculated that a synergistic effect of –COOH and –SO3H at the modified membrane surface might occur when contacting with blood.
In general, inspired by the chemical structure of heparin molecules, we have successfully modified a PES membrane surface with a heparin-like interface via a blending method, as shown in Fig. S3.† Both SPES and CPES can be directly blended with PES in any proportion to form miscible polymer blends due to their similar molecular backbones. The modified membrane showed better hydrophilicity, decreased protein adsorption, suppressed platelet adhesion, suppressed platelet activation, reduced TAT generation, prolonged APTT, and limited activation of C3a and C5a compared to the pure PES membrane. Most importantly, the platelet activation and thrombin generation results suggested that nearly no contact activation occurred after the blood contacted with the modified PES membrane surface, which indicated that the modified membranes might possess intrinsic blood compatibility and could satisfy various blood contacting applications.
3.5 Bio-artificial liver related cell proliferation
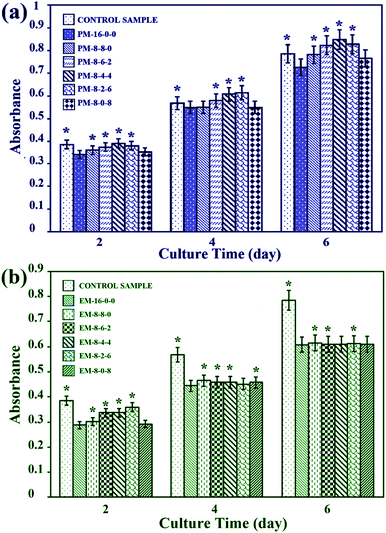
As the PES membranes were expected to be used as biomaterials in bio-artificial liver supports, bio-artificial liver related cell proliferation also played a critical role for the modified membranes. Thus, cell proliferation of the modified membranes was evaluated in terms of cell morphology and cytotoxicity. Human hepatocytes LO2 were chosen for the cell culture experiments.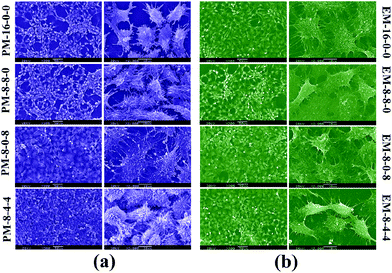 | ||
| Fig. 10 SEM pictures of human hepatocytes LO2 cultured on the membranes for 2 days: (a) hepatocytes on phase-inversion membranes; (b) hepatocytes on evaporation membranes. | ||
Therefore, it could be concluded that better cell proliferation could be obtained with the addition of both CPES and SPES into PES membranes, and the modified membranes prepared by the phase inversion method have potential to be used for bio-artificial liver supports.
4. Conclusions
Inspired by the chemical structure of heparin molecules, we have successfully modified a PES membrane surface with a heparin-like interface via a blending method with enhanced biocompatibility. Clinical complications associated with current hemodialysis PES membranes might be improved using the SPES and CPES as additives. Both SPES and CPES can be directly blended with the PES matrix in any proportion to form miscible polymer blends due to their similar molecular chains, and can be prepared into evaporation and phase-inversion membranes. The SPES and CPES had a synergistic effect on the improvement of the modified membranes, and these obtained PES/CPES/SPES membranes showed better hydrophilicity, decreased protein adsorption, suppressed platelet adhesion and activation, reduced TAT generation, prolonged APTT, and limited activation of C3a and C5a compared to the pure PES membrane. The modified membranes prepared via phase inversion proved to be better than those prepared by the evaporation method in terms of blood compatibility performance. Furthermore, the platelet activation and thrombin generation results suggested that nearly no contact activation occurred after blood contacting with the modified PES membrane surface. Thus, the modified membrane prepared by the phase inversion technique has great potential in applications for blood purification, including hemodialysis and bio-artificial liver support. Moreover, this study provided useful information for the industrial and clinical application of the membranes. The significance of enhanced blood and cell compatibility of the modified PES membranes with a heparin-like surface prepared by the phase inversion method as described here is not restricted to PES membranes, but may enlighten the modification of some other blood-contacting materials in general.Acknowledgements
This work was financially sponsored by the National Natural Science Foundation of China (no. 51073105, 51173119, and 51225303), and the Program for Changjiang Scholars and Innovative Research Team in the University (IRT1163). We should also thank our laboratory members for their generous help, and gratefully acknowledge the help of Ms H. Wang, of the Analytical and Testing Center at Sichuan University, for the SEM, and Ms Liang, of the Department of Nephrology at West China Hospital, for the fresh human blood collection.Notes and references
- C. Mao, Y. Qiu, H. Sang, H. Mei, A. Zhu, J. Shen and S. Lin, Adv. Colloid Interface Sci., 2004, 110, 5–17 CrossRef CAS PubMed.
- C. Cheng, S. Nie, S. Li, H. Peng, H. Yang, L. Ma, S. Sun and C. Zhao, J. Mater. Chem. B, 2013, 1, 265–275 RSC.
- M. Ulbricht, O. Schuster, W. Ansorge, M. Ruetering and P. Steiger, Sep. Purif. Technol., 2007, 57, 63–73 CrossRef CAS.
- S. David, D. Gerra, C. De Nitti, B. Bussolati, U. Teatini, G. R. Longhena, C. Guastoni, N. Bellotti, F. Combarnous and C. Tetta, Polyethersulfone: Membranes for Multiple Clinical Applications, Contrib. Nephrol., Basel, Karger, 2003, 138, 43–54 Search PubMed.
- C. S. Zhao, T. Liu, Z. P. Lu, L. P. Chen and J. Huang, Artif. Organs, 2001, 25, 60–63 CAS.
- R. H. Tullis, R. P. Duffin, M. Zech and J. L. Ambrus, Ther. Apher., 2002, 6, 213–220 CrossRef PubMed.
- C. Sperling, M. Houska, E. Brynda, U. Streller and C. Werner, J. Biomed. Mater. Res., Part A, 2006, 76, 681–689 CrossRef PubMed.
- J. H. Kim and C. K. Kim, J. Membr. Sci., 2005, 262, 60–68 CrossRef CAS.
- Z. B. Liu, X. P. Deng, M. Wang, J. X. Chen, A. M. Zhang, Z. W. Gu and C. S. Zhao, J. Biomater. Sci., Polym. Ed., 2009, 20, 377–397 CrossRef CAS PubMed.
- C. Cheng, S. Li, W. F. Zhao, Q. Wei, S. Q. Nie, S. D. Sun and C. S. Zhao, J. Membr. Sci., 2012, 417, 228–236 CrossRef.
- B. H. Fang, Q. Y. Ling, W. F. Zhao, Y. L. Ma, P. L. Bai, Q. Wei, H. F. Li and C. S. Zhao, J. Membr. Sci., 2009, 329, 46–55 CrossRef CAS.
- C. S. Zhao, J. M. Xue, F. Ran and S. D. Sun, Prog. Mater. Sci., 2013, 58, 76–150 CrossRef CAS.
- K. Ishihara, K. Fukumoto, Y. Iwasaki and N. Nakabayashi, Biomaterials, 1999, 20, 1545–1551 CrossRef CAS PubMed.
- K. Ishihara, K. Fukumoto, Y. Iwasaki and N. Nakabayashi, Biomaterials, 1999, 20, 1553–1559 CrossRef CAS PubMed.
- T. Hasegawa, Y. Iwasaki and K. Ishihara, Biomaterials, 2001, 22, 243–251 CrossRef CAS PubMed.
- L. P. Zhu, Z. Yi, F. Liu, X. Z. Wei, B. K. Zhu and Y. Y. Xu, Eur. Polym. J., 2008, 44, 1907–1914 CrossRef CAS.
- M. Ulbricht, H. Matuschewski, A. Oechel and H. G. Hicke, J. Membr. Sci., 1996, 115, 31–47 CrossRef CAS.
- H. Susanto and M. Ulbricht, Langmuir, 2007, 23, 7818–7830 CrossRef CAS PubMed.
- H. Engelberg, Pharmacol. Rev., 1996, 48, 327–352 CAS.
- M. Fukutomi, S. Kobayashi, K. Niwaya, Y. Hamada and S. Kitamura, Artif. Organs, 1996, 20, 767–776 CrossRef CAS PubMed.
- S. Svenmarker, E. Sandstrom, T. Karlsson, E. Jansson, S. Haggmark, R. Lindholm, M. Appelblad and T. Aberg, Eur. J. Cardiothorac. Surg., 1997, 11, 957–964 CrossRef CAS PubMed.
- D. Labarre, Int. J. Artif. Organs, 1990, 13, 651 CAS.
- P. Joshi, K. F. Schilke, A. Fry, J. McGuire and K. Bird, Int. J. Biol. Macromol., 2010, 47, 98–103 CrossRef CAS PubMed.
- D. S. Wavhal and E. R. Fisher, J. Membr. Sci., 2002, 209, 255–269 CrossRef CAS.
- G. M. Bernacca, M. J. Gulbransen, R. Wilkinson and D. J. Wheatley, Biomaterials, 1998, 19, 1151–1165 CrossRef CAS PubMed.
- C. Cheng, S. Li, S. Nie, W. Zhao, H. Yang, S. Sun and C. Zhao, Biomacromolecules, 2012, 13, 4236–4246 CrossRef CAS PubMed.
- F. Ran, S. Nie, J. Li, B. Su, S. Sun and C. Zhao, Macromol. Biosci., 2012, 12, 116–125 CrossRef CAS PubMed.
- M. Tang, J. M. Xue, K. L. Yan, T. Xiang, S. D. Sun and C. S. Zhao, J. Colloid Interface Sci., 2012, 386, 428–440 CrossRef CAS PubMed.
- S. Q. Nie, J. M. Xue, Y. Lu, Y. Q. Liu, D. S. Wang, S. D. Sun, F. Ran and C. S. Zhao, Colloids Surf., B, 2012, 100, 116–125 CrossRef CAS PubMed.
- L. L. Li, C. Cheng, T. Xiang, M. Tang, W. F. Zhao, S. D. Sun and C. S. Zhao, J. Membr. Sci., 2012, 405, 261–274 CrossRef.
- R. Guan, H. Zou, D. P. Lu, C. L. Gong and Y. F. Liu, Eur. Polym. J., 2005, 41, 1554–1560 CrossRef CAS.
- I. C. Kim, J. G. Choi and T. M. Tak, J. Appl. Polym. Sci., 1999, 74, 2046–2055 CrossRef CAS.
- D. Wang, W. Zou, L. Li, Q. Wei, S. Sun and C. Zhao, J. Membr. Sci., 2011, 374, 93–101 CrossRef CAS.
- G. M. R. Wetzels and L. H. Koole, Biomaterials, 1999, 20, 1879–1887 CrossRef CAS PubMed.
- A. Higuchi, K. Shirano, M. Harashima, B. O. Yoon, M. Hara, M. Hattori and K. Imamura, Biomaterials, 2002, 23, 2659–2666 CrossRef CAS PubMed.
- V. Schmidt, T. Hilberg, G. Franke, D. Gläser and H. H. W. Gabriel, Platelets, 2003, 14, 287–294 CrossRef CAS PubMed.
- W. C. Lin, D. G. Yu and M. C. Yang, Colloids Surf., B., 2005, 44, 82–92 CrossRef CAS PubMed.
- I. S. Byun, I. C. Kim and J. W. Seo, J. Appl. Polym. Sci., 2000, 76, 787–798 CrossRef CAS.
- A. Higuchi, N. Iwata and T. Nakagawa, J. Appl. Polym. Sci., 1990, 40, 709–717 CrossRef CAS.
- A. Higuchi and T. Nakagawa, J. Appl. Polym. Sci., 1990, 41, 1973–1979 CrossRef CAS.
- J. D. Andrade and V. Hlady, Ann. N. Y. Acad. Sci., 1987, 516, 158–172 CrossRef CAS PubMed.
- W. B. Tsai, J. M. Grunkemeier, C. D. McFarland and T. A. Horbett, J. Biomed. Mater. Res., 2002, 60, 348–359 CrossRef CAS PubMed.
- W. B. Tsai, Q. Shi, J. M. Grunkemeier, C. McFarland and T. A. Horbett, J. Biomater. Sci., Polym. Ed., 2004, 15, 817–840 CrossRef CAS PubMed.
- Y. X. Leng, J. Y. Chen, P. Yang, H. Sun, G. J. Wan and N. Huang, Surf. Sci., 2003, 531, 177–184 CrossRef CAS.
- T. I. T. Okpalugo, A. A. Ogwu, P. D. Maguire and J. A. D. McLaughlin, Biomaterials, 2004, 25, 239–245 CrossRef CAS PubMed.
- D. Mockel, E. Staude and M. D. Guiver, J. Membr. Sci., 1999, 158, 63–75 CrossRef CAS.
- D. K. Han, K. D. Park, G. H. Ryu, U. Y. Kim, B. G. Min and Y. H. Kim, J. Biomed. Mater. Res., 1996, 30, 23–30 CrossRef CAS PubMed.
- D. K. Han, N. Y. Lee, K. D. Park, Y. H. Kim, H. I. Cho and B. G. Min, Biomaterials, 1995, 16, 467–471 CrossRef CAS PubMed.
- A. L. Bailly, A. Laurent, H. Lu, I. Elalami, P. Jacob, O. Mundler, J. J. Merland, A. Lautier, J. Soria and C. Soria, J. Biomed. Mater. Res., 1996, 30, 101–108 CrossRef CAS PubMed.
- F. Ran, S. Nie, W. Zhao, J. Li, B. Su, S. Sun and C. Zhao, Acta Biomater., 2011, 7, 3370–3381 CrossRef CAS PubMed.
- G. J. Miller, J. K. Cruickshank, L. J. Ellis, R. L. Thompson, H. C. Wilkes, Y. Stirling, K. A. Mitropoulos, J. V. Allison, T. E. Fox and A. O. Walker, Atherosclerosis, 1989, 78, 19–24 CrossRef CAS PubMed.
- J. M. Nigretto, E. Corretge and M. Jozefowicz, Biomaterials, 1989, 10, 449–454 CrossRef CAS PubMed.
- M. B. Gorbet and M. V. Sefton, Biomaterials, 2004, 25, 5681–5703 CrossRef CAS PubMed.
- H. Nazar, P. Caliceti, B. Carpenter, A. I. El-Mallah, D. G. Fatouros, M. Roldo, S. M. van der Merwe and J. Tsibouklis, Biomater. Sci., 2013, 1, 306–314 RSC.
- F. R. Rose, L. A. Cyster, D. M. Grant, C. A. Scotchford, S. M. Howdle and K. M. Shakesheff, Biomaterials, 2004, 25, 5507–5514 CrossRef CAS PubMed.
Footnotes |
| † Electronic supplementary information (ESI) available: UV-Vis spectra, heparin inspired interface design and activation of red cells and platelets, CD62p-positive platelet expression. See DOI: 10.1039/c3bm60165j |
| ‡ These two authors contributed equally to this work. |
| This journal is © The Royal Society of Chemistry 2014 |

