Experimental evidence for ‘carbon bonding’ in the solid state from charge density analysis†
Sajesh P.
Thomas
,
Mysore S.
Pavan
and
T. N.
Guru Row
*
Solid state and Structural Chemistry Unit, Indian Institute of Science, Bangalore 560012, India. E-mail: ssctng@sscu.iisc.ernet.in; Fax: +91-080-23601310
First published on 18th October 2013
Abstract
The validity of the newly proposed ‘carbon bonding’, an interaction where a carbon atom acts as an electrophilic site towards a variety of nucleophiles, has been investigated in the solid state. X-ray charge density analysis provides experimental evidence for this hitherto unexplored interaction and unravels its nature and strength.
Nonbonding interactions have been well recognized to have structure directing and stabilizing roles in supramolecular assembly in both solid and solution states. Among the non-covalent interactions other than the well-explored classes of hydrogen bonding, recently non-canonical interactions such as halogen bonding have invoked enormous interest.1 Chalcogen bonding and pnicogen bonding are other classes of interactions similar to halogen bonding, which are all construed to be of electrostatic origin.2,3 Though non-covalent interactions involving pnicogen, chalcogen and halogen atoms have been known to exist for several years, the description based on the formation of ‘σ-holes’ on the donor atoms was demonstrated by Politzer et al.4a,b Their studies on compounds containing group 14 elements such as C, Si and Ge have also shown similar behaviour, i.e. the propensity of these elements to offer an electropositive site towards a nucleophilic atom.4c The σ-hole formation on halogen atoms has been experimentally validated and even the least polarisable fluorine has been shown to exhibit such a behaviour.5 However, until recently the carbon atom in a methyl group or in an aliphatic chain (“sp3 hybridized”) had not been explored to exhibit such behaviour. Interestingly, Mani and Arunan in their recent paper suggested that the carbon atom in fact could act as an electrophilic centre which can non-covalently bond with nucleophilic atoms, leading to ‘carbon bonding’ (following a nomenclature analogous to the halogen–chalcogen bonding).6 Their work, essentially based on the Atoms In Molecule (AIM)7 theoretical calculations on small model molecular systems, revealed unusual bond paths from various nucleophilic atoms to the carbon atom in the –CH3 group. However, this intriguing mode of intermolecular interaction demands experimental evidence. Understanding such a ‘carbon bonding’ interaction and experimentally validating its existence can be significant, considering its broad implications in supramolecular chemistry. Also, a quantitative evaluation of this interaction can provide insights into the hydrophobic interactions involving hydrocarbons and many organic natural products. In this communication, we present the first unambiguous experimental evidence for the proposed ‘carbon bonding’ based on X-ray charge density analysis. Electron density topologies in two prototypical crystal structures with potential carbon bonding motifs are examined revealing distinct features of bond paths. In addition, the ubiquity of this interaction in the solid state has been identified by Cambridge Structural Database (CSD) analysis.
Firstly, we examined the possible carbon bonded motifs in the known crystal structures (CSD version 5.34) purely based on the following geometrical criteria: (i) that the distance between the carbon atom in the –CH3 group and the nucleophile/carbon bond acceptor atom A (where A = O, N, S, Cl etc.) is within the sum of the van der Waals radii (Fig. 1a) and (ii) that the distances from atom A to the –CH3 protons are not within the sum of their van der Waals radii (Fig. 1b). The second criterion has been set to avoid the motifs which are essentially formed by weak hydrogen bonds such as C–H⋯O and C–H⋯Cl interactions. Thus, for example, in the case of an oxygen atom acting as the nucleophile, the search criteria ensure that the resultant motifs represent either quasi-trifurcated C–H⋯O hydrogen bonded motifs or C⋯O ‘carbon bonding’ (Fig. 1). We have demonstrated elsewhere that such multifurcated weak hydrogen bond motifs are preferred as they can have interaction energy contribution comparable to the strong classical hydrogen bonds (what is referred to as the ‘Gulliver effect’ of weak interactions).8 Interestingly, the CSD search resulted in 716 hits representing possible C⋯O carbon bonded motifs. The hits include several key compounds like L-adrenaline, cimoxatone, leucophyllin C, visnagin, plumbagin, aplidioxin, etc., indicating the significance of the putative ‘carbon bonding’, in the context of natural products and hormones. Similarly, the searches for possible C⋯N, C⋯F, C⋯S and C⋯Cl carbon bonded motifs resulted in 189, 143, 110 and 157 hits respectively (S-2, T-2 and F-3 in ESI†). Though these results from CSD analysis were strong indicators of the ubiquity of the interaction in the solid state, there always remains an uncertainty associated with the hydrogen atom positions obtained from routine X-ray structure determination methods. Therefore, there is a possibility that the motifs which are listed as ‘carbon bonded’ might be guided by weak hydrogen bonds. In order to distinguish the possible carbon bonded motif from a trifurcated hydrogen bonded motif we set out to closely analyze two representative crystal structures exhibiting such motifs: (i) the anxiolytic drug candidate fenobam9 (I, Fig. 2a) for a possible C⋯Cl carbon bond, and (ii) dimethylammonium 4-hydroxybenzoate10 (II, Fig. 2b) for a possible C⋯O carbon bond. It should be noted that the crystal structure of I is predominantly guided by N–H⋯O, C–H⋯π and C–H⋯Cl hydrogen bonds and that of II is stabilized by charge assisted N–H⋯O and O–H⋯O hydrogen bonds. The quasi-trifurcated C–H⋯Cl motif in I shows a C⋯Cl distance of 3.247 Å (<3.45 Å, the sum of van der Waals radii of C and Cl) and C–H⋯Cl distances of 2.879 Å, 3.043 Å and 3.164 Å. The motif in II shows a C⋯O distance of 3.020 Å (<3.22 Å, the van der Waals radii sum of C and O) and the quasi-trifurcated C–H⋯O region exhibits C–H⋯O distances of 2.900 Å, 2.843 Å and 2.858 Å. It is noteworthy that the C–H⋯Cl and C–H⋯O distances in I and II do not necessarily suggest hydrogen bonds (Fig. 3). In order to gain a more quantitative insight into these interaction motifs, high resolution X-ray diffraction data were collected at 100 K for I and II. Furthermore, multipole formalism was employed to model the aspherical features of electron density distribution in both I and II (S-1, F-1 and T-1 in ESI†). From the charge density models, various (3,−1) critical points or bond critical points (bcp) could be identified which serve as the indicators of realistic interactions. In fact bcps were found in the intermolecular space corresponding to the quasi-trifurcated interaction regions in I and II. Furthermore, the interaction bond paths (the gradient paths following the maximum change in electron density from one nuclear position to the other, passing through bcp) were analysed.
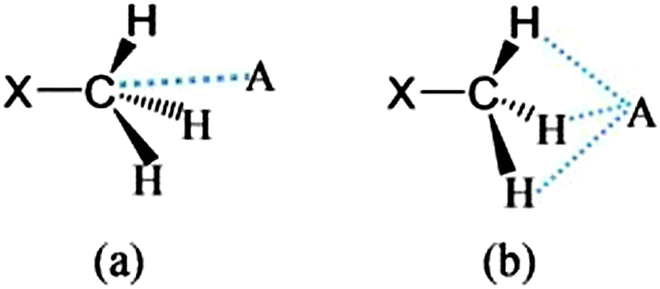 | ||
| Fig. 1 (a) “Carbon bonding” geometry with the acceptor atom A (where A = O, N, S, Cl etc.) pointing towards the carbon atom, and (b) the possible trifurcated C–H⋯A hydrogen bonded motif. | ||
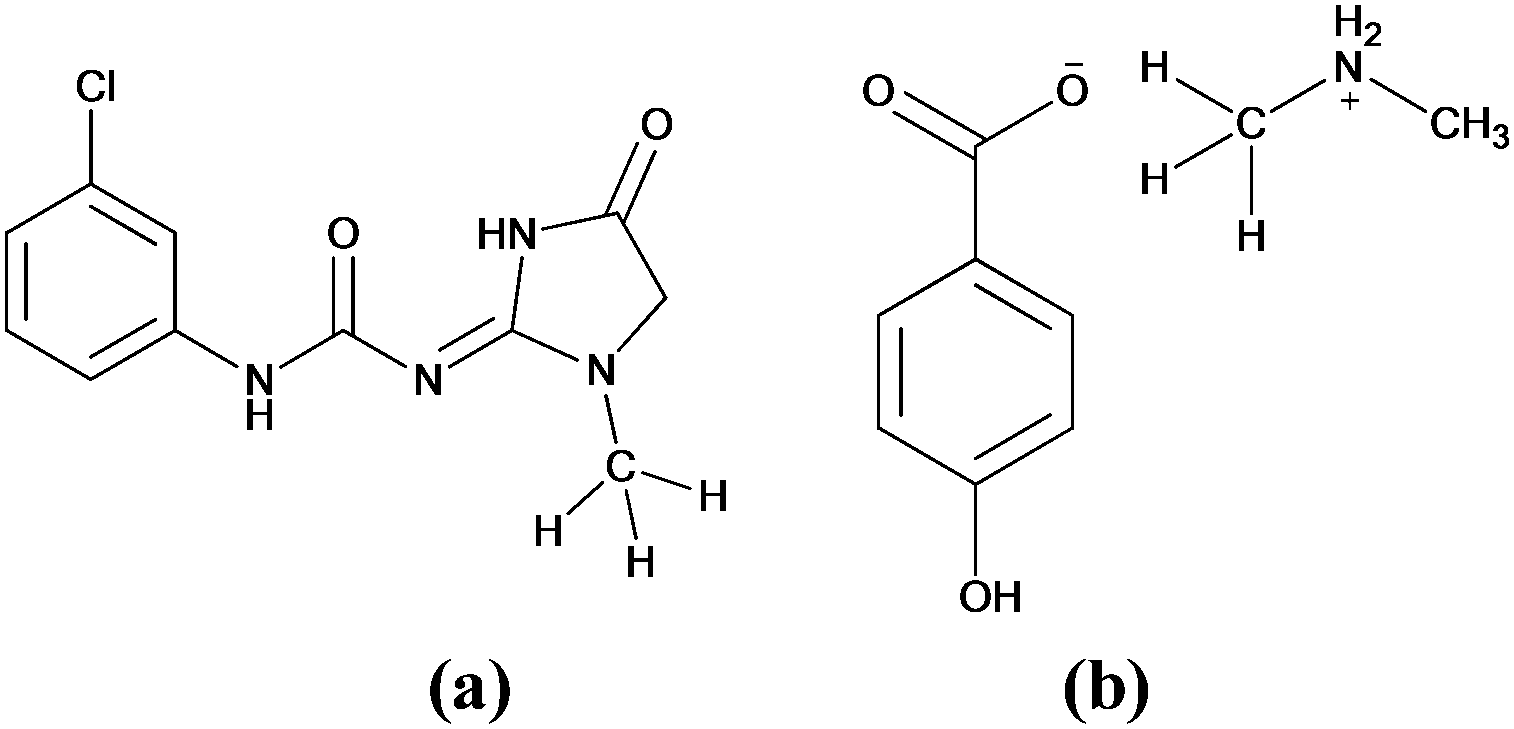 | ||
| Fig. 2 The molecular structures of (a) fenobam and (b) dimethylammonium 4-hydroxybenzoate. | ||
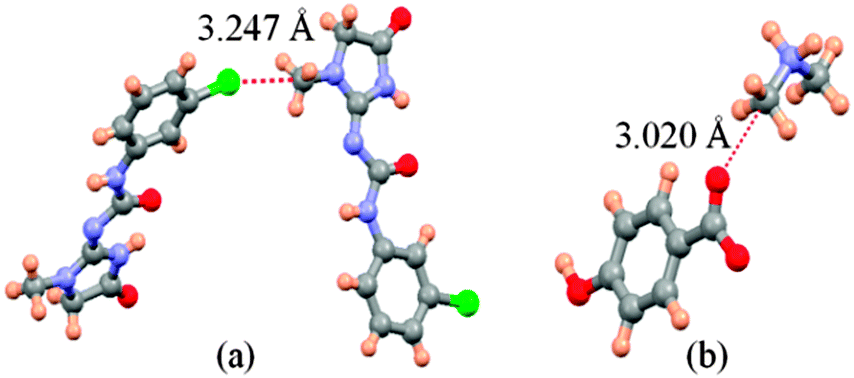 | ||
| Fig. 3 Interaction motifs investigated in this study. (a) Possible C⋯Cl carbon bonding motif in I and (b) potential C⋯O carbon bonding motif in II. | ||
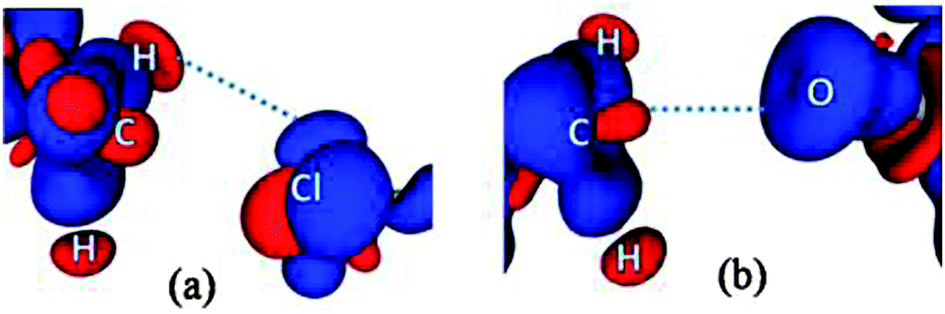
In contrast to what was anticipated for carbon bonding, I exhibited a bond path that originated from the Cl atom and terminated at one of the C–H protons (Fig. 4). Thus it is clear that the interaction motif in I is guided by a C–H⋯Cl hydrogen bond and not a carbon bond. Interestingly, the analysis of II showed a bond path originating from the nucleophilic oxygen atom and terminating at the –CH3 carbon atom. It should also be noted that there exist no other bond paths that lead to the C–H hydrogen atoms. Hence, the motif in II certainly represents a C⋯O ‘carbon bonded’ motif. Table 1 shows the electron density topological features of both C–H⋯Cl interaction in I and C⋯O carbon bonding in II. The values of the electron density (ρb) and Laplacian (∇2ρb) at the bcp in both cases are comparable to those of the reported C–H⋯Cl and C–H⋯O hydrogen bonds.8,11 The bond path trajectories and topological parameters obtained from the experimental models were further substantiated by periodic DFT calculations (ESI†). The ratio of local potential energy density to the kinetic energy density (|Vbcp|/Gbcp) derived from the ρb and ∇2ρb values supports the closed shell nature of the interactions. Furthermore, the approach of estimating the interaction energies from ρb and ∇2ρb, generally applied to hydrogen bonds, has also been utilized here to estimate the strength of C⋯O carbon bonding interaction and to compare it with hydrogen bonds (Table 1).5,12 Notably, the values of ρb, ∇2ρb and interaction energy are comparable to the corresponding values theoretically obtained for C⋯O carbon bonding in the water–methanol system by Mani and Arunan.6 It may be inferred that in the case of II, a protonated N atom attached to –CH3 carbon in the dimethylamine moiety imparts a similar charge depletion effect to the C atom, which supports the carbon bond formation. The static deformation density (Δρ(r) = ρ(r) − ρ(r)spherical)13 maps enable us to visualize these effects in terms of aspherical charge density distribution. The deformation density features are supportive of the electrostatic nature of the C⋯O carbon bonding where the charge concentrated region (CC) on the oxygen atom is directed towards the charge depleted (CD) region on carbon (Fig. 5). It may also be noted that the electron ‘lone pair’ directionality on the nucleophile plays a decisive role in the interaction region.
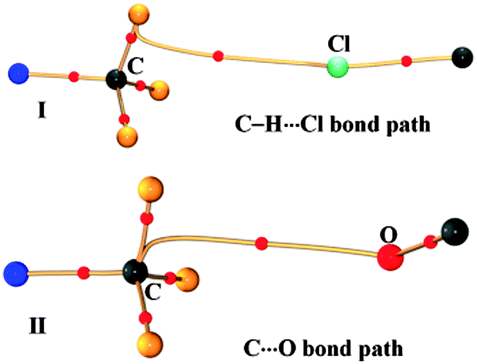 | ||
| Fig. 4 Experimental bond paths together with bcps in the intermolecular regions of I and II. | ||
 | ||
| Fig. 5 3D deformation density maps in (a) the C–H⋯Cl interaction region in I and (b) the C⋯O carbon bonding region in II. Red regions represent CD and blue regions represent CC. The Δρ iso-surfaces are drawn at ±0.02 e Å−3. | ||
In the case of I, the lone pairs (or valence shell charge concentration, VSCC regions – in charge density terms) on the Cl atom are not positioned adequately for carbon bonding (Fig. 5). In fact, the CD region on a C–H hydrogen atom faces the CC region on the Cl (corresponding to one of the ‘lone pair’ densities), which facilitates the formation of a C–H⋯Cl interaction in I. The lone pair directionality dependence in the carbon bonding region can also be visualized in Laplacian maps (F-6 and F-9 in ESI†). Furthermore, in order to understand the origin of the carbon bonding interaction in terms of σ-hole behaviour, electrostatic potentials (ESP) were mapped on iso-electron density surfaces (0.5 e Å−3) for both I and II. Carbon atoms exhibit electropositive regions on the surface, akin to the σ-holes observed in cases of atoms involved in halogen/chalcogen bonds. These σ-hole regions can be visualized along the direction of C–N covalent bonds in both I and II (Fig. 6). However, it may be noted that in II the three –CH3 hydrogen atoms can also expose electropositive regions to the carbon bond acceptor (i.e. the nucleophilic oxygen atom) and their net electrostatic interaction contribution is inevitably involved in this motif.
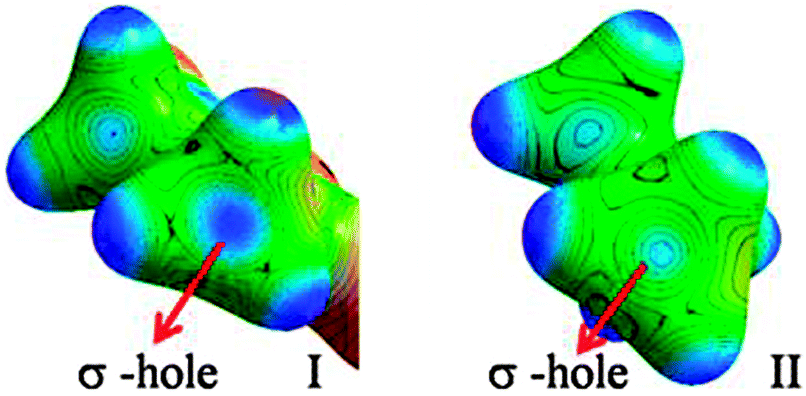 | ||
| Fig. 6 ESP mapped on isoelectron density surfaces (0.5 e Å−3) showing the ‘σ-holes‘on –CH3 carbon atoms in I and II, respectively. | ||
In summary, we have validated the theoretically proposed carbon bonding interaction via experimental charge density analysis. The observation of the σ-hole region on the C atom further substantiates carbon bonding as a realistic interaction. The fact that a methyl group can form a stabilizing interaction with an attacking nucleophile via carbon bonding may provide insights into the supramolecular origin of a bimolecular nucleophilic substitution reaction (SN2). Indeed, the fashion in which an “sp3” hybridized carbon atom involves in a pseudo-hypervalent (pentavalent) interaction such as in carbon bonding roughly mimics the possible transition state geometry of SN2 reaction.14 Though it has been only recently recognized, our analysis shows that a large number of known crystal structures exhibit structural motifs that could be potential carbon bonded motifs. The question as to whether it is ‘structure guiding’ or ‘structure guided’ naturally arises at this point, and in the context of supramolecular assembly in molecular crystals, the latter nomination would suit carbon bonding. This preliminary inference based on our study needs to be substantiated further by analysing a number of various carbon bonded motifs with a variety of nucleophiles. Nevertheless, considering the omnipresence of the –CH3 group in synthetic and natural organic molecules and their possible interactions with solvents, carbon bonding can prove to be of relevance to supramolecular assembly.
SPT thanks UGC and MSP thanks IISc for the Senior Research Fellowship. TNG thanks DST for the J. C. Bose fellowship.
Notes and references
- (a) P. Metrangolo, F. Meyer, T. Pilati, G. Resnati and G. Terraneo, Angew. Chem., Int. Ed., 2008, 47, 6114–6127 CrossRef CAS PubMed; (b) P. Metrangolo and G. Resnati, Halogen bonding: Fundamentals and Applications, Springer, 2008 Search PubMed.
- (a) W. Wang, B. Ji and Y. Zhang, J. Phys. Chem. A, 2009, 113, 8132–8135 CrossRef CAS PubMed; (b) M. E. Brezgunova, J. Lieffrig, E. Aubert, S. Dahaoui, P. Fertey, S. Lebègue, J. G. Ángyán, M. Fourmigué and E. Espinosa, Cryst. Growth Des., 2013, 13, 3283–3289 CrossRef CAS.
- (a) J. S. Murray, P. Lane and P. Politzer, Int. J. Quantum Chem., 2007, 107, 2286–2292 CrossRef CAS; (b) S. Scheiner, Acc. Chem. Res., 2012, 46, 280–288 CrossRef PubMed.
- (a) P. Politzer and J. S. Murray, ChemPhysChem, 2013, 14, 278–294 CrossRef CAS PubMed; (b) P. Politzer, J. S. Murray and T. Clark, Phys. Chem. Chem. Phys., 2013, 15, 11178–11189 RSC; (c) A. Bundhun, P. Ramasami, J. Murray and P. Politzer, J. Mol. Model., 2013, 19, 2739–2746 CrossRef CAS PubMed.
- (a) T. T. T. Bui, S. Dahaoui, C. Lecomte, G. R. Desiraju and E. Espinosa, Angew. Chem., Int. Ed., 2009, 48, 3838–3841 CrossRef CAS PubMed; (b) Y. V. Nelyubina, M. Y. Antipin, D. S. Dunin, V. Y. Kotov and K. A. Lyssenko, Chem. Commun., 2010, 46, 5325–5327 RSC; (c) V. R. Hathwar and T. N. Guru Row, Cryst. Growth Des., 2011, 11, 1338–1346 CrossRef CAS; (d) M. S. Pavan, K. Durga Prasad and T. N. Guru Row, Chem. Commun., 2013, 49, 7558–7560 RSC.
- D. Mani and E. Arunan, Phys. Chem. Chem. Phys., 2013, 15, 14377–14383 RSC.
- R. F. W. Bader, Atoms in Molecules: A Quantum Theory, Oxford Univ. Press, 1994 Search PubMed.
- S. P. Thomas, M. S. Pavan and T. N. Guru Row, Cryst. Growth Des., 2012, 12, 6083–6091 CAS.
- S. P. Thomas, K. Nagarajan and T. N. G. Row, Chem. Commun., 2012, 48, 10559–10561 RSC.
- B. M. Sornamurthy, G. Peramaiyan, G. Chakkaravarthi, R. M. Kumar and V. Manivannan, Acta Crystallogr., Sect. E, 2012, 68, o1445 CAS.
- (a) V. R. Hathwar and T. N. G. Row, J. Phys. Chem. A, 2010, 114, 13434–13441 CrossRef CAS PubMed; (b) K. Woźniak, P. R. Mallinson, C. C. Wilson, E. Hovestreydt and E. Grech, J. Phys. Chem. A, 2002, 106, 6897–6903 CrossRef; (c) P. Munshi and T. N. Guru Row, J. Phys. Chem. A, 2004, 109, 659–672 CrossRef PubMed.
- (a) I. Mata, I. Alkorta, E. Molins and E. Espinosa, Chem.–Eur. J., 2010, 16, 2442–2452 CrossRef CAS PubMed; (b) E. Espinosa, E. Molins and C. Lecomte, Chem. Phys. Lett., 1998, 285, 170–173 CrossRef CAS.
- The deformation density, Δρ(r) is the difference in electron density with respect to the spherical distribution of the isolated configuration around the interacting atoms.
- M. B. Smith and J. March, March's Advanced Organic Chemistry: Reactions, Mechanisms, and Structure, 6th edn, 2006, p. 426 Search PubMed.
Footnote |
| † Electronic supplementary information (ESI) available: Data collection, refinement details, theoretical calculations, crystallographic data and diagrams. CCDC 962724 and 962725. For ESI and crystallographic data in CIF or other electronic format see DOI: 10.1039/c3cc47226d |
| This journal is © The Royal Society of Chemistry 2014 |