 Open Access Article
Creative Commons Attribution 3.0 Unported Licence
A fresh look at an old nano-technology: catalysis
H.-J.
Freund
*a,
N.
Nilius
b,
T.
Risse
c and
S.
Schauermann
a
aDepartment of Chemical Physics, Fritz Haber Institute of the Max Planck Society, Faradayweg 4-6, 14195 Berlin, Germany. E-mail: freund@fhi-berlin.mpg.de; Fax: +49 30 84134100; Tel: +49 30 84134100
bInstitute of Physics, Carl von Ossietzky University Oldenburg, 26111 Oldenburg, Germany
cInstitute of Chemistry and Biochemistry – Physical and Theoretical Chemistry, Freie Universität Berlin, Takustr. 3, 14195 Berlin, Germany
First published on 27th January 2014
Abstract
The development of model catalyst systems for heterogeneous catalysis going beyond the metal single crystal approach, including phenomena involving the limited size of metal nanoparticles supported on oxide surfaces, as well as the electronic interaction through the oxide–metal interface, is exemplified on the basis of two case studies from the laboratory of the authors. In the first case study the reactivity of supported Pd nanoparticles is studied in comparison with Pd single crystals. The influence of carbon contaminants on the hydrogenation reaction of unsaturated hydrocarbons is discussed. Carbon contaminants are identified as a key parameter in those reactions as they control the surface and sub-surface concentration of hydrogen on and in the particles. In the second case study, scanning probe techniques are used to determine electronic and structural properties of supported Au particles as a function of the number of Au atoms in the particle. It is demonstrated how charge transfer between the support and the particle determines the shape of nanoparticles and a concept is developed that uses charge transfer control through dopants in the support to understand and design catalytically active materials.
Introduction
Heterogeneous catalysts represent material systems of considerable complexity. They are synthesized via elaborate recipes that miraculously lead to materials, catalyzing a specific reaction with enormous selectivity and less-energy consumption. It was Berzelius in the 18 hundreds, as well as Ostwald, who laid the foundation for the fantastic development of catalysis by stating: “A catalyst is a substance that accelerates the rate of a chemical reaction without being part of its final products.” Most relevant in technical processes is heterogeneous catalysis, where the catalyst is a solid, offering, by forming intermediates with the species involved in reactions, an alternate, more rapid path to the final products. The economic significance of heterogeneous catalysis is reflected in the fact that the worldwide market for solid catalysts in the automotive, petroleum, and other industries is on the order of $100 billion per year and growing rapidly in the 21st century. With centuries past, heterogeneous catalysis represents one of the oldest nanotechnologies. The reason for calling catalysis a nanotechnology is that the efficiency of heterogeneous catalysts increases with their total surface area (as long as no diffusion or other limiting transport process is required), and heterogeneous catalysts contain finely divided metal particles made on purpose to be of a certain size and shape for a specific reaction.1 Those nanoparticles were identified by transmission electron microscopy to be nanoscopic in size, and exhibit well-defined crystal facets that look like small single crystal surfaces. Exactly those observations in the late 60s of the last century pushed the development of surface science of single crystal metal surfaces to investigate elementary processes of surface reactions in the realm of catalysis. The 2007 Nobel Prize awarded to Gerhard Ertl emphasizes the importance of such model studies. In turn, it is also a valid question to ask whether further extensive studies in this field are justified. Upon closer inspection, however, it is clear that metal single crystals as models lack the ability to cover some fundamental aspects of the complexity of real catalysts, such as the finite size of nanoparticles and the interface between nanoparticles and the support material in addition to the nanoparticle flexibility allowing for modifications during catalytic action.2 A set of images on model systems that may be used to tackle this next stage of complexity is shown in Fig. 1 and discussed further below.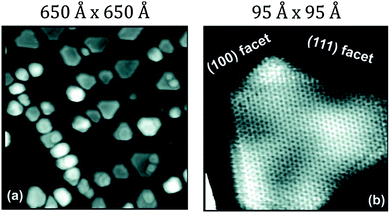 | ||
| Fig. 1 Scanning tunneling micrographs showing Pd nanoparticles supported on a model alumina film at two different magnifications.3 | ||
The factors addressed above influence, decisively, the reactivity of the catalytic system, and one may hope that by considering a finite number of factors, a detailed understanding of the complexity of the reacting system, at least in the static limit, may be approached. We will dwell on this approach by discussing two kinds of model systems. The first one deals with a seemingly simple reaction, i.e. the hydrogenation of butene to butane on supported Pd nanoparticles (shown in Fig. 1). In the second example, we discuss the possibility of using doping to control electron transfer on oxide surfaces, both for metal nanoparticles, in particular, Au, and molecules as well as their mutual influence.
Case study 1: olefin hydrogenation on Pd model supported catalysts: a molecular beam study
Real catalytic processes often require small amounts of some additives (promoters), such as halogens or alkali metals, that ensure high catalytic activity and selectivity.4 The role that these compounds play in the catalytic process remains unclear for most of the known operating systems. One of the most important modifiers for surface processes involving transformation of hydrocarbons is carbon, which is typically formed as a decomposition product at early stages of a reaction. It has been recognized in the catalytic community for a long time that accumulation of carbon and other strongly dehydrogenated carbonaceous deposits considerably affects the activity and selectivity for hydrocarbon conversions with hydrogen on transition metals.5–7 The underlying microscopic mechanisms of the carbon-induced changes in the reactivity were not known till recent times. There is also an ongoing discussion about the role of subsurface hydrogen species in olefin hydrogenation8–10 and how their population depends on the structure of the catalytic surface. The traditional opinion that only surface hydrogen species participate in the hydrogenation process was questioned for the first time by Ceyer and co-workers studying ethylene hydrogenation on Ni(111).8 More recently, other experimental and theoretical evidence for the important role of subsurface hydrogen was reported.9–11However, this potential involvement of subsurface hydrogen in hydrogenation of the double bond remained a controversial issue for long,12 mainly due to a lack of experimental techniques capable of separately monitoring different hydrogen species under reaction conditions. The existence of different hydrogen species in and on the nanoparticles may potentially result in some important implications for the overall activity and selectivity of the hydrogenation catalyst: if one of the key reaction steps – the formation of subsurface hydrogen, which is known to be a structure sensitive process – is slow under reaction conditions, the hydrogen permeability of the metal surface may be decisive for hydrogenation activity.
In our recent studies we investigated the hydrogenation activity of a Pd(111) single crystal surface and Pd nanoparticles supported on Fe3O4/Pt(111) model catalyst using a combination of isothermal pulsed molecular beam (MB) methods, vibrational spectroscopy and resonant nuclear reaction analysis for hydrogen depth profiling (rNRA) to further clarify the microscopic mechanisms active for hydrogenation over Pd catalysts.13–18
One of the key questions addressed in our studies was: how does the activity and selectivity of competing reaction pathways in olefin conversions with hydrogen depend on the structure of the metal nanoclusters, and on the presence of surface modifiers such as e.g. carbon?
Three main results were obtained in the present studies: (i) hydrogenation of the olefinic double bond was shown to require the presence of subsurface hydrogen, and a particular reaction step – the second half-hydrogenation (see the scheme below) – was identified as linked to the availability of subsurface hydrogen species; (ii) it was observed that sustained hydrogenation can be achieved only on Pd nanoparticles, and only when low-coordinated surface sites (edges, corners) were modified by adsorbed carbon. Neither C-free Pd nanoparticles nor C-free or C-modified Pd(111) surfaces were found to be capable of maintaining hydrogenation activity under steady state conditions; (iii) this unique role of carbonaceous deposits was explained by a pronounced facilitation of hydrogen diffusion into the subsurface of Pd nanoparticles through C-modified low-coordinated surface sites, thereby allowing fast replenishment of the reservoir of active subsurface hydrogen species under steady state reaction conditions. Both theoretical and experimental evidence was found for facilitated hydrogen penetration into the volume of Pd nanoclusters due to C-modification of low-coordinated surface sites.
Generally, olefin conversions with H2 are accounted for by the Horiuti–Polanyi mechanism, which proceeds through a series of successive hydrogenation–dehydrogenation steps.19 Specifically for cis-2-butene, investigated in this study, a first half-hydrogenation step forms a surface butyl species, which is a common reaction intermediate for both the cis–trans isomerization pathway (this pathway is also accompanied by an H–D exchange if the reaction is carried out with deuterium) and the hydrogenation (deuteration) pathway.20 This butyl intermediate can either undergo a β-hydride elimination to form trans-2-butene-d1, or incorporate a second D atom to form butane-d2via the second half-hydrogenation step. Dehydrogenation of the adsorbed alkene to other carbonaceous surface species is also possible, giving rise to the accumulation of different partially (or fully) dehydrogenated hydrocarbon species.21
The formation rates of the two primary reaction products – trans-2-butene-d1 and butane-d2 – were probed under isothermal conditions. Two independent molecular beams were used to dose the reactants – cis-2-butene and D2 – with the evolution of gas phase products monitored as a function of time by quadrupole mass spectrometry. As a model catalyst, Pd nanoparticles supported on thin planar Fe3O4 film were used. This well-defined surface was prepared in situ under ultra-high vacuum conditions on a planar Pt(111) substrate.22 The Pd nanoparticles are on average 6 nm in diameter and exhibit mainly (111) facets (∼80%) and a smaller fraction of (100) facets and other low-coordinated surface sites such as edges and corners (∼20%). It has been spectroscopically shown in our previous studies14,23 that when a sub-monolayer amount of C is produced on the Pd nanoparticles, it selectively blocks the low-coordinated surface sites while leaving the majority of the regular (111) facets C-free. Note that a fraction of produced carbonaceous deposits, particularly atomic carbon, might reside below the uppermost Pd layer as predicted theoretically.24 We used both types of catalysts – C-free and C-modified (with the edges and corners covered by C) – to compare their catalytic activities and selectivities with regard to the competing hydrogenation and cis–trans isomerization pathways.
Hydrogenation rates of cis-2-butene over clean and C-containing surfaces of Pd nanoparticles supported on an Fe3O4(111)/Pt(111) oxide film are shown in Fig. 2a. Pd nanoparticles were saturated first with deuterium at exposures sufficient for formation of both surface and subsurface D species and then short pulses of cis-2-butene were applied using an independent beam source along with continuous D2 exposure.13,14
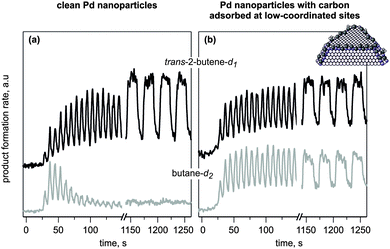 | ||
| Fig. 2 Results from isothermal pulsed molecular beam experiments on the conversion of cis-2-butene with D2 at 260 K on (a) initially clean and (b) C-modified Pd/Fe3O4/Pt(111) model catalysts. Shown is the evolution of the reaction rates as a function of time for trans-2-butene-d1 (black curves) and butane-d2 (grey curves). The catalysts were exposed to a D2 beam continuously, and the cis-2-butene beam was pulsed (from ref. 17). | ||
The reaction was carried out in a large excess of gas phase D2 exposure with a flux ratio of D2/cis-2-butene = 760. On the initially clean particles, both reaction pathways exhibit a short induction period followed by a transient period of high activity. However, for C-free nanoparticles at 260 K, only cis–trans isomerization activity is sustained over extended periods of time, whereas the hydrogenation rate quickly decreases and returns to zero. Remarkably, not only isomerization but also hydrogenation is maintained under steady state conditions on the catalyst that was C-modified prior to reaction (Fig. 2b). This unique catalytic behavior clearly demonstrates the promoting role of C in the persistent hydrogenation activity of the Pd catalyst.13
Detailed kinetic analysis of both reaction rates strongly suggests that two non-equivalent D species must be involved in the first and the second half-hydrogenation steps to produce butane-d2. Indeed, the sustained cis–trans isomerization rate evidences fast formation of the common butyl-d1 reaction intermediate and hence suggests sufficient availability of both adsorbed cis-2-butene species and surface D atoms. However, the presence of these D atoms, which are involved in the first half-hydrogenation step, is apparently not a sufficient condition for the second half-hydrogenation to butane-d2. Rather, a special type of D atoms must be required for the second half-hydrogenation step. This second type of D species is obviously present on the Pd nanoparticles pre-saturated with deuterium as at the beginning of the olefin exposure giving rise to high hydrogenation rates. However, they cannot be replenished under steady state conditions on clean Pd particles, resulting in selective suppression of the hydrogenation to butane-d2.
As a next step, we identified the nature of this second type of D species involved in the second-half hydrogenation of the olefinic bond. Our experimental approach combined measurements of the concentrations of surface and subsurface H species by NRA for hydrogen depth profiling and complementary transient molecular beam experiments to measure the reaction rates.13,25 The former method (described in detail in ref. 25) was used to independently monitor the concentrations of the surface-adsorbed and subsurface (or volume-absorbed) H species as a function of hydrogen pressure in the environment (Fig. 3).
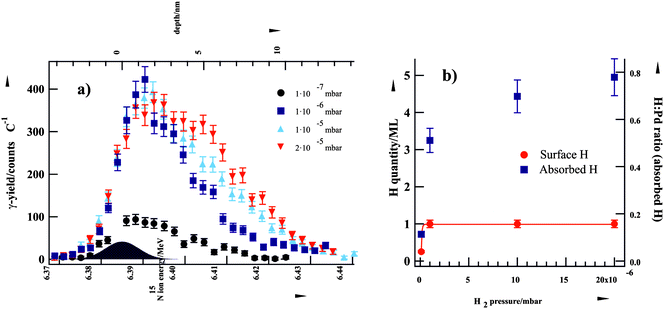 | ||
| Fig. 3 (a) Grazing-incidence NRA yield curves of H in Al2O3-supported Pd nanoparticles at various H2 pressures at 94 K. (b) H2-pressure dependence of surface-adsorbed and cluster-absorbed H (from ref. 13). | ||
Briefly, a highly pronounced pressure dependence was observed for the concentration of subsurface H species in the H2 pressure region relevant for this study (10−7–2 × 10⁻⁵ mbar). In contrast, the saturation coverage of surface H species was reached already below a H2 pressure of 10−6 mbar and this coverage could not be further increased by applying higher H2 pressures. These findings are in agreement with the results of other previous experimental and theoretical studies which indicate that H binds much stronger on the surface (∼0.8 eV per Pd atom) as compared to sites in the subsurface region (∼0.4 eV).26 Additionally, H dissociation on the surface is known to be a non-activated process whereas formation of subsurface hydrogen proceeds through an activated step of H penetration through the surface layer (from here on referred to as subsurface hydrogen diffusion).27,28 These results indicate that the strongly binding surface adsorption state populates first and the population of the subsurface hydrogen depends more strongly on H2 pressure. These experimental observations were complemented by reactivity measurements in pulsed molecular beam experiments, where reaction rates of the competing cis–trans isomerization and hydrogenation pathways were investigated as a function of D2 pressure.13 In combination with the rNRA data, the pulsed molecular beam experiments for probing different reaction pathways clearly show that the second-half hydrogenation requires the presence of subsurface H(D) species. Hence, the overall hydrogenation rate depends on the concentration of subsurface H species.
Having established the nature of the H(D) atoms involved in hydrogenation, one can now explain the observations displayed in Fig. 2. On the initially clean nanoparticles pre-saturated with D2 prior to olefin exposure, both surface and subsurface D species are populated, which results in high initial hydrogenation rates. After prolonged olefin exposure, hydrogenation becomes suppressed most likely because of the depletion of the subsurface D reservoir, which cannot be effectively replenished under the steady state reaction conditions. Apparently, the inability to populate subsurface D arises from hindered D subsurface diffusion under steady state reaction conditions through the surface covered with spectator hydrocarbon species. Since sustained hydrogenation occurs on Pd nanoparticles modified with carbon, it can be concluded that for this system subsurface D can be effectively replenished on the time scale of our kinetic experiments. This observation suggests strong facilitation of hydrogen diffusion into the particle volume through the low-coordinated sites (edges and corners) modified with carbon, which allows a high concentration of subsurface hydrogen species and high hydrogenation rates to be maintained. This hypothesis is corroborated by the experimental observation made in the rNRA experiments showing that a sub-monolayer coverage of carbonaceous species significantly affects the H(D) depth distribution in the Pd nanoparticles.13
In further studies, the proposed facilitation of subsurface hydrogen diffusion through the low-coordinated sites modified with carbon was confirmed both theoretically15 and experimentally.18 In order to reveal the microscopic origin of the proposed C-assisted subsurface H diffusion, we computationally studied (in collaboration with K. Neyman) the activation barriers for hydrogen diffusion into the volume of Pd nanoparticles on C-free and C-containing surfaces.15 It was shown that deposited carbon dramatically enhances the hydrogen diffusion rate into the subsurface region of Pd nanoparticles, mainly due to local elongation of Pd–Pd bonds, which results in a lowering of the activation barrier for subsurface hydrogen diffusion. This dramatic reduction of the activation barrier can account for the experimentally observed unusual promotion of sustained hydrogenation activity by carbon. In contrast, the lateral rigidity of the extended Pd(111) surface was predicted to hinder this effect and does not allow facilitation of subsurface H diffusion by deposited C atoms. This result demonstrates the conceptual importance of the atomic flexibility of sites near nanoparticle edges that, in contrast to intrinsically rigid regular single crystal surfaces, play a crucial role in subsurface hydrogen diffusion on Pd.
As a final step, we provided direct experimental evidence for a faster subsurface H diffusion through C-modified low-coordinated surface sites on Pd nanoparticles.18 To probe subsurface hydrogen diffusion, the H2 + D2 → HD exchange reaction was measured in the temperature regime where this reaction is limited by the formation rate of subsurface H(D) species. The full account of these experiments can be found elsewhere.18 Briefly, it was previously shown by a combination of TPD and rNRA experiments that formation of HD can occur either via recombination of two surface species or via subsurface H or D species.25 The former pathway proceeds only at temperatures above 300 K,29 while the latter pathway dominates at lower temperature (between 200 and 300 K).25 The exact mechanism of how subsurface H(D) species are involved in HD formation is not yet clear. Our experimental results are consistent with a scenario implying that one subsurface atom (H or D) recombines with a surface-adsorbed atom to form HD. In case of slow subsurface H(D) diffusion, the formation rate of subsurface species will be the limiting step in HD production and therefore can be addressed by probing the rate of isotopic scrambling.
Fig. 4 shows the steady state HD formation rates obtained during D2 and H2 exposure for reaction temperatures of 260 and 320 K on clean and C-modified Pd nanoparticles using a range of pressure conditions with a constant D2![[thin space (1/6-em)]](https://www.rsc.org/images/entities/char_2009.gif) :
:![[thin space (1/6-em)]](https://www.rsc.org/images/entities/char_2009.gif) H2 ratio.
H2 ratio.
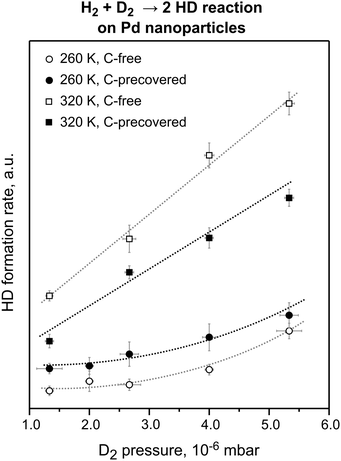 | ||
Fig. 4 The steady state HD formation rates obtained on the pristine and C-precovered Pd nanoparticles supported on Fe3O4/Pt(111) at 260 and 320 K in the D2 pressure range from 1.3 × 10⁻⁶ to 5.3 × 10⁻⁶ mbar. The reactant ratio D2![[thin space (1/6-em)]](https://www.rsc.org/images/entities/char_2009.gif) : :![[thin space (1/6-em)]](https://www.rsc.org/images/entities/char_2009.gif) H2 was kept constant at 71. C deposition resulted in an ∼30% decrease of the HD formation rate at 320 K and in an ∼100% increase of the reaction rate at 260 K (from ref. 18). H2 was kept constant at 71. C deposition resulted in an ∼30% decrease of the HD formation rate at 320 K and in an ∼100% increase of the reaction rate at 260 K (from ref. 18). | ||
C-modification of the nanoparticle edges has a dramatically different effect on the HD formation rate for the two reaction temperatures: whereas at 320 K pre-adsorbed C reduces the overall reaction rate by about 30%, the reaction rate increases by about 100% at 260 K on the C-modified nanoparticles for all pressures studied. The decreased HD formation rate in the high-temperature regime, where HD formation is dominated by the recombination of the surface H and D species, can be easily rationalized as a consequence of the blocking of surface adsorption sites by C. Interestingly, even though parts of the surface are blocked by C, the HD formation rate is significantly increased in the low-temperature regime, where desorption involves at least one subsurface H(D) species. This effect can be explained only by the higher formation rate of the subsurface H(D) species on the C-modified nanoparticles resulting in a higher steady state concentration of subsurface hydrogen species. It should be noted that at the microscopic level, facilitation of subsurface H diffusion through C-modified low-coordinated sites is most likely even more pronounced. Indeed, the nearly 100% increase of the overall reaction rate arises from modification of only ∼20% of the surface sites constituting edges and corners of Pd nanoparticles. Microscopically, this means that the local diffusion rate through these C-modified sites increases by at least an order of magnitude. These results are in excellent qualitative and in good quantitative agreement with the theoretical predictions.15
In summary, the molecular beam experiments on olefin conversions with hydrogen over well-defined Pd nanoparticles supported on Fe3O4/Pt(111) oxide films and Pd(111) allowed us to obtain a comprehensive microscopic picture of hydrogenation and isomerization processes on the nano-structured catalysts (see the model in Fig. 5).
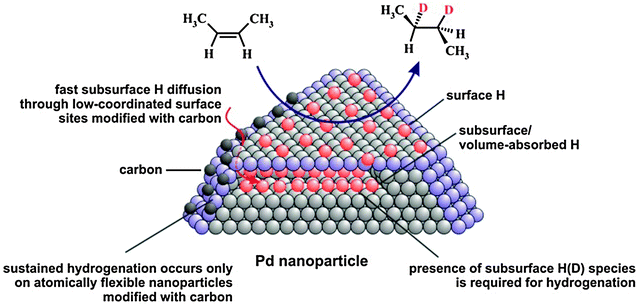 | ||
| Fig. 5 Proposed reaction mechanism of olefin hydrogenation on Pd nanoparticles (from ref. 17). | ||
First, these experiments in combination with the results of NRA for hydrogen depth profiling provide direct experimental evidence that the presence of subsurface hydrogen is required for the hydrogenation pathway and this hydrogen species is involved – directly or indirectly – in the second half-hydrogenation of the alkyl intermediate. cis–trans isomerization of cis-2-butene was observed to be sustained on all investigated surfaces and it was concluded that the presence of only surface H(D) species is sufficient for this reaction pathway. In contrast, the hydrogenation pathway could only be maintained on Pd nanoparticles with low-coordinated surface sites such as edges and corners modified by strongly dehydrogenated carbonaceous deposits/carbon. Neither C-free Pd nanoparticles nor C-free and C-modified Pd(111) surfaces were found to be capable of maintaining the hydrogenation rate under the steady state reaction conditions. We ascribe this promoting effect of C on Pd nanoparticles to pronounced facilitation of subsurface hydrogen diffusion into the volume of Pd nanoparticles through C-modified low-coordinated surface sites. Enhanced subsurface diffusion most likely allows effective replenishment of the reservoir of active subsurface H(D) species and thus sustained hydrogenation. Computational results support this hypothesis and show that carbon deposition near nanoparticle edges results in a lattice expansion and a concomitant elimination of the activation barrier for hydrogen subsurface diffusion. The atomic lateral flexibility of Pd nanoparticles was identified as a crucial factor for allowing pronounced facilitation of subsurface hydrogen diffusion, an effect that is absent on the laterally rigid Pd(111) surface. Experimentally, the rate of subsurface hydrogen diffusion was addressed by the H2 + D2 → HD exchange reaction in the low temperature regime where this reaction is limited by the formation rate of subsurface H(D) species. In agreement with theoretical predictions, evidence of a pronounced enhancement of the H subsurface diffusion rate through C-modified low-coordinated sites by about an order of magnitude was observed as compared to C-free nanoparticles.
These new insights allowed us to identify an exceptionally important role of carbonaceous species in the hydrogenation chemistry on nano-structured catalysts. Small amounts of carbon adsorbed at the low-coordinated surface site of Pd nanoparticles allow for effective replenishment of subsurface hydrogen under steady state conditions and thus enable sustained hydrogenation, which is critical for controlling the overall selectivity between the two pathways. Our results also highlight the crucial role of subsurface hydrogen diffusion, which is a strongly structure sensitive process on Pd surfaces, in hydrogenation of the olefinic bond.
Case study 2: charge transfer-reactivity relations for supported nanoparticles: from ultrathin oxide films to doped oxides
During the eighties of the last century, Masatake Haruta discovered the exceedingly high activity of supported Au nanoparticles of not more than 3 nm diameter in CO oxidation. This observation triggered an intense search for the causes, and Wayne Goodman's group presented the first conclusive model studies for small Au particles supported on TiO2(110).30 Scanning tunneling microscopy studies on those systems indicated an interesting morphology, expressing itself in two-layered raft-shaped Au islands. Their activity increases at a size below 3 nm, and even increases further when the bulk oxide, as a support, was replaced by an ultrathin oxide film grown on a single crystalline metal support. The evidence is summarized in Fig. 6.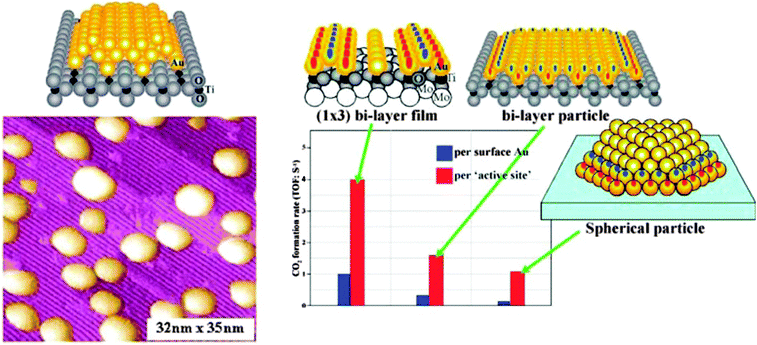 | ||
| Fig. 6 Collected results for Au/TiO2 model catalysts from the Goodman group. Left: STM images of Au particles on TiO2(110); right: rates of CO oxidation on different schematically represented systems.31 | ||
Also, images produced with high-resolution aberration correction transmission electron microscopy of Au particles in materials used in real catalysis suggested the raft-like morphology of the particles.32 On the one hand all this evidence was interesting, but it also gave rise to an important question, which is connected with the results of a theory paper published by Pacchioni and Landman:33 as depicted in Fig. 7 Au20 keeps its pyramidal shape when supported on a bulk MgO(100) single crystal. If the same Au20 cluster is deposited on a thin double layer of MgO(100)on Mo(100) it takes the shape of a flat, single layer Au raft.
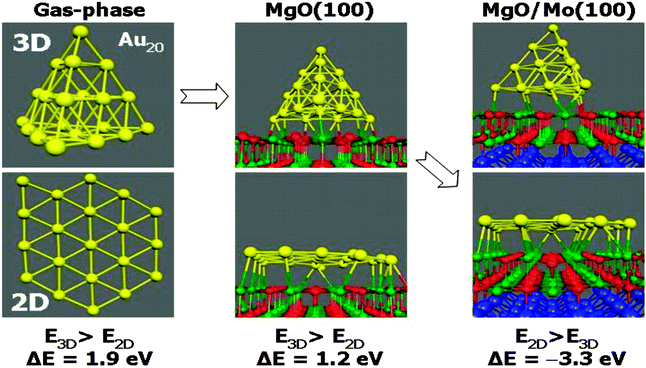 | ||
| Fig. 7 Schematic representation of results of DFT total energy calculations on Au20 in the gas-phase, after supporting on a bulk MgO(100) crystal, and on a double layer MgO(100) film on Mo(100).33 | ||
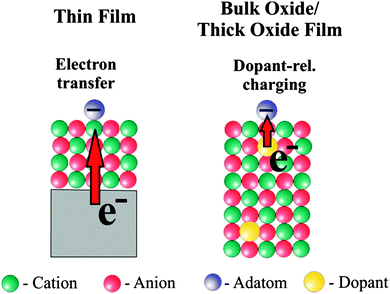
According to the calculations the reason for a change in morphology can be clearly traced back to electron transfer from the oxide film–metal interface to the electronegative Au, which tries to optimize contact to the oxide film in turn, while on the bulk oxide there is no driving force for such a behavior. Thus, the puzzling question is: “what drives the formation of raft-like structures on bulk oxides?” In order to solve this puzzle we studied Au adsorption on thin oxide films as a function of coverage and chemical modification of the film by dopants, which we will report in the following. The approach is schematically shown in Fig. 8. In the left panel the electron source for e-transfer is the oxide–metal interface, and in the right panel a properly chosen dopant in a bulk material takes this role.
From single metal atoms to clusters and thin films
Adsorption on defect-free oxides is generally weak given the high degree of bond saturation at their surface and the large gap that governs their electronic structure.34–40 Metal atoms deposited onto pristine oxides have essentially two means to interact with the surface. The first one being accessible to all atoms arises from van-der-Waals or dispersive forces, i.e., the ad-atom gets polarized in the Madelung field of the oxide and experiences dipolar coupling to the surface. Depending on the atom polarizability, the resulting adsorption energies are of the order of 0.5 eV or below for a single atom. The second interaction channel that is relevant for open-shell d and f-elements is direct hybridization between orbitals of the ad-species and the oxide surface.A combination of scanning tunneling microscopy, electron spin resonance spectroscopy, and IR-spectroscopy as shown in Fig. 9 is well suited to prove this point.
The presence of single gold atoms on the surface of a thick MgO film was proven by electron paramagnetic resonance (EPR) spectroscopy.38 The EPR spectrum is characterized by a quartet of lines caused by the hyperfine interaction of the electron spin (S = 1/2) with the nuclear spin (I(197Au) = 3/2; 100% natural abundance) of the neutral gold atoms (Fig. 9a). A detailed analysis of angular-dependent EPR spectra allows determination of the magnetic interaction parameters (g and hyperfine matrix) and proves the Au atoms to be located on terrace sites of the MgO(001) surface. This is in perfect agreement with low-temperature scanning tunneling microscopy (STM) results (Fig. 9b).38 By analysis of the additional superhyperfine interaction with O of an 17O enriched MgO film, the Au atoms were shown to adsorb on top of oxygen ions in agreement with theoretical predictions.41–43 Important information on the electronic structure is encoded in the hyperfine tensor components. Compared with that of Au atoms in the gas phase, the isotropic part of the hyperfine interaction, associated with the spin density at the nucleus, is reduced by about 50%, pointing to a significant redistribution of electron density upon binding to the surface. There are different scenarios conceivable to rationalize this finding including a charge transfer onto the Au atom. DFT calculations showed, however, that this effect is due to polarization of the singly occupied 6s orbital of neutral Au atoms away from the MgO surface.38
Infrared (IR) spectroscopy is often used to obtain information on the properties of metals employing simple probe molecules such as CO. This strategy was extensively applied to characterize supported gold catalysts (ref. 44 and references therein). When this strategy was applied to the previously discussed system, the infrared spectra taken after saturating Au with CO result in two IR bands centered at 2120 and 1852 cm−1 (Fig. 9c).45 The former signal can be assigned to CO adsorbed on small neutral Au clusters, whereas the latter one, red-shifted by 291 and 180 cm−1 compared with gas-phase CO and the Au–CO complex,46 respectively, is associated with single Au atoms. The large red shift, indicating a significant charge transfer into the π*-orbital of the CO, is usually interpreted as an indication for negatively charged Au atoms, which was proven (see above) not to be the case. A detailed theoretical analysis of this system reveals that the large red shift is caused by the largely polarized valence electron of the adsorbed Au atoms, which creates an Auδ+COδ− complex on the surface. This shows that particularly for atoms or very small clusters, probe molecules such as CO may fail to properly report on the properties of the underlying metal.47
The strongly polarized adsorption of Au atoms on top of oxygen anions of a MgO surface can be understood in a straightforward manner, keeping in mind the large polarizability and the high electronegativity of Au atoms.
A first hint for the formation of charged adsorbates on thin oxide films came from low-temperature scanning tunneling microscopy (STM) experiments performed on 3 ML MgO/Ag(001) exposed to small amounts of Au.37 Whereas on bulk oxides, gold shows a strong tendency for aggregation, mainly isolated atoms are detected on the thin film even at high gold exposure. Moreover, the ad-species self-assemble into a hexagonal superlattice on the film surface, with the Au–Au distance depending exclusively on the coverage (Fig. 10A).
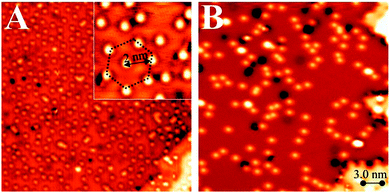 | ||
| Fig. 10 STM image of (A) single Au and (B) single Pd ad-atoms on a 3 ML thick MgO film grown on Ag(001) (30 × 30 nm2). While the negatively charged Au atoms self-assemble into a hexagonal pattern (see inset), the neutral Pd atoms are randomly distributed on the oxide surface and show a large tendency to aggregate into clusters. A negative charge on the Au species is also compatible with a distinct sombrero-like shape observed in low-bias STM images. Black dots in both images are attributed to defects in the oxide film.48 | ||
This unexpected ordering effect provides the first evidence for the charged nature of the Au atoms on MgO films, as equally charged species tend to maximize their interatomic distance in order to reduce the mutual Coulomb repulsion. A similar phenomenon was found for alkali atoms on metal and semiconductor surfaces before and was assigned to a positive charging upon adsorption.49–51 Conversely, the Au atoms on the MgO films charge up negatively, as their 6s orbital gets filled with electrons from the Ag(001) support below the oxide spacer layer. The charge exchange is enabled by the high electronegativity of gold in combination with a small work function of the Ag–MgO system, both effects promoting an electron release towards ad-gold.52,53 The experimentally deduced charging scenario was corroborated by DFT calculations that computed a Bader charge of −1|e| at the Au atoms in addition to the expected increase in binding energy.48
However, charge-mediated adsorption on oxide thin films is rather the exception than the rule and requires a favorable electronic structure of the adsorbate. Counter examples are Pd atoms, which, in contrast to Au atoms, do not possess a low-lying affinity level that can be filled with extra electrons from the MgO/Ag support. In fact, the Pd 5s, as the lowest-unoccupied atomic orbital, is located well above the Fermi level of the thin-film system and is therefore not accessible to electron transfer. As a result, the Pd atoms remain neutral upon adsorption and do not experience any self-ordering on the MgO surface (Fig. 10B).54 Apart from their random distribution, the Pd atoms exhibit a high tendency to assemble into small aggregates even at low coverage, mimicking the anticipated binding behavior of metals on bulk oxides in the absence of charge transfer. Charge-driven adsorption schemes were observed for many other thin-film systems, using not only metal adatoms but also molecular species.55,56 Particularly interesting in this context are experiments on a 5 Å thick alumina film grown on NiAl(110),57 as the results provide direct insight into the direction of the charge transfer and the number of exchanged electrons (Fig. 11).58
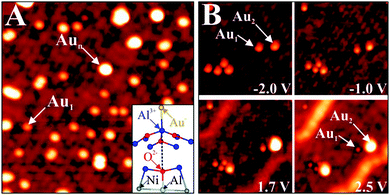 | ||
| Fig. 11 (A) STM image of Au monomers and small aggregates on alumina/NiAl(110) (−1.5 V, 18 × 18 nm2). The inset shows a ball-and-stick model of a monomer bound to an Al surface ion. (B) Image series, showing a small alumina region as a function of bias voltages (15 × 15 nm2). The various Au species undergo large contrast changes as a function of the imaging conditions.59 | ||
Although charge transfer into the Au atoms prevails also in this case, the interaction involves a certain bond reorganization in the oxide and therefore deviates from the more simple MgO/Ag(001) case.48 The Au atoms bind exclusively to Al3+ ions in the alumina surface, and no adsorption to anionic lattice sites is revealed (Fig. 7A). Upon bond formation, the Al ion below the gold is lifted above the surface plane. This upward motion of the Al3+ leads to a homolytic rupture of the bond to the oxygen in the layer beneath. The Au atom takes up the electron donated by the Al ion, while the electron deficiency at the oxygen is balanced by back-bonding it to an Al atom in the NiAl(110) metal surface. The involvement of the metal substrate thus reinforces the interaction between adatom and surface, whereby not only charges are shuttled through the oxide, but the film reorganizes its internal bonding network in order to accommodate the gold. In numbers, participation of the NiAl support leads to an increase of the Au/alumina adsorption strength from 1.0 to 2.1 eV, emphasizing once more the importance of charge transfer.58 It should be added that the Au-induced bond cleavage in the alumina film can be considered as an extreme form of a polaronic lattice distortion, being a typical response of an ionic oxide to stabilize charged adsorbates on its surface.60
The charge transfer that governs the binding of Au monomers to oxide thin films affects also the aggregation behavior of the gold at higher exposure. At cryogenic temperature, aggregation of equally charged ad-atoms is inhibited due to the Coulomb repulsion, giving rise to the formation of ordered ad-atom patterns as shown in Fig. 10A. The repulsion is overcome, however, when dosing the gold at elevated temperature, e.g. 100 K. In this case, the Au atoms assemble into 1D atom chains at low coverage, as observed on both magnesia61,62 and alumina films.63 The smallest aggregate is a flat-lying dimer with 9 Å apparent lengths, while longer chains contain between three and seven atoms and are 12 to 22 Å long (Fig. 12).
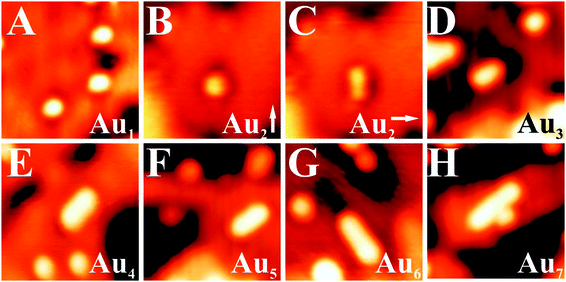 | ||
| Fig. 12 STM images of Au monomers, dimers and different chains on 2 ML MgO/Ag(001) (−0.4 V, 19 × 19 nm2). For the dimer, an upright (Au2↑) and a flat-lying isomer is observed (Au2→).62 | ||
The development of 1D chains on thin films is in contrast to the common behavior on bulk oxides, where 3D clusters are energetically favorable at any coverage due to the weak metal–oxide adhesion.64,65 The development of Au atom chains seems unexpected at first glance as the number of stabilizing Au–Au bonds is small with respect to 2D and 3D aggregates. However, the linear atom arrangement is in agreement with the charged nature of the aggregates. Similar to the monomer case, electron transfer through the oxide film into the Au cluster is active and increases the electrostatic coupling to the oxide lattice. Conversely, the charge transfer leads to a Coulomb repulsion in the aggregate that may be minimized when the extra electrons are separated over large distances. Minimization of Coulomb repulsion in electron-rich aggregates is therefore the fundamental reason for the development of 1D cluster shapes, and no 1D chains are to be expected in the absence of charge transfer through the oxide films.61,62 Also for Au aggregates bound to MgO/Ag(001)61 and MgO/Mo(001) films,66 the concept of charge transfer has been verified by DFT calculations. Two configurations have been identified for the Au dimer, a neutral and upright one that binds to an O2− ion in the MgO surface and a flat lying, negatively charged species (Bader charge −0.8|e|) that bridges two Mg2+ or two hollow sites. The flat lying configuration is thermodynamically preferred by 0.34 eV, a finding that explains its abundance in STM images of the MgO film (Fig. 12).61 The preference of charged over neutral Au clusters becomes even more pronounced for larger aggregates.62 A Au3− chain for example (Bader charge −1|e|) has a higher binding energy than various neutral isomers (Fig. 13).
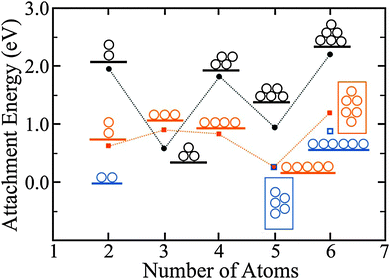 | ||
| Fig. 13 Attachment energies to form the displayed Au clusters, calculated for bulk MgO(001) (black circles) and 2 ML MgO/Ag(001) films (orange squares). The blue squares depict the second most stable isomers on the thin film. On the oxide film, linear configurations are energetically preferred up to Au5, when planar isomers become more stable. The odd–even oscillations in the attachment energy are related to the high energy of open-shell systems containing an unpaired electron. They are less pronounced on thin MgO films due to the screening influence of the Ag support.62 | ||
This finding holds for Au tetramers, where a doubly charged Au4 chain (Bader value: −1.6|e|) is energetically preferred over different rhomboidal structures that can be found on bulk MgO(001). Note that the two extra electrons in the Au4 chains are localized at the terminal atoms, emphasizing the shape-determining role of the Coulomb repulsion. With increasing atom count, 2D Au aggregates gain stability with respect to 1D configurations, as the formation of additional Au–Au bonds outweighs the energy surplus due to charge delocalization.62 Whereas a doubly negatively charged Au52− chain is still iso-energetic with a flat-lying Au52− sheet on MgO/Ag(001), a 2D Au6 island has already a lower energy than the corresponding linear structure (Fig. 13). The critical atom number at which the 1D → 2D dimensionality crossover occurs has been determined to be five/six, both in experiment and theory.
The charge transfer through a thin oxide spacer prevails also for larger Au aggregates and keeps controlling their geometry and electronic structure. On 2 ML MgO/Ag(001) films, for example, gold first forms flat, single-layer islands and develops a nearly complete wetting layer with increasing exposure (Fig. 14).37 The formation of 2D islands is in sharp contrast to the 3D growth that is typically observed on bulk oxides.38,64,67 It reflects the tendency of gold to increase the contact area with the oxide film, as this maximizes the charge transfer into the gold affinity levels, and hence the strength of the metal–oxide adhesion. Similar to Au monomers and chains, the reinforcement of the Au bonding results from increased electrostatic and polaronic interactions upon charge transfer.33 As a rough number, the average charge transfer per ad-atom has been calculated to be −0.2|e| for a close-packed Au layer on 2 ML MgO/Ag(001).68
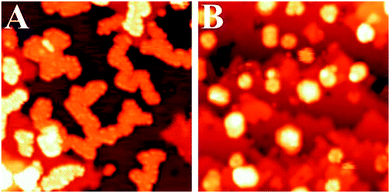 | ||
| Fig. 14 STM images of Au deposits on (A) 3 ML and (B) 8 ML MgO/Ag (001) (30 × 30 nm2). Due to the charge-mediated adhesion, Au wets the ultra-thin MgO film. In the case of thicker films, the electron transfer is inhibited and 3D gold particles form on the oxide surface.37 | ||
Especially in larger 2D gold islands, the excess electrons are not homogeneously distributed but show a preference to accumulate at the island perimeter.69 The reason for this particular charge distribution is similar to the one that leads to the development of 1D chains at small atom numbers. The excess electrons repel each other, which increases the internal Coulomb repulsion in the island and hence the total energy. To minimize this Coulomb term, the extra charges maximize their mutual distance, which promotes their localization along the island edges. The presence of a negatively charged perimeter can be deduced directly from STM conductance maps of the 2D Au islands, as shown in Fig. 15. Especially around the Fermi level, the island edges appear with enhanced dI/dV contrast, indicating a higher density of states as compared to the island interior. The contrast enhancement at the edge is compatible with specific edge states that enable accommodation of the extra electrons that have been transferred through the oxide film into the gold sheets. This mechanism has been corroborated by tight-binding DFT calculations, which allow for an explicit treatment of the atomic structure and the edge configuration even of extended metal nanostructures.69 Also, the computed charge-density plots unambiguously demonstrate the localization of electronic states along the island perimeter (Fig. 15). These states are able to store one extra electron per low-coordinated edge atom and get filled up with transfer electrons although the island interior remains neutral. The charge localization in the low-coordinated edge atoms renders the 2D Au islands supported on thin oxide films particularly interesting for adsorption and chemical reactions involving electron-accepting molecules (Lewis acids).70
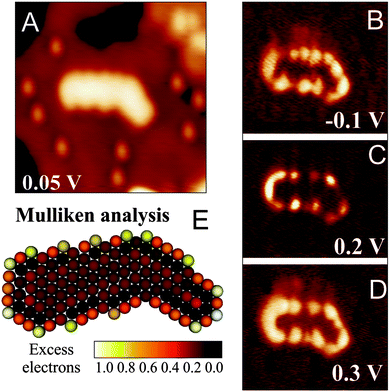 | ||
| Fig. 15 (A–D) STM topographic image and dI/dV maps of a planar Au island on 2 ML MgO/Ag(001) taken at the indicated bias voltage (US = 0.2 V, 25 × 25 nm2). (E) Corresponding charge distribution as calculated with a density functional tight binding approach.69 | ||
For flat Au islands on MgO/Ag(001), STM conductance spectroscopy can be exploited to determine their charge state.68 The development of distinct quantum well states (QWS) is a necessary precondition for this analysis, whereby symmetry and electron filling of the QWS have to be compared to the findings in neutral aggregates. As electron confinement in a 2D potential is sensitive to structural irregularities, Au islands with suitable QWS need to be highly symmetric and free of defects.
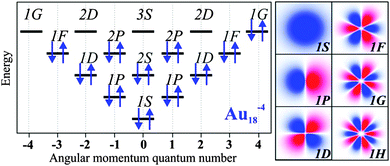
A particularly instructive example shows an ultra-small Au cluster with ∼10 Å diameter and 0.8–0.9 Å apparent height grown on a 2 ML MgO/Ag(001) film (Fig. 16).68 In low-bias STM images, mainly the cluster morphology is revealed, as no eigenstates of the aggregate are available in the probed energy window. At slightly higher bias, the apparent cluster height doubles and flowerlike protrusions emerge in the image. This bias-dependent contrast change provides evidence that tunneling is now governed by the electronic and not the topographic properties of the nanostructures. More precisely, a distinct eigenstate, the LUMO of the Au aggregate, becomes accessible to the tunneling electrons and dominates the image contrast at positive bias. A similar observation is made at negative bias, when the Au HOMO moves into the bias window and a comparable “nano-flower” becomes visible in the STM. The two observed QWS closely resemble the eigenstates of a free-electron gas confined in a 2D parabolic potential (Fig. 17). They are derived from the Au 6s states of the participating atoms and preserve their characteristic symmetry, as they do not mix with either the states of the wide-gap oxide or with the Au 5d and 6p states positioned at much lower or higher energy, respectively.71,72 The symmetry of the states is defined by the angular momentum quantum number m, being a measure of the number of nodes in the electron-density probability.73 The two lowest QWS in Fig. 17 feature four nodal planes, which corresponds to an m of 4 or, equivalently, to a state with G-symmetry.
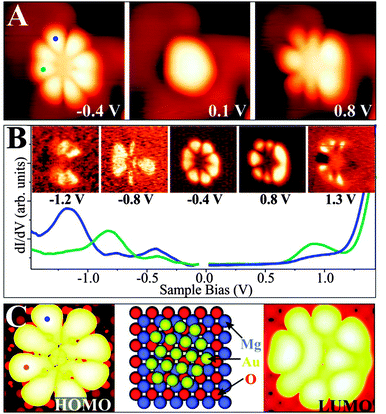 | ||
| Fig. 16 (A) Topographic and (B) dI/dV image of a symmetric Au cluster on 2 ML MgO/Ag(001) taken at the given sample bias (3.9 × 3.9 nm2). The corresponding dI/dV spectra are shown in addition (blue and cyan curves: top and left part of the cluster). (C) Calculated HOMO and LUMO shape, as well as the structure model of an Au18 cluster on MgO/Ag(001). Perfect match between experimental and theoretical cluster properties indicates the identity of both aggregates.68 | ||
However, the STM reveals not only the symmetry of eigenstates, but via the spectroscopic channel also their energy position. For the Au cluster shown in Fig. 16, the HOMO and LUMO are clearly identified as dI/dV peaks at −0.4 and +0.8 V, respectively, separated by a region of zero conductance of 1.0 V width (blue and cyan curves: top and left part of the cluster). Also higher QWS show up in the dI/dV spectra of the cluster. The HOMO − 1 at −0.8 V and the HOMO − 2 at −1.2 V are both of P-symmetry with nodal planes pointing in two orthogonal directions. Note that higher and lower states cannot be resolved as an increasing overlap with the MgO electronic states renders their identification difficult. With this experimental input, the electronic structure of the gold nano island and more importantly its charge state can be determined by comparing the measured orbital shapes with DFT calculations for possible sample clusters.68 Following an extensive theoretical search, the experimental signature shown in Fig. 16 could be matched with the properties of a planar Au18 cluster. Its structure is derived from a magic-size Au19 cluster with one missing corner atom. In agreement with experiment, the HOMO and LUMO are two 1G orbitals located in the fifth shell of the harmonic potential, whereas the HOMO − 1 and HOMO − 2 are the 2P-like QWS in the fourth shell (see the level scheme in Fig. 17). The missing atom with respect to a symmetric Au19 gives rise to a slight asymmetry in the orbital shapes that becomes particularly evident for the LUMO. Counting the number of orbitals from the 1S-like ground state to the 1G HOMO, as plotted in Fig. 17, we find eleven filled valence states for the Au18 cluster being occupied by a total number of 22 s-electrons. As each of the 18 Au atoms adds only a single 6s electron to the delocalized QWS, there is a difference of four electrons to the total electron count. As discussed before, the missing electrons are introduced via charge transfer from the MgO/Ag interface into the Au island. This charging effect is corroborated by a DFT Bader analysis, yielding a value of −3.54|e| for the Au18 cluster, but matches also the average transfer of −0.2|e| per atom as calculated for dense-packed Au layers on thin MgO films.68 Similar procedures have been carried out for many other Au aggregates on the MgO–Ag(001) system.68 In all cases, a negative charging has been revealed, verifying the charge-mediated binding concept for Au islands on thin oxide films.60,65,74 Interestingly, the accumulated charge per Au atom is generally lower in 2D aggregates as compared to 1D chains, which might be rationalized by the higher efficiency of the linear systems to distribute the excess electrons and to lower the internal Coulomb repulsion.62 The energetic preference for chains diminishes, however, for clusters containing more than 6–7 atoms, inducing a crossover to 2D island shapes and later to 3D structures.
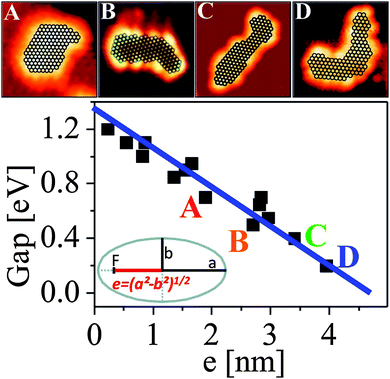
Also, the closing of the HOMO–LUMO gap as a function of particle size and shape may be addressed if one knows the atom count in the aggregate. While the latter is deducible from the apparent size of the STM imaged particle75 a proper plot of the measured energy gap as a function of a size and shape related parameter is not straightforward. A suitable descriptor for evaluating the electronic structure of an object is the linear eccentricity, being related to the relative position of the two foci of an ellipse with respect to its center as shown in Fig. 18. This parameter scales with both the atom count and shape of the particle, and therefore combines size and symmetry aspects. The particles A–D in Fig. 18 contain all around 130 atoms, but still their HOMO–LUMO gap varies between 0.2 and 0.6 eV. The overall size range coincides, however, with the region of gap closure, where the onset of metallicity as measured through transport properties would be observed.
In summary, the charge-mediated binding scheme of metals to oxide films is closely related to the possibility to transfer electrons through the insulating spacer. The dominant transport mechanism is electron tunneling from the Fermi level of the metal substrate through the oxide layer. The tunneling probability depends exponentially on the oxide thickness, and to a smaller extent on the gap size, as already discussed by Cabrera and Mott.33,76 As an interesting consequence, the growth regime of Au on thin oxide films might be altered, simply by increasing the film thickness until tunneling transport becomes impossible.37 Whereas only 2D islands are found on 3 ML MgO/Ag(001) films, a dimensionality crossover to 3D particles occurs on 8 ML films that do not support charge transfer anymore.38 These experiments have been reproduced by DFT calculations, addressing the shape of Au8 clusters on 2 and 5 ML thick MgO/Ag(001) films.33 With increasing oxide thickness, the amount of charge transfer was found to decrease by 50%, causing the interfacial adhesion to drop from 0.7 to 0.35 eV per interfacial atom. As a result, the initially planar Au8 cluster turned 3D on the thicker film in order to increase the number of Au–Au bonds and to counterbalance the loss in interfacial adhesion. Both experiments and theory therefore confirm the importance of charge transfer in determining the growth shape of metals on thin-film systems.
Metal growth on doped oxide materials
The former paragraphs have demonstrated how the equilibrium shape of metal particles on oxide supports depends on the charge state of the deposits. It turned out that charged species, either single atoms or small aggregates, tend to bind stronger to ionic oxides, as they exhibit additional electrostatic and polaronic interaction channels that are not available for neutral entities.33,53 However, the concept of charge-mediated control of the metal–oxide adhesion seems to be restricted to ultrathin films, as the extra electrons are provided by a metal substrate and need to tunnel through the insulating spacer layer. In contrast, the request to tailor the equilibrium shape of metal particles becomes particularly large on bulk oxides as used in heterogeneous catalysis, reflecting the large dependence of the chemical behavior of metal–oxide systems on the particle shape.77–80 The relation between chemical reactivity and geometry of the active metal species has been explored in detail for gold.81 Raft-shaped Au islands on iron oxide, for example, have been identified as the active entities in the low-temperature oxidation of CO.82,83 Also in the Au–TiO2 system, bi-layer deposits turned out to be the most active.30,84 Both results suggest a special role of the perimeter sites of metal deposits, which enable molecules to interact simultaneously with the metal and the oxide support. As those sites are most abundant on flat metal islands, a close interrelation between structure and reactivity is not surprising. We note in passing that the shape affects also other fundamental properties of metal deposits, e.g. their electronic structure and optical response,85,86 which renders a careful shape control relevant for applications in microelectronics, nano-optics, and photo-catalysis as well.One possibility to extend the concept of charge-mediated particle growth to bulk oxides is the insertion of suitable charge sources directly into the oxide material, preferentially into a near-surface region to allow for charge exchange with adsorbates. By this means, all advantageous effects of charge control could be maintained for oxide slabs of arbitrary thickness. The fundamental approach to insert charge centers into a material is doping, and the underlying concepts have been introduced and brought to perfection already in the mature field of semiconductor technology. Surprisingly, the art of doping is less advanced to what oxide concerns, which relates to a number of peculiarities in these materials. Oxides are subject to self-doping either by native defects or by unwanted impurities, the concentration of which is difficult to control experimentally.87 Both lattice defects and impurity ions may adopt different charge states in the oxide lattice,88,89 a variability that leads to pronounced compensation effects and is less common in semiconductors. And finally, the dopants may be electrically inactive in a wide-gap insulator, as thermal excitation is insufficient to promote electrons from defect states into bulk bands. As a result, the excess charges remain trapped at the host ions and are unavailable for charge transfer. The following examples demonstrate, however, that doping is a versatile approach to control the growth of metals even on bulk-like oxide materials.39,40,90–94 The underlying concepts are thereby similar to the charge-transfer picture developed for thin films before.
In general, doping is carried out with impurity ions that adopt either a higher or a lower valence state than the substituted ions in the oxide lattice. In rare cases, also charge-preserving doping is realized, and geometric and strain effects, and not charge transfer, become relevant in these cases. Whereas high-valence dopants may serve as charge donors and provide extra electrons, undervalent dopants have acceptor character and may accommodate electrons from suitable adsorbates. Based on the above considerations we now expect that charge donors in an oxide lattice have a similar influence on the particle shape as the metal support below a thin oxide film.
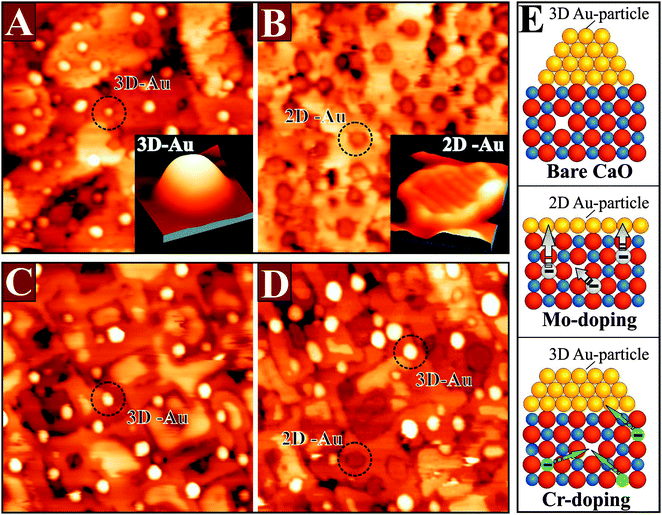
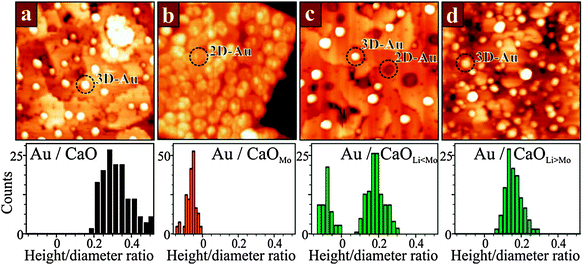
The impact of doping on the growth morphology of gold has first been realized for crystalline CaO(001) doped with Mo in the sub-percent range.95 On the doped oxide, gold was found to spread out into extended monolayer islands, while the conventional 3D growth regime prevailed on pristine, non-doped material (Fig. 19). Evidently, the donor character of the Mo dopants is responsible for the 2D growth morphology, as the bare CaO(001) surface interacts with gold only weakly.
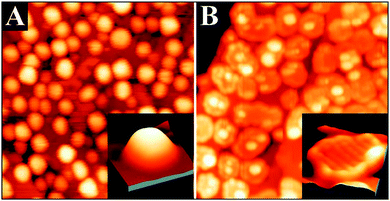 | ||
| Fig. 19 STM images of 0.7 ML Au dosed onto (A) pristine and (B) doped CaO films (4.5 V, 50 × 50 nm2). The insets display close-ups of two characteristic particles (−5.0 V, 10 × 10 nm2). | ||
The Mo-impurity ions mainly occupy Ca substitutional sites and, in the absence of gold, adopt the typical 2+ charge state of the rock salt lattice in order to maintain charge neutrality. In the 2+ configuration, four Mo 4d electrons are localized in the dopant, three of them occupying (t2g-α) crystal field states and one sitting in a (t2g-β) level close to the upper end of the CaO band gap (Fig. 20).95
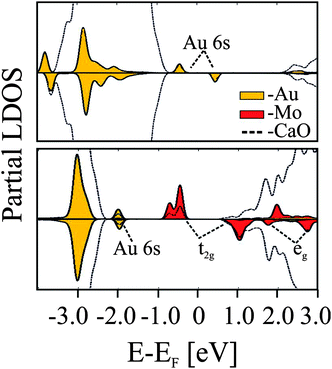 | ||
| Fig. 20 PBE projected state-density calculated for non-doped (top) and doped (bottom) CaO films in the presence of an Au adatom.95 | ||
Especially, the latter one is in an energetically unfavorable position and therefore susceptible to be transferred into an acceptor state with lower energy. Such states are now provided by the Au atoms that exhibit half-filled Au 6s levels at lower energy. DFT calculations revealed a spontaneous transfer of the topmost Mo 4d-electron into the Au 6s affinity level, resulting in the formation of an Au− anion (Fig. 20). As discussed for the thin films, the charged gold experiences reinforced bonding to the CaO surface, reflected by the increase of the binding energy from ∼1.5 eV without to ∼3.5 eV with Mo dopants in the film. We emphasize that the charge transfer does not require the presence of a Mo ion in the surface and remains active over relatively large Mo–Au distances of up to ten atomic planes.
The increase of the metal–oxide adhesion due to dopant-induced charge transfer fully explains the 2D growth regime of gold observed in the experiment. Gold tends to wet the CaO surface in an attempt to maximize the number of exchanged electrons, hence the interfacial interaction. Further DFT calculations suggested that also a Mo3+ species that has already lost one electron remains a potential donor, as two of the residual d-electrons are still higher in energy than the Au 6s affinity level.96 Consequently, even a second and third electron may be transferred into the ad-metal, leaving behind thermodynamically stable Mo4+ and Mo5+ ions in the CaO lattice. It is this behavior of the Mo ions that is responsible for the robust donor behavior of Mo-doped CaO.95
The presence of suitable dopants is, however, not the only requirement for a stable donor characteristic, and also the interplay between dopants and host oxide determines the redox activity. This shall be demonstrated for a similar system, Cr-doped MgO, which exhibits an entirely different behavior.96–98 Chromium has a similar electronic structure as Mo, i.e., the same number of d-electrons, but is a 3d and not a 4d metal. Surprisingly, it is unable to influence the Au growth behavior on the MgO support (Fig. 21).
Even at high Cr concentration, the 3D growth of gold prevails and hardly any 2D islands are found on the surface. The reason for this poor behavior is the low energy position of the Cr t2g levels in the MgO band-gap, which originates from the substantial stabilization of the Cr 3d-electrons in the MgO crystal field. Note that the crystal field in MgO is substantially stronger than in CaO, due to the reduced lattice parameter.99 In addition, the ionization energies of Cr atoms are higher than for Mo, which makes formation of Cr4+ and Cr5+ ions energetically more expensive.100 As a result, Cr is able to donate at maximum one single electron to gold, which compares to three for the Mo dopants in CaO.96 Moreover, this electron may not even reach the ad-metal, because it is likely to be captured by parasitic electron traps that are present in real oxides. Typical electron traps are cationic vacancies, e.g. Mg defects, domain boundaries, or dislocation lines.101 The cationic defects (V-centers) preferentially develop in oxides with a large number of high-valance dopants, as they are able to compensate the additional charge state of the impurities with respect to the intrinsic ions.99 According to DFT calculations, the formation energy of V-centers decreases from more than 8 eV in bare CaO and MgO to 1.0–1.5 eV in the presence of high-valence dopants.96 As a result, internal compensation effects become favorable, in which every dopant in the lattice produces a balancing vacancy. While this internal compensation remains insufficient to cancel the donor potential of Mo ions, it annihilates the effect in Cr-doped MgO. Consequently, no charge-mediated changes in the Au growth morphology are observed for Cr–MgO, although the effect is huge for Mo-doped CaO (Fig. 21). One conclusion from these results is that the donor behavior of a transition-metal-doped oxide cannot be predicted by simple valence arguments but needs to be checked in every single case.
The influence of overvalent dopants on the equilibrium morphology of metal particles can, to a certain extent, be annihilated by undervalent dopants in the oxide lattice (Fig. 22).102,103
Dopants with lower charge state generate holes in the oxide electronic structure that are able to trap the extra electrons provided by the charge donors. This mutual compensation between donors and acceptors has been explored for CaO films co-doped with Li and Mo ions.104 At low Li concentration with respect to Mo, most of the Au particles still adopt 2D shapes, indicating a prevailing charge transfer into the gold. With increasing Li doping level, however, more deposits turn 3D, as the ad-particles are unable to accumulate enough excess charges from the Mo donors (Fig. 22c and d). The extra electrons are trapped by lattice defects that arise from the presence of Li in the lattice. Every monovalent Li+ ion sitting in a Ca2+ substitutional site produces a deep hole in the O2p states of an adjacent oxygen forming an effective trap for the Mo 4d electrons. As a result, charge transfer to the surface ceases at a critical Li doping level and the Au deposits adopt the typical 3D geometry of pristine CaO films.
We note that pure hole-doping could not be realized in the experiments so far. Neither MgO nor CaO films, doped exclusively with Li, were found to alter the morphology and electronic structure of gold, and no sign for the generation of positively charge ad-species was obtained. This finding is in agreement with the occurrence of intrinsic compensation mechanisms in the oxides that remove the energetically unfavorable holes produced by the Li+ species. Even in well-prepared oxide films and under perfect vacuum conditions, competing electron sources are present, such as electron-rich oxygen vacancies (Fo centers) and donor-type adsorbates from the rest-gas (water, hydrogen).102,103,105,106 Hole doping of oxides as a means to tailor the properties of metal ad-particles is therefore more difficult to realize than electron doping with donor-type impurities. Interestingly, the competition for excess electrons occurs not only in Mo and Li co-doped films but is observed also in the presence of electron-accepting adsorbates on the oxide surface. Gold forms monolayer islands if deposited onto a Mo-doped CaO under vacuum conditions, but 3D particles if oxygen is present during growth. The reason is that O2 molecules bound to the surface act as electron acceptors and trap charges in their O 2π* antibonding orbitals. These electrons are lost for the Au islands, resulting in a gradual transition from a 2D to a 3D growth regime with increasing O2 partial pressure. Whereas in 5 × 10⁻⁷ mbar of oxygen, 50% of the Au islands still adapt monolayer shapes, all Au deposits turn 3D when grown in a 5 × 10⁻⁵ mbar O2 background. The interplay between the observed growth mode and the composition of the gas environment emphasizes the pivotal importance of excess electrons from donor species for the reactivity of oxides towards adsorption of metallic and gaseous species.
In summary, doped bulk oxides display in many aspects similar adsorption properties as ultrathin oxide films. In both systems, excess electrons are transferred into the ad-species and open up specific charge-mediated adsorption schemes. Whereas for ultrathin films, the extra electrons are provided by the metal substrate below, doped oxides contain intrinsic charge sources in the form of aliovalent impurity ions. Thin oxide films grown on metal single crystals are mainly of academic interest, as they provide easy access to the properties of oxide materials via conventional surface science techniques. Doped oxides, on the other hand, are of practical relevance for instance in heterogeneous catalysis. As shown in this section, overvalent dopants are able to change the equilibrium shape of particles from 3D to 2D, which is expected to change the reactivity pattern of the metal–oxide system. Moreover, charge transfer from electron-rich dopants might be a suitable pathway to activate small molecules, such as oxygen or methane, as discussed next.
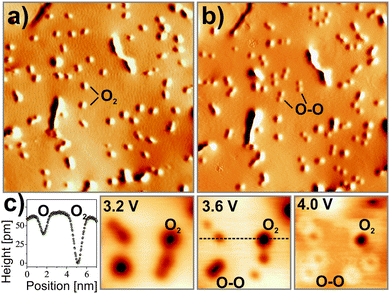
Using scanning tunneling microscopy and density functional theory, evidence is provided that strongly bound O2− species with high susceptibility for dissociation form even on chemically inert CaO(001) after it has been doped with Mo ions. Fig. 23 displays STM images of such a doped CaO(001) film before and after exposure to O2. In empty-state images, the adsorbates appear as circular depressions 0.6 Å in depth and 10 Å in diameter. Exposing them to electrons from the STM tip reveals their molecular nature, as they split into pairs of identical minima that are assigned to the respective O atoms (Fig. 24).107 Whereas a mean O–O distance of 10–15 Å is observed directly after dissociation, this number increases with time due to a repulsive character of the O–O interaction on the surface. The two types of oxygen species can be distinguished also in bias-dependent topographic images. While the molecules show pronounced negative contrast, the atomic species appear fainter and are surrounded by a bright halo (Fig. 24c).
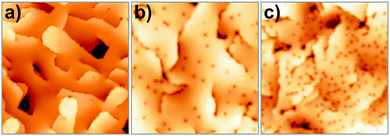 | ||
| Fig. 23 STM images of (a) a pristine 25 ML CaO(001) film (4.0 V, 80 × 80 nm2) and (b) films after O2 exposure of 5 L @ 20 K and (c) 200 L @ 300 K (40 × 40 nm2). | ||
The adsorption efficiency of oxygen strongly depends on the preparation of the CaO films, in particular on the concentration of the Mo dopants. This becomes evident in Fig. 25, which displays weakly and strongly doped CaO films after exposure to 5 L O2 at 20 K. Whereas Mo-poor films are unable to bind oxygen, a rather high adsorbate concentration is found for Mo-rich preparations, indicating the crucial role of the dopants in binding.
To correlate the Mo concentration with the CaO reactivity towards oxygen, the position of the oxide conduction band with respect to the Fermi level can be used as a descriptor. With increasing donor concentration, the band position experiences a down-shift, as electrons are transferred from interfacial Mo species to the metal substrate below.104 This charge flow generates a positive interface dipole between the oxide film and the metal support that shifts the vacuum level and the closely related oxide conduction band to lower energy (Fig. 25b). A steep onset in the O2 adsorption probability is now observed when the band edge drops below 3.0 eV, while films with a band position higher than 4.0 eV are unable to bind oxygen. Again, electron donation from the Mo impurities seems to be the crucial requirement for molecular activation.
Although the band position is a nonlocal parameter, dopants and O2 molecules are expected to interact directly with each other and not through a delocalized charge background. Experimental evidence comes from O desorption experiments, in which isolated molecules are removed from the surface by a bias pulse with the tip. In 50% of these experiments, a Mo donor is detected below the molecule. Interestingly, the dopant never occupies a position directly in the top layer but sits in sub-surface oxide planes, as deduced from the diameter of characteristic charging rings emerging in the STM images.108 It is concluded that the Mo ions are able to exchange charges with the surface O2 molecules even over distances as large as 1 nm, most likely via electron tunneling. A last experimental hint for O2− formation on doped CaO films comes from the facile dissociation of the molecules, which proceeds with close to 100% probability when 4.0 eV electrons are injected from the tip into the surface (1 min @ 20 pA). The bond cleavage occurs as a second electron enters the antibonding states of the already weakened superoxo species. The electron transfer between Mo donors and O2 acceptors has been reproduced with DFT calculations performed at the B3LYP + D level. On non-doped CaO(001), a neutral O2 molecule binds with 13 kJ mol−1 (mostly from dispersion forces) to a Ca–Ca bridge position, while Ca2+ top sites are less preferred. In contrast, an O2− species binds to the same bridge site with a binding energy of 87 kJ mol−1 when a Mo3+ ion is present in the third subsurface plane. The charge transfer to oxygen becomes even more favorable for Mo2+ donors in the oxide film, given their low ionization energy.95 Further evidence for the formation of superoxo species comes from the bond elongation (121 to 133 pm) and the reduced stretching frequency (1537 to 1200 cm−1) computed for O2 molecules on the doped oxide. Moreover, the total spin of the system decreases from 5/2 (3/2 for Mo3+ (d3) plus 1 for O2) to 3/2 (1 for Mo4+ (d2) plus 1/2 for O2−) in response to the charge transfer. And finally, we calculated a lower apparent dissociation barrier for superoxo species on doped CaO (66 kJ mol−1) compared to that of neutral O2 on pristine CaO (110 kJ mol−1), following the trend observed experimentally. Concluding the part on O2 activation it has been shown that O2 molecules may be activated to form superoxo species even on smooth, defect-free surfaces of non-reducible oxides when dopants are present in the bulk. The O2− on Mo-doped CaO is bound with an energy of 90 kJ mol−1, and is hence stable at room temperature. Moreover, the species is prone to dissociation into atomic oxygen on the doped surface. It is concluded that dopants may play a pivotal role in the activation of hydrocarbons on wide-band-gap oxides. The latter has been confirmed in a study of the Schlögl group, which demonstrates an unusually high reaction yield for the oxidative coupling of methane over Fe-doped MgO powder.109
Synopsis
It is the goal of this article to demonstrate how systematic studies on well-defined model systems put us in a position to unravel details of structure–spectroscopy and structure–reactivity relations that are virtually impossible to obtain on real materials due to the wealth of parameters to take into account. We have exemplified this on the basis of two case studies dealing with supported metal nanoparticles. The first one on magnetite supported Pd nanoparticles allowed us to connect the deposition of carbon on specific sites of the nanoparticles with its sustained hydrogenation activity, a topic that has been mysterious in catalysis for decades. The second case study directly correlated charge transfer between the support and the metal nanoparticle with the morphology, shape and structure of the latter, a phenomenon that had not been expected and allowed us to answer open questions in catalysis. A corollary from the second study is a proposal for oxygen activation on smooth oxide surfaces as encountered in high temperature oxidative methane coupling.In the course of these studies a number of discoveries were made “on side” which were not addressed in this paper. For example, the study of ultrathin oxide films led us to propose new routes within the field of the so-called “strong metal support interaction (SMSI)”.110 Another example has been the strive for new model supports based on well-structured silica films.111 Here we have been able to give first insight into the silica glass–crystal transition in real space,112 one of the big unsolved problems in physical chemistry and material sciences. Also, this research has led to the discovery of the first two-dimensional zeolite film113 allowing us to study acid–base catalysis in those systems using the tool box of surface science. It was even possible to show that these systems could be used in an aqueous environment to study the initial steps of nanoparticle formation from solution.114 All of this was accompanied by the development of novel experimental tools115 such as ESR in UHV science, single crystal calorimetry of supported nanoparticles, photon-STM to investigate local doping, and aberration corrected PEEM and LEEM for future structural investigations on individual particles.116
In closing, we insist that the study of well-defined model systems that catch some of the complexity of real catalytic materials is a field for future investigations to finally close the gap between surface science and catalysis, i.e. the materials, pressure, and complexity gaps.
Acknowledgements
The authors are grateful to all members in the department of chemical physics of the Fritz Haber Institute for their contributions, in particular Wolf-Dieter Schneider for contributing to the discussion on gold particles. We thank the DFG for support through the cluster of excellence UniCat, administrated at the Technische Universität Berlin, as well as the Fonds der Chemischen Industrie.References
- G. Ertl and H.-J. Freund, Phys. Today, 1999, 52, 32–38 CrossRef CAS PubMed.
- H. J. Freund, Chem.–Eur. J., 2010, 16, 9384–9397 CrossRef CAS PubMed.
- K. H. Hansen, T. Worren, S. Stempel, E. Lægsgaard, M. Bäumer, H. J. Freund, F. Besenbacher and I. Stensgaard, Phys. Rev. Lett., 1999, 83, 4120–4123 CrossRef CAS.
- G. Ertl, H. Knözinger and J. Weitkamp, Handbook of Heterogeneous Catalysis, VCH, Weinheim, 1997 Search PubMed.
- G. C. Bond, Metal-Catalysed Reactions of Hydrocarbons, Springer, New York, 2005 Search PubMed.
- G. A. Somorjai, Introduction to Surface Chemistry and Catalysis, John Wiley & Sons, Inc., New York, 1994 Search PubMed.
- J. Horiuti and K. Miyahara, Report NSRDS-NBC No. 13, 1968.
- A. D. Johnson, K. J. Maynard, S. P. Daley, Q. Y. Yang and S. T. Ceyer, Phys. Rev. Lett., 1991, 67, 927 CrossRef CAS.
- A. M. Doyle, S. K. Shaikhutdinov, S. D. Jackson and H.-J. Freund, Angew. Chem., Int. Ed., 2003, 42, 5240–5243 CrossRef CAS PubMed.
- D. Teschner, J. Borsodi, A. Wootsch, Z. Révay, M. Hävecker, A. Knop-Gericke, S. D. Jackson and R. Schlögl, Science, 2008, 320, 86–89 CrossRef CAS PubMed.
- W. Mönch, Semiconductor Surfaces and Interfaces, Springer, Berlin, Heidelberg, 1995, vol. 26 Search PubMed.
- P. Schwach, M. G. Willinger, A. Trunschke and R. Schlögl, Angew. Chem., Int. Ed., 2013, 52, 11381–11384 CrossRef CAS PubMed.
- M. Wilde, K. Fukutani, W. Ludwig, B. Brandt, J.-H. Fischer, S. Schauermann and H. J. Freund, Angew. Chem., Int. Ed., 2008, 47, 9289–9293 CrossRef CAS PubMed.
- B. Brandt, W. Ludwig, J.-H. Fischer, J. Libuda, F. Zaera and S. Schauermann, J. Catal., 2009, 265, 191–198 CrossRef CAS PubMed.
- K. M. Neyman and S. Schauermann, Angew. Chem., Int. Ed., 2010, 49, 4743–4746 CrossRef CAS PubMed.
- W. Ludwig, A. Savara, S. Schauermann and H.-J. Freund, ChemPhysChem, 2010, 11, 2319–2322 CrossRef CAS PubMed.
- W. Ludwig, A. Savara, K.-H. Dostert and S. Schauermann, J. Catal., 2011, 284, 148–156 CrossRef CAS PubMed.
- J.-L. Lu, J. Weissenrieder, S. Kaya, H.-J. Gao, S. Shaikhutdinov and H.-J. Freund, Surf. Rev. Lett., 2007, 14, 927–934 CrossRef CAS.
- J. Horiuti and M. Polanyi, Trans. Faraday Soc., 1934, 30, 1164 RSC.
- F. Zaera, Chem. Rev., 1995, 95, 2651–2693 CrossRef CAS.
- B. Brandt, J. H. Fischer, W. Ludwig, J. Libuda, F. Zaera, S. Schauermann and H. J. Freund, J. Phys. Chem. C, 2008, 112, 11408–11420 CAS.
- T. Schalow, B. Brandt, D. E. Starr, M. Laurin, S. K. Shaikhutdinov, S. Schauermann, J. Libuda and H. J. Freund, Phys. Chem. Chem. Phys., 2007, 9, 1347–1361 RSC.
- S. Schauermann, J. Hoffmann, V. Johánek, J. Hartmann, J. Libuda and H.-J. Freund, Angew. Chem., Int. Ed., 2002, 41, 2532–2535 CrossRef CAS.
- F. Viñes, C. Loschen, F. Illas and K. M. Neyman, J. Catal., 2009, 266, 59–63 CrossRef PubMed.
- M. Wilde, K. Fukutani, M. Naschitzki and H. J. Freund, Phys. Rev. B: Condens. Matter Mater. Phys., 2008, 77, 113412 CrossRef.
- T. Kendelewicz, S. Kaya, J. T. Newberg, H. Bluhm, N. Mulakaluri, W. Moritz, M. Scheffler, A. Nilsson, R. Pentcheva and G. E. Brown, J. Phys. Chem. C, 2013, 117, 2719–2733 CAS.
- K. Christmann, Surf. Sci. Rep., 1988, 9, 1–163 CrossRef.
- C. Zhang, A. Michaelides and S. J. Jenkins, Phys. Chem. Chem. Phys., 2011, 13, 22–33 RSC.
- H. Conrad, G. Ertl and E. E. Latta, Surf. Sci., 1974, 41, 435–446 CrossRef.
- M. S. Chen and D. W. Goodman, Science, 2004, 306, 252–255 CrossRef CAS PubMed.
- M. Chen and D. W. Goodman, Chem. Soc. Rev., 2008, 37, 1860–1870 RSC.
- M. Valden, X. Lai and D. W. Goodman, Science, 1998, 281, 1647–1650 CrossRef CAS.
- D. Ricci, A. Bongiorno, G. Pacchioni and U. Landman, Phys. Rev. Lett., 2006, 97, 036106 CrossRef.
- F. Winkelmann, S. Wohlrab, J. Libuda, M. Bäumer, D. Cappus, M. Menges, K. Al-Shamery, H. Kuhlenbeck and H. J. Freund, Surf. Sci., 1994, 307–309, 1148 CrossRef CAS.
- R. Wichtendahl, M. Rodriguez-Rodrigo, U. Härtel, H. Kuhlenbeck and H.-J. Freund, Surf. Sci., 1999, 423, 90–98 CrossRef CAS.
- R. Wichtendahl, M. Rodriguez-Rodrigo, U. Härtel, H. Kuhlenbeck and H. J. Freund, Phys. Status Solidi A, 1999, 173, 93–100 CrossRef CAS.
- M. Sterrer, T. Risse, M. Heyde, H.-P. Rust and H.-J. Freund, Phys. Rev. Lett., 2007, 98, 206103 CrossRef.
- M. Yulikov, M. Sterrer, M. Heyde, H. P. Rust, T. Risse, H.-J. Freund, G. Pacchioni and A. Scagnelli, Phys. Rev. Lett., 2006, 96, 146804 CrossRef.
- A. Nambu, J. Graciani, J. A. Rodriguez, Q. Wu, E. Fujita and J. F. Sanz, J. Chem. Phys., 2006, 125, 094706 CrossRef CAS PubMed.
- J. A. Rodriguez, J. C. Hanson, J.-Y. Kim, G. Liu, A. Iglesias-Juez and M. Fernández-García, J. Phys. Chem. B, 2003, 107, 3535–3543 CrossRef CAS.
- I. Yudanov, G. Pacchioni, K. Neyman and N. Rösch, J. Phys. Chem. B, 1997, 101, 2786–2792 CrossRef CAS.
- A. Del Vitto, G. Pacchioni, F. O. Delbecq and P. Sautet, J. Phys. Chem. B, 2005, 109, 8040–8048 CrossRef CAS PubMed.
- G. Barcaro and A. Fortunelli, J. Chem. Theory Comput., 2005, 1, 972–985 CrossRef CAS.
- R. Meyer, C. Lemire, S. K. Shaikhutdinov and H. Freund, Gold Bull., 2004, 37, 72 CrossRef CAS.
- M. Sterrer, M. Yulikov, T. Risse, H. J. Freund, J. Carrasco, F. Illas, C. Di Valentin, L. Giordano and G. Pacchioni, Angew. Chem., Int. Ed., 2006, 45, 2633–2635 CrossRef CAS PubMed.
- L. Jiang and Q. Xu, J. Phys. Chem. A, 2005, 109, 1026–1032 CrossRef CAS PubMed.
- M. Sterrer, M. Yulikov, T. Risse, H.-J. Freund, J. Carrasco, F. Illas, C. Di Valentin, L. Giordano and G. Pacchioni, Angew. Chem., Int. Ed., 2006, 45, 2633–2635 CrossRef CAS PubMed.
- M. Sterrer, T. Risse, U. Martinez Pozzoni, L. Giordano, M. Heyde, H.-P. Rust, G. Pacchioni and H.-J. Freund, Phys. Rev. Lett., 2007, 98, 096107 CrossRef.
- H. P. Bonzel, Surf. Sci. Rep., 1988, 8, 43–125 CrossRef.
- R. D. Diehl and R. McGrath, Surf. Sci. Rep., 1996, 23, 43–171 CrossRef CAS.
- J. Kliewer and R. Berndt, Surf. Sci., 2001, 477, 250–258 CrossRef CAS.
- L. Giordano, F. Cinquini and G. Pacchioni, Phys. Rev. B: Condens. Matter Mater. Phys., 2006, 73, 045414 CrossRef.
- G. Pacchioni, L. Giordano and M. Baistrocchi, Phys. Rev. Lett., 2005, 94, 226104 CrossRef PubMed.
- M. Sterrer, T. Risse, L. Giordano, M. Heyde, N. Nilius, H. P. Rust, G. Pacchioni and H.-J. Freund, Angew. Chem., Int. Ed., 2007, 46, 8703–8706 CrossRef CAS PubMed.
- S. W. Wu, N. Ogawa, G. V. Nazin and W. Ho, J. Phys. Chem. C, 2008, 112, 5241–5244 CAS.
- S. W. Wu, G. V. Nazin, X. Chen, X. H. Qiu and W. Ho, Phys. Rev. Lett., 2004, 93, 236802 CrossRef CAS.
- R. M. Jaeger, H. Kuhlenbeck, H. J. Freund, M. Wuttig, W. Hoffmann, R. Franchy and H. Ibach, Surf. Sci., 1991, 259, 235–252 CrossRef CAS.
- N. Nilius, M. V. Ganduglia-Pirovano, V. Brázdová, M. Kulawik, J. Sauer and H. J. Freund, Phys. Rev. Lett., 2008, 100, 096802 CrossRef CAS.
- N. Nilius, M. V. Ganduglia-Pirovano, V. Brazdova, M. Kulawik, J. Sauer and H. J. Freund, Phys. Rev. B: Condens. Matter Mater. Phys., 2010, 81, 045422 CrossRef.
- L. Giordano and G. Pacchioni, Acc. Chem. Res., 2011, 44, 1244–1252 CrossRef CAS PubMed.
- V. Simic-Milosevic, M. Heyde, N. Nilius, T. Koenig, H. P. Rust, M. Sterrer, T. Risse, H. J. Freund, L. Giordano and G. Pacchioni, J. Am. Chem. Soc., 2008, 130, 7814–7815 CrossRef CAS PubMed.
- V. Simic-Milosevic, M. Heyde, X. Lin, T. König, H.-P. Rust, M. Sterrer, T. Risse, N. Nilius, H.-J. Freund, L. Giordano and G. Pacchioni, Phys. Rev. B: Condens. Matter Mater. Phys., 2008, 78, 235429 CrossRef.
- M. Kulawik, N. Nilius and H. J. Freund, Phys. Rev. Lett., 2006, 96, 036103 CrossRef CAS.
- M. Bäumer and H. J. Freund, Prog. Surf. Sci., 1999, 61, 127–198 CrossRef.
- N. Nilius, Surf. Sci. Rep., 2009, 64, 595–659 CrossRef CAS PubMed.
- P. Frondelius, H. Häkkinen and K. Honkala, New J. Phys., 2007, 9, 339 CrossRef.
- C. R. Henry, Surf. Sci. Rep., 1998, 31, 231–326 CrossRef CAS.
- X. Lin, N. Nilius, H. J. Freund, M. Walter, P. Frondelius, K. Honkala and H. Häkkinen, Phys. Rev. Lett., 2009, 102, 206801 CrossRef CAS.
- X. Lin, N. Nilius, M. Sterrer, P. Koskinen, H. Haekkinen and H.-J. Freund, Phys. Rev. B: Condens. Matter Mater. Phys., 2010, 81, 153406 CrossRef.
- J. Andersin, J. Nevalaita, K. Honkala and H. Häkkinen, Angew. Chem., Int. Ed., 2013, 52, 1424–1427 CrossRef CAS PubMed.
- C. Kittel, Introduction to Solid State Physics, Wiley, New York, 7th edn, 1996 Search PubMed.
- M. Walter, P. Frondelius, K. Honkala and H. Häkkinen, Phys. Rev. Lett., 2007, 99, 096102 CrossRef.
- W. A. de Heer, Rev. Mod. Phys., 1993, 65, 611–676 CrossRef CAS.
- G. Pacchioni and H. Freund, Chem. Rev., 2012, 113, 4035–4072 CrossRef PubMed.
- M. Bäumer, J. Libuda, A. Sandell, H. J. Freund, G. Graw, T. Bertrams and H. Neddermeyer, Ber. Bunsen. Phys. Chem., 1995, 99, 1381–1386 Search PubMed.
- N. Cabrera and N. F. Mott, Rep. Prog. Phys., 1948, 12, 163 Search PubMed.
- L. M. Molina and B. Hammer, Appl. Catal., A, 2005, 291, 21–31 CrossRef CAS PubMed.
- I. X. Green, W. J. Tang, M. Neurock and J. T. Yates, Science, 2011, 333, 736–739 CrossRef CAS PubMed.
- S. Abbet, E. Riedo, H. Brune, U. Heiz, A. M. Ferrari, L. Giordano and G. Pacchioni, J. Am. Chem. Soc., 2001, 123, 6172–6178 CrossRef CAS PubMed.
- X. Lin, B. Yang, H. M. Benia, P. Myrach, M. Yulikov, A. Aumer, M. Brown, M. Sterrer, O. Bondarchuk, E. Kieseritzky, J. Rocker, T. Risse, H. Gao, N. Nilius and H. J. Freund, J. Am. Chem. Soc., 2010, 132, 7745–7749 CrossRef CAS PubMed.
- T. Risse, S. Shaikhutdinov, N. Nilius, M. Sterrer and H.-J. Freund, Acc. Chem. Res., 2008, 41, 949–956 CrossRef CAS PubMed.
- A. S. K. Hashmi and G. J. Hutchings, Angew. Chem., Int. Ed., 2006, 45, 7896–7936 CrossRef PubMed.
- A. A. Herzing, C. J. Kiely, A. F. Carley, P. Landon and G. J. Hutchings, Science, 2008, 321, 1331–1335 CrossRef CAS PubMed.
- M. Valden, X. Lai and D. W. Goodman, Science, 1998, 281, 1647–1650 CrossRef CAS.
- Metal Clusters, ed. W. Ekardt, John Wiley, Chichester, 1999 Search PubMed.
- Optical properties of metal clusters, ed. U. Kreibig and W. Vollmer, Springer-Verlag, Berlin, New York, 1995 Search PubMed.
- S. Wendt, P. T. Sprunger, E. Lira, G. K. H. Madsen, Z. Li, J. Ø. Hansen, J. Matthiesen, A. Blekinge-Rasmussen, E. Lægsgaard, B. Hammer and F. Besenbacher, Science, 2008, 320, 1755–1759 CrossRef CAS PubMed.
- H. Y. Kim, H. M. Lee, R. G. S. Pala, V. Shapovalov and H. Metiu, J. Phys. Chem. C, 2008, 112, 12398–12408 CAS.
- V. Shapovalov and H. Metiu, J. Catal., 2007, 245, 205–214 CrossRef CAS PubMed.
- N. Mammen, S. Narasimhan and S. d. Gironcoli, J. Am. Chem. Soc., 2011, 133, 2801–2803 CrossRef CAS PubMed.
- J. X. Wang and J. H. Lunsford, J. Phys. Chem., 1986, 90, 5883–5887 CrossRef CAS.
- T. Ito, J. Wang, C. H. Lin and J. H. Lunsford, J. Am. Chem. Soc., 1985, 107, 5062–5068 CrossRef CAS.
- R. G. S. Pala and H. Metiu, J. Phys. Chem. C, 2007, 111, 12715–12722 CAS.
- M. Nolan, V. S. Verdugo and H. Metiu, Surf. Sci., 2008, 602, 2734–2742 CrossRef CAS PubMed.
- X. Shao, S. Prada, L. Giordano, G. Pacchioni, N. Nilius and H.-J. Freund, Angew. Chem., Int. Ed., 2011, 50, 11525–11527 CrossRef CAS PubMed.
- F. Stavale, X. Shao, N. Nilius, H.-J. Freund, S. Prada, L. Giordano and G. Pacchioni, J. Am. Chem. Soc., 2012, 134, 11380–11383 CrossRef CAS PubMed.
- F. Stavale, N. Nilius and H.-J. Freund, New J. Phys., 2012, 14, 033006 CrossRef.
- S. Prada, L. Giordano and G. Pacchioni, J. Phys. Chem. C, 2013, 117, 9943–9951 CAS.
- Optical Spectroscopy of Inorganic Solids, B. Henderson and G. F. Imbusch, Oxford University Press, Oxford, 1989 Search PubMed.
- D. R. Lide, CRC Handbook of Chemistry and Physics, CRC Press, 1996 Search PubMed.
- H. M. Benia, P. Myrach, A. Gonchar, T. Risse, M. Nilius and H. J. Freund, Phys. Rev. B: Condens. Matter Mater. Phys., 2010, 81, 241415 CrossRef.
- B. Li and H. Metiu, J. Phys. Chem. C, 2010, 114, 12234–12244 CAS.
- Z. Hu, B. Li, X. Sun and H. Metiu, J. Phys. Chem. C, 2011, 115, 3065–3074 CAS.
- X. Shao, N. Nilius and H.-J. Freund, J. Am. Chem. Soc., 2012, 134, 2532–2534 CrossRef CAS PubMed.
- M. Sterrer, M. Heyde, M. Novicki, N. Nilius, T. Risse, H. P. Rust, G. Pacchioni and H. J. Freund, J. Phys. Chem. B, 2006, 110, 46–49 CrossRef CAS PubMed.
- P. Myrach, N. Nilius, S. V. Levchenko, A. Gonchar, T. Risse, K.-P. Dinse, L. A. Boatner, W. Frandsen, R. Horn, H.-J. Freund, R. Schlögl and M. Scheffler, ChemCatChem, 2010, 2, 854–862 CrossRef CAS.
- B. C. Stipe, M. A. Rezaei, W. Ho, S. Gao, M. Persson and B. I. Lundqvist, Phys. Rev. Lett., 1997, 78, 4410–4413 CrossRef CAS.
- Y. Cui, N. Nilius, H.-J. Freund, S. Prada, L. Giordano and G. Pacchioni, Phys. Rev. B: Condens. Matter Mater. Phys., 2013, 88, 205421 CrossRef.
- P. Schwach, M. G. Willinger, A. Trunschke and R. Schlögl, Angew. Chem., Int. Ed., 2013, 52, 11381–11384 CrossRef CAS PubMed.
- S. Shaikhutdinov and H.-J. Freund, Annu. Rev. Phys. Chem., 2012, 63, 619–633 CrossRef CAS PubMed.
- S. Shaikhutdinov and H.-J. Freund, Adv. Mater., 2013, 25, 49–67 CrossRef CAS PubMed.
- L. Lichtenstein, M. Heyde and H.-J. Freund, Phys. Rev. Lett., 2012, 109, 106101 CrossRef.
- S. Shaikhutdinov and H.-J. Freund, ChemPhysChem, 2013, 14, 71–77 CrossRef CAS PubMed.
- H.-F. Wang, H. Ariga, R. Dowler, M. Sterrer and H.-J. Freund, J. Catal., 2012, 286, 1–5 CrossRef CAS PubMed.
- H.-J. Freund, N. Nilius, T. Risse, S. Schauermann and T. Schmidt, ChemPhysChem, 2011, 12, 79–87 CrossRef CAS PubMed.
- N. Nilius, M. V. Ganduglia-Pirovano, V. Brázdová, M. Kulawik, J. Sauer and H. J. Freund, Phys. Rev. B: Condens. Matter Mater. Phys., 2010, 81, 045422 CrossRef.
| This journal is © the Owner Societies 2014 |


