 Open Access Article
Creative Commons Attribution 3.0 Unported Licence
Lithium and sodium battery cathode materials: computational insights into voltage, diffusion and nanostructural properties
M. Saiful
Islam
*a and
Craig A. J.
Fisher
b
aDepartment of Chemistry, University of Bath, Bath, BA2 7AY, UK. E-mail: m.s.islam@bath.ac.uk
bNanostructures Research Laboratory, Japan Fine Ceramics Center, 2-4-1 Mutsuno, Atsuta-ku, Nagoya 456-8587, Japan. E-mail: c_fisher@jfcc.or.jp
First published on 7th November 2013
Abstract
Energy storage technologies are critical in addressing the global challenge of clean sustainable energy. Major advances in rechargeable batteries for portable electronics, electric vehicles and large-scale grid storage will depend on the discovery and exploitation of new high performance materials, which requires a greater fundamental understanding of their properties on the atomic and nanoscopic scales. This review describes some of the exciting progress being made in this area through use of computer simulation techniques, focusing primarily on positive electrode (cathode) materials for lithium-ion batteries, but also including a timely overview of the growing area of new cathode materials for sodium-ion batteries. In general, two main types of technique have been employed, namely electronic structure methods based on density functional theory, and atomistic potentials-based methods. A major theme of much computational work has been the significant synergy with experimental studies. The scope of contemporary work is highlighted by studies of a broad range of topical materials encompassing layered, spinel and polyanionic framework compounds such as LiCoO2, LiMn2O4 and LiFePO4 respectively. Fundamental features important to cathode performance are examined, including voltage trends, ion diffusion paths and dimensionalities, intrinsic defect chemistry, and surface properties of nanostructures.
1 Introduction
The importance of clean and efficient energy storage has grown enormously over the past decade, driven primarily by concerns over global warming, diminishing fossil-fuel reserves, and increasing demand for portable electronics and grid storage systems.1–3 The performance of energy storage devices depends crucially on the properties of their component materials. Indeed, innovative materials science lies at the core of advances that have already been made in this field,4,5 an excellent example being the rechargeable lithium battery.Lithium-ion batteries have since become instrumental in powering the revolution in portable electronics (including mobile phones, laptops, and digital audio players), as their high energy density is superior to all other secondary batteries.6–18 In addition, the need to cut CO2 emissions from road transport will require uptake of hybrid or fully electric vehicles powered by batteries that are light, safe, inexpensive and long lived, whereas the intermittency of renewable energy sources (such as solar and wind power) will require large-scale storage systems in power grids.1–4
For the same reasons, sodium-ion batteries are also attracting increased attention recently, especially for grid storage.19–23 Early research into Na analogues of some Li-based positive electrode materials more-or-less fell by the wayside some twenty years ago in favour of the higher gravimetric capacity afforded by rechargeable Li-ion cells, a factor critical to their successful application in portable electronics. Sodium-based batteries have other advantages, however, largely associated with their improved cost stemming from the natural abundance of sodium in the Earth's crust. Indeed, where gravimetric energy density is not the primary concern, Na-ion batteries can be preferable to their Li-ion counterparts.
Regardless of the application, the discovery and optimisation of high performance materials are critical to future breakthroughs for next-generation rechargeable batteries. These advances depend on exploring new classes of compounds and gaining a better understanding of the fundamental science of functional materials that underpin applied research. Computational methods now play a vital role in characterising and predicting the structures and properties of complex materials on the atomic scale. A major theme for much computational work has been the strong synergy with experimental studies.
This review highlights some of the exciting advances made in computational studies of cathode materials in recent years, particularly for Li-ion batteries. In light of the renewed interest in Na-ion batteries, we also include a timely overview of recent computational studies of Na-based cathode materials. It would require several volumes to provide an exhaustive summary of the vast number of studies that are now being carried out worldwide, which is obviously beyond the scope of this review. Nor is this review intended to be a comprehensive overview of lithium battery technologies and materials; excellent reviews on these topics can be found elsewhere.5–23 Rather, we discuss a range of examples to illustrate the kinds of significant contributions computational techniques can make in the study of lithium-ion and other battery materials.
First, we provide brief overviews of computational methods and cathode materials, and then focus on recent progress in analysing cell voltages, ion transport, defect chemistry, surfaces and nanostructures of cathode materials.
2 Overview of computational methods
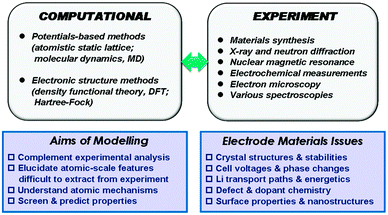
Our description of the computational techniques will be brief as more comprehensive reviews are available elsewhere,24,25 including in relation to rechargeable batteries.26–28 In general, two main classes of technique have been employed in the study of solid-state cathode materials: interatomic potential-based methods (including atomistic static lattice and molecular dynamics techniques) and electronic structure methods, in particular employing density functional theory (DFT). The schematic diagram in Fig. 1 summarises the relationships between the main computational methods, together with complementary experimental techniques, their overall aims, and the types of properties that can be calculated.2.1 Interatomic potential methods
These rest upon the specification of an effective potential model, which expresses the total energy of the system as a function of the nuclear coordinates. For polar solids, a good basis is the Born model framework, which partitions the total energy into long-range Coulombic interactions, and a short-range term to model the repulsions and van der Waals forces between electron charge clouds; the Buckingham potential is often used for the short-range term, giving | (1) |
It should be stressed, as argued previously,24,25 that employing such a potential model does not necessarily mean that the electron distribution corresponds to a fully ionic system, and that the general validity of the model is assessed primarily by its ability to reproduce observed properties of the crystal lattice. Indeed, good quality interatomic potentials are available for a wide range of oxides, fluorides and polyanion solids. For systems such as phosphates and silicates, pair-potential models still prove to be useful, although it has been found desirable to include some representation of the angular dependence of the bonding via angle-dependent terms.24,26
Geometry optimisation provides the lowest energy configuration of a given structure through a search of the potential energy surface using efficient minimisation routines. For bulk systems, three-dimensional periodic boundary conditions are normally applied to the simulation box, in effect rendering the structure infinite in extent.
An important feature of these calculations is the treatment of lattice relaxation (using the Mott–Littleton approach) around point defects, dopant clusters or migrating ions, so that the crystal is not considered simply as a rigid lattice. The most widely used code for geometry optimisation (and related defect calculations) using effective potentials is GULP.29 Atomistic modelling of surface structures and energies uses similar methodology and interatomic potentials to bulk calculations, by either describing the crystal as a stack of planes periodic in two dimensions, or as a slab of given thickness bounded by two symmetrically equivalent surfaces.
The molecular dynamics (MD) technique consists of numerically solving Newton's equations of motion for a large ensemble of particles at a finite temperature and pressure. Repetition of the integration algorithm over many time steps yields a detailed picture of the evolution of ion positions and velocities as a function of time. Two properties MD simulations are eminently good at providing within the current context of Li-ion conducting materials are diffusion coefficients and ion transport mechanisms as functions of temperature and/or composition. A widely used MD code is the DL_POLY program.30
It is worth noting that potentials-based MD simulations on Li diffusion can now regularly be run for timescales on the order of nanoseconds, at least two orders of magnitude longer than ab initio MD calculations of much smaller systems. Indeed, the advantage of interatomic potential methods is that they are computationally inexpensive and thus allow large ensembles of atoms, from thousands to millions, to be handled efficiently within a reasonable time frame on modern supercomputers. The chief disadvantage is that explicit information on the material's electronic structure is not included in potentials-based methods.
2.2 Electronic structure methods
For inorganic solids, the most widely used theoretical framework for accurate calculations of a system's electronic ground state is density functional theory (DFT).31 DFT relates the ground-state energy to the electron density, ρ, and in the Kohn–Sham formalism, the total energy, E, is given by32| (−∇2 + VH[ρ(r)] + VN(r) + VXC[ρ(r)])ψi(r) = Eiψi(r) | (2) |
Unlike the first three terms, the exact form of the exchange–correlation term cannot be computed, but there are a number of approaches for including reasonable approximations to it. One of the first to be developed is the local density approximation (LDA), which estimates the exchange–correlation potential as if the electron were surrounded by a uniform electron gas at each point. This method works particularly well for metals. However, when materials contain localised electrons, such as most oxides or salts, LDA reveals systematic shortcomings, leading to overestimation of binding energies, with the associated underestimation of crystal lattice constants, for example. To overcome this, the generalised gradient approximation (GGA) was developed, in which a dependence on the gradient of the electron density is introduced.
To avoid electron self-interaction errors that occur in standard LDA or GGA for strongly correlated electronic systems, DFT + U methods are often used for open-shell transition metal compounds, where U is an on-site Coulomb interaction parameter. The U parameter is derived either by fitting to experimental data (e.g. cell voltages, band gaps), or by self-consistent calculations. There is also increasing use of hybrid functionals, which include a fraction of the Hartree–Fock exchange, and can also correct for self-interaction present in the Hartree term, although the amount of exact exchange required can also be system dependent, introducing another empirical term.33
Among a variety of different ways of describing the crystal orbitals, one widely used implementation of DFT combines a plane-wave basis set with the pseudopotential method, in which the pseudopotential replaces the nuclear potential and the inert core electrons, so that only valence electrons are included explicitly in the calculations. Bulk crystals are again modelled as infinite lattice systems using 3D periodic boundary conditions, while surfaces can be modelled as the two faces of a slab separated by a vacuum in one direction and infinite in extent in the other two.
The utility of these methods (often referred to as first-principles or ab initio) is evidenced by the explosion in the number of studies carried out on all manner of condensed matter systems, including lithium-ion battery materials, over the past 15 or so years. There are many DFT codes available today, some of the more popular being the general-purpose codes VASP,34 CASTEP,35 CRYSTAL36 and Wien2K.37
In general, the development of computational materials science has been assisted by the continuing rapid growth in computer power as well as advances in theory and more efficient (and massively parallelisable) codes. As indicated by Catlow and Woodley,38 scientific computing can be viewed as a pyramid, where the base represents the many desktop PCs (which now have much greater power than the “supercomputers” of the 1980s), and at the apex are high-performance computers with the greatest processing power, parallelism and memory specifications.
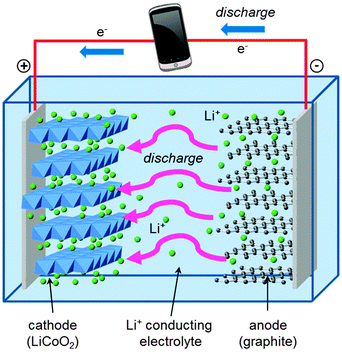
3 Cathode materials: background
A schematic of the main components of a conventional rechargeable lithium-ion battery is given in Fig. 2. The battery cell comprises a positive electrode (cathode); a non-aqueous liquid electrolyte, typically LiPF6 salt in an organic solvent; and a negative electrode (anode), normally of graphite. The good intercalation behaviour of the conventional cathode, layered LiCoO2, was first reported in the early 1980s,39,40 leading to successful commercialization in 1991. The electrode reactions during discharge can be written| Anode: LixC6(s) → xLi+(soln) + 6C(s) + xe− | (3) |
| Cathode: Li1−xCoO2(s) + xLi+(soln) + xe− → LiCoO2(s) | (4) |
During charging, a voltage applied across the electrodes forces lithium ions to be extracted from the LiCoO2 crystal. These diffuse through the electrolyte, and are intercalated between the graphite sheets in the anode material. During discharge, Li ions return to the cathode via the electronically insulating electrolyte, with electrons passing around the external circuit providing useful power for the device.
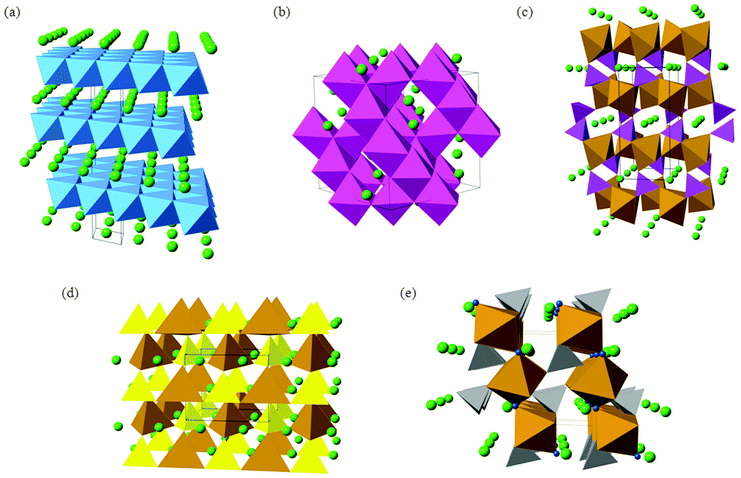
The conventional LiCoO2 cathode adopts the α-NaFeO2 structure (Fig. 3) with consecutive alternating [CoO2]− and Li+ layers; the Co3+ and Li+ ions are octahedrally coordinated in a cubic close packed (ccp) O2− lattice, resulting in a rhombohedral structure. The cathode is one of the limiting components in lithium-ion batteries because the amount of lithium that can be reversibly extracted and re-inserted influences the overall capacity, while its Fermi energy affects the cell voltage.
The next-generation of lithium ion batteries for electric vehicles and grid storage applications will require LiCoO2 to be replaced with intercalation materials that are lower cost and environmentally benign. In particular, the cost and toxicity of cobalt could be avoided by using other multivalent elements such as Fe and Mn. For large-scale lithium batteries, thermochemical stability and high energy density (and high voltage) are two other important considerations. The main candidate materials that are being investigated to achieve these aims include mixed-metal layered oxides (such as LiNi0.5Mn0.5O2 and Li-rich Li1.2Mn0.6Ni0.2O2), spinel oxides (LiMn2O4) and polyanion materials (such as LiFePO4, Li2FeSiO4, and LiFeSO4F); their crystal structures are shown in Fig. 3.
The olivine-structured orthophosphate LiFePO4 in particular is a much-studied material now being produced commercially.1,6,11,18 Amongst its attractive properties are its good electrochemical performance (particularly its high operating voltage and large theoretical gravimetric capacity), its low cost and good chemical stability during lithiation–delithiation.11,15,41–48 The LiFePO4 olivine structure (Fig. 3c) consists of PO4 tetrahedra with Fe2+ ions on corner-sharing octahedral positions and Li+ ions on edge-sharing octahedral positions, the latter running parallel to the crystallographic b axis in the orthorhombic Pnma structure.
Silicate cathodes such as Li2FeSiO4 have recently attracted significant interest49–51 because iron and silicon are among the most abundant elements on Earth, and hence offer the tantalising prospect of cheap and low-cost cathodes from rust and sand! The Li2MSiO4 (M = Fe, Mn, Co) compounds are members of a large family of structures comprised of tetragonally-packed oxide ions (a distorted form of hexagonal close packing) in which half of the tetrahedral sites are occupied by cations (Fig. 3d). The cation site ordering can vary, and the tetrahedra can be distorted, resulting in a rich and complex polymorphism.
Apart from the increased stability provided by a polyanion network, the open circuit voltage (OCV) of a material can be increased by tuning the covalency of the bonds in the polyanion. In particular, replacing the PO43− moiety by SO42− in a compound with stoichiometry LiMXO4 (M = Mn, Fe, Co, or Ni, and X = P or S) increases the OCV by about 0.6–0.8 V.41 Taking a cue from such examples, LiFeSO4F in its tavorite and triplite forms has been shown to be an excellent cathode material,52,53 the two polymorphs exhibiting voltages of 3.6 V and 3.9 V, respectively.
Although computational methods are being used to study all aspects of battery operation, in the following sections we focus on atomic-level studies of important solid-state properties of cathode materials such as cell voltages, lithium diffusion, defect chemistry and surface structures to highlight recent trends in this field.
4 Cell voltages and electronic structure
Early computational work54 demonstrated how the lithium insertion voltage (relative to a lithium metal anode) can be derived for LiCoO2 and other layered transition metal oxides from DFT calculations with good accuracy. Within this theoretical framework, lithium intercalation into a cathode host can be represented by the general equation| Lixi[cathode] + (xj − xi)Li(s)[anode] → Lixj[cathode] | (5) |
 | (6) |
 | (7) |
4.1 Oxides and phosphates
This approach to calculate cell voltages was first used to investigate the trends of lithium intercalation voltages for a number of LiMO2 (M = Co, Ni, Ti, V, Cu, Al, Mn) layered compounds assuming the α-NaFeO2 structure type for all compositions.54 These studies showed that moving to the right of the period (greater electron affinity and number of d orbital electrons) there is an increase in the electronic charge that is transferred to the anionic band when Li ions are inserted in the MO2 host; these calculations also showed that the type of anion (O, S or Se) has a very strong influence on the voltage, with oxygen clearly giving the highest voltages.The important role of the anion can be explained in terms of the significant degree of charge transfer to the anion that occurs upon intercalation of lithium. In the oxides, more charge is transferred to the oxide ions than to the metal ions. Early DFT calculations of doped LiCoO2 also identified new candidate materials in which non-transition metals are substituted for Co.55 For one such material, Li(Co,Al)O2, it was predicted that aluminium substitution would raise the cell voltage while decreasing both the density of the material and its cost.55 Early DFT studies also include lithium insertion calculations on vanadium oxide cathodes.56
For transition-metal-containing compounds pure LDA or GGA calculations are often found to underestimate redox potentials. This is largely because an electron transferred from a transition metal ion to a lithium ion experiences significantly less self-interaction in the latter state, leading to underestimation of the energy required. As noted, a commonly used method for compensating for this is addition of a Hubbard-type U term to increase on-site Coulomb interactions. Using self-consistently derived U values,57 the experimental lithium intercalation voltages and band gaps of a number of transition metal compounds, including layered LixMO2 (M = Co, Ni), olivine LixMPO4 (M = Mn, Fe, Co, Ni) and spinel LixM2O4 (M = Mn, Co) can be reproduced with better accuracy (Fig. 4). Owing to their high capacities there has been significant interest in Li-rich layered oxides, with combined DFT, diffraction and NMR studies of the Li2MnO3–Li[Ni1/2Mn1/2]O2 system, and DFT studies on the influence of cation substitution on oxygen loss in Li2MnO3-based layered cathodes being reported.58
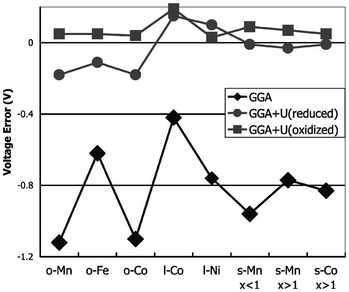 | ||
| Fig. 4 Difference between calculated and experimental voltage for GGA and GGA + U, at the calculated U of the oxidised (delithiated) and reduced (lithiated) states, respectively (o = olivine LiMPO4; l = layered LiMO2; s = spinel LiM2O4) (from ref. 57). | ||
Regarding the electronic structure of olivine cathodes, Maxisch et al.57 investigated the formation and transport of small polarons in LixFePO4 using the GGA + U approach; their results show that the binding energy between electron polarons and Li+ ions in FePO4 is lower than that between hole polarons and lithium vacancies in LiFePO4. Also, FePO4 was predicted to be a better electronic conductor than LiFePO4.
In addition to intercalation voltages, DFT methods have also been used to provide insights into structural changes and stabilities on lithium extraction.59,60 Over a decade ago,61 the phase diagram of LixCoO2 was predicted based on DFT calculations, indicating a tendency for Li ordering at x = 1/2, in close agreement with experiment. The same methods have been used to investigate the relative stabilities of different layer stackings in LiCoO2, using a cluster expansion method combined with Monte Carlo simulations.62
DFT calculations have also been combined with solid-state NMR experiments to simulate hyperfine parameters and provide insights into local structural features of Fe(III) phosphates63 and Mn silicate polymorphs.64
4.2 Silicates and fluorosulfates
Both DFT65–75 and potentials-based methods76,77 have been used to investigate the properties of complex silicates Li2MSiO4 (M = Mn, Fe, Co and Ni). GGA + U studies suggested that Li2FeSiO4 would develop a reversible specific capacity limited to the extraction of one lithium ion, whereas Li2MnSiO4 would have poor electronic conductivity.65 The calculated lithium extraction voltages of Co and Ni silicates have been predicted to be too high for current electrolytes.65Recent GGA + U studies by Saracibar et al.74 and Eames et al.75 examined the energetics and cell voltages of three as-prepared polymorphs (βII, γs, and γII) of Li2FeSiO4versus the recently elucidated cycled structure (inverse-βII). They found good agreement with the measured values of the voltage change (ΔV vs. Li+/Li) upon cycling across these polymorphs (Table 1). Eames et al.75 suggested that, in general, structure–property features for high cell voltages in these iron silicate cathode materials should include not only the formal valence state of Fe but also the change in energy upon delithiation (from Li2FeSiO4 to LiFeSiO4), which is influenced by the balance between the cation–cation electrostatic repulsion and the distortion of the covalent tetrahedral framework.
| V AP | V CY | ΔV | Method | Ref. |
|---|---|---|---|---|
| a Cycled structure, inverse-βII phase. | ||||
| βII phase (Pmn21) | ||||
| 3.10 | 2.80 | −0.30 | Expt | 49 |
| 3.10 | 2.76 | −0.34 | Expt | 50 |
| 3.16 | DFT + U | 65 | ||
| 2.60 | DFT | 67 | ||
| 3.30 | DFT + U | 67 | ||
| 3.12 | 2.83 | −0.29 | DFT + U | 74 |
| 3.34 | 3.04a | −0.30 | DFT + U | 75 |
| γs phase (P21/n) | ||||
| 3.00 | 2.76 | −0.24 | Expt | 50 |
| 3.28 | DFT + U | 68 | ||
| 3.09 | 2.84 | −0.26 | DFT + U | 74 |
| 3.28 | 3.04a | −0.24 | DFT + U | 75 |
| γII phase (Pmnb) | ||||
| 2.90 | 2.76 | −0.14 | Expt | 50 |
| 3.22 | 3.04a | −0.18 | DFT + U | 75 |
DFT + U methods have also been used recently to investigate the structural and electronic properties of LiFeSO4F.78–81 Chung et al.80 investigated both tavorite and triplite polymorphs, and found that the lithiated states (corresponding to LiFeSO4F) are almost degenerate in energy. The difference in voltage is mainly due to the difference in the stabilities of the delithiated states (FeSO4F), which can be rationalized in terms of the Fe3+–Fe3+ repulsion in the edge-sharing geometry of the triplite structure.
A combination of DFT + U simulations and crystallographic analyses by Ben Yahia et al.81 demonstrated that the origin of the voltage enhancement lies in the difference in the anionic networks of the tavorite and triplite polymorphs, specifically in the electrostatic repulsions induced by the configuration of the fluorine atoms around Fe cations.
To end this section, it is worth noting that a high-throughput computational approach82 is being used to screen large numbers of candidate polyanion compounds for use as cathodes; the computed stabilities, voltages and energy densities have suggested several carbonophosphates and carbonosilicates as potential cathode materials.
5 Lithium-ion diffusion
Ion diffusion pathways and activation energies that govern Li-ion transport within cathode materials are of considerable interest when considering rates at which a battery can be charged and discharged. However, these details are often difficult to extract from experiment alone, especially for new polyanionic framework compounds. In this section we show that potentials-based and DFT methods have a proven record in this area by summarising many of the simulations that have been used to derive migration energy barriers and elucidate diffusion pathways and their dimensionality.5.1 Layered and spinel oxides
Early DFT studies83,84 of lithium diffusion in the layered LixCoO2 system showed that lithium transport is mediated by a divacancy mechanism between x = 0 and x < 1 but by single isolated vacancies at infinite vacancy dilution. Two different migration paths, illustrated in Fig. 5, are associated with each scenario, with the former having a significantly lower migration barrier energy to the latter. This work revealed how sensitive the activation barrier is to the lithium concentration due to the concomitant change in effective valence of the cobalt ions and the strongly varying layer spacing of the host lattice.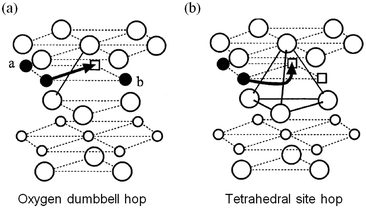 | ||
| Fig. 5 Two lithium migration paths in layered LixCoO2 (from ref. 84) (a) oxygen dumbbell hop occurs when the sites a and b are simultaneously occupied by Li ions. (b) Tetrahedral site hop occurs when one or both of the sites are vacant. Filled circles are Li ions; empty squares are Li vacancies; large circles are oxygen ions; small empty circles are Co ions. | ||
Turning to the mixed-metal layered cathodes based on Li(Ni,Mn)O2, DFT calculations have demonstrated that its increased stability relative to LiCoO2 is due to the particular valence distribution of the transition metals,85,86 with Mn in oxidation state +4 independent of the Li content. Delithiation of LixNi0.5Mn0.5O2 shows that the electrochemical behaviour is linked to the oxidation of Ni2+, while the Mn valence state remains unchanged.85,86
It has also been reported that as-prepared Li(Ni0.5Mn0.5)O2 contains 8 to 12% site exchange between Li and Ni,87 and DFT has been used to explore the effect of this on lithium mobility.88,89Fig. 6 shows the calculated activation energy as a function of the distance between the oxygen layers on each side of the Li plane, clearly indicating that more space between the oxygen layers substantially reduces the activation energy. The Li/Ni antisite (also known as cation-exchange) disorder has also been proposed as the reason why Li(Ni0.5Mn0.5)O2 does not exhibit high rate performance. A key conclusion is that Li diffusivity would be greatly improved by reducing the amount of Li/Ni exchange in Li(Ni0.5Mn0.5)O2; this was subsequently achieved by ion exchange of Li for Na in NaCoO2, and resulted in high measured rate-capability.88
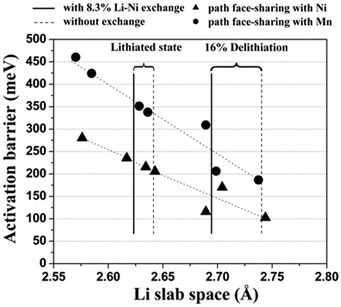 | ||
| Fig. 6 Calculated activation barrier for Li migration in Li(Ni0.5Mn0.5)O2 as a function of the Li slab space. Triangles and circles represent the activated state in which LiO6 octahedra share faces with Ni and Mn octahedra, respectively. The activation barriers have been calculated for a hypothetically perfect layered system, for a system with 8.3% excess Ni present in the Li layer without a change in the transition metal layer, and for a system with 8.3% Li–Ni exchange. Reprinted with permission from ref. 88. Copyright 2006 American Association for the Advancement of Science. | ||
Computational studies of spinel-structured LiMn2O4 indicate that Li-ion transport involves migration between the tetrahedral (8a) sites via the octahedral (16c) sites;90–97 these zig-zag type paths occur uniformly in all three directions of the spinel structure, and hence LiMn2O4-based cathodes show 3D Li-ion diffusion behaviour. DFT studies on a range of doped spinels LiM1/2Mn3/2O4 (M = Ti, V, Cr, Fe, Co, Ni, and Cu) suggest that doping with Co or Cu can potentially lower the Li-diffusion barrier as compared to Ni doping.94 Recent DFT calculations95 on LiMn2O4 and LiCo1/16Mn15/16O4 spinels also suggest that charge disproportionation accounts for the lower migration energy found in the Co-doped system.
5.2 Phosphates
Activation barriers to Li-ion migration in LixMPO4 (M = Mn, Fe, Co, Ni) olivines have been calculated using DFT methods,98,99 indicating that Li diffuses down one-dimensional (1D) channels.98 In this case, a very low activation barrier (∼0.1–0.2 eV) was first predicted for migration along these channels, and the resulting intrinsic Li diffusivity was calculated to be higher than found experimentally.Atomistic defect modelling studies of LiFePO4 predicted an activation barrier in better agreement with experiment (∼0.5 eV),100,101 and also revealed that lithium ions follow a non-linear, curved trajectory down the [010] channel in the orthorhombic crystal with space group Pnma (Fig. 7). High barriers for other pathways suggest that lithium ions cannot readily span the large jump (>4.5 Å) between channels, in agreement with the DFT results; such a 1D transport mechanism is consistent with the strongly anisotropic nature of the orthorhombic olivine structure. This example provides a good illustration of the utility of atomistic modelling, as neutron diffraction measurements of LiFePO4 later confirmed the 1D nature of Li+ diffusion in this material (Fig. 8), with a curved migration pathway between adjacent lithium sites as predicted.102
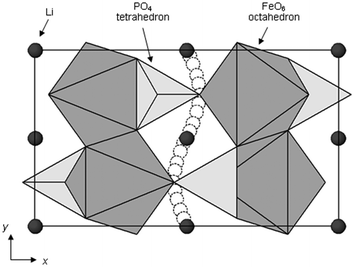 | ||
| Fig. 7 Schematic of the calculated pathway for Li-ion migration down [010] channels of LiFePO4 viewed perpendicular to the ab plane. Reprinted with permission from ref. 100. Copyright 2005 American Chemical Society. | ||
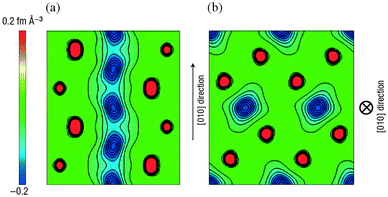 | ||
| Fig. 8 Experimental visualization of lithium diffusion in LixFePO4 from combined powder neutron diffraction and the maximum entropy method (from ref. 102): (a) Two-dimensional contour map sliced on the (001) plane at z = 0.5; lithium delocalizes along the curved one-dimensional chain along the [010] direction. (b) Two-dimensional contour map sliced on the (010) plane at y = 0; all atoms remain near their original positions. Reprinted by permission from Macmillan Publishers Ltd: Nat. Mater. (ref. 102). Copyright 2008. | ||
More recently, Malik et al.103 found that the diffusion coefficient depends on particle size, with diffusion in large LiFePO4 crystals being much slower than in nanoparticles because of the presence of a larger number of channel-blocking defects in the former. Adams104 used a bond valence approach to investigate lithium transport pathways in LiFePO4 including the effect of Li/Fe antisite defects on possible 2D pathways. Molecular dynamics (MD) studies by Boulfelfel et al.105 suggest that as well as the principal diffusion pathways along [010] in LiFePO4, there is also possible ion transport along [001]. Potentials-based MD simulations106,107 have focussed on the effect of Li/Fe antisite defects, and shown that while Li diffusion in LiFePO4 is preferentially along the [010] channels, Li/Fe antisite defects can act as centres promoting localised crossing between adjacent channels. It is apparent that certain simulation studies indicate localized inter-channel hops in LiFePO4, but do not show evidence of significant long-range Li-ion diffusion perpendicular to the b-axis channels.
DFT methods were used by Dathar et al.108 to study the different components of Li kinetics in LiFePO4; they found that, while bulk diffusion is affected by strain and Li concentration, these are not substantial enough to explain the slow diffusion observed in experiment. However, surface diffusion is observed to have high barriers, which could contribute to slow kinetics in nanostructured cathodes, a point discussed further in Section 7.2.
Recently it has been proposed that pyrophosphate systems Li2MP2O7 (M = Fe, Mn, Ni)109–113 may provide a new family of compounds for developing high-performance cathode materials. Li2FeP2O7 is particularly attractive because it is easy to synthesise by a conventional solid-state reaction and displays reversible electrode kinetics at 3.5 V vs. Li/Li+ without the need for preparation as nanoparticles or carbon coating. This voltage is the highest reported so far for Fe-based phosphate cathodes. Atomistic simulation studies of Li2FeP2O7 indicate that lithium diffusion follows nonlinear, curved paths parallel to the b and c axes within space group P21/c (Fig. 9),112 with low migration energies (0.40 eV); hence, in contrast to 1D diffusion in LiFePO4, fast Li+ transport in Li2FeP2O7 is predicted to occur through a 2D network in the (100) plane, which may explain the good rate capability even without the use of nanosized particles.
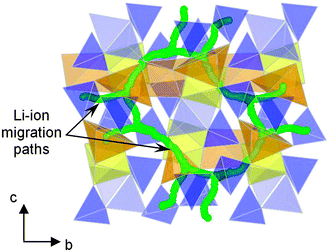 | ||
| Fig. 9 Calculated paths (green) for long-range Li+ migration in Li2FeP2O7 involving Li1 and Li3 sites viewed perpendicular to the bc plane; simulations indicate quasi-2D transport and non-linear pathways. FeO6 octahedra are shown in yellow, mixed occupancy FeO5–LiO5 units in orange and P2O7 pyrophosphate polyhedra in blue. Reprinted with permission from Wiley Publishers Ltd: Angew. Chem., Int. Ed. (ref. 112). Copyright 2012. | ||
5.3 Silicates and fluorosulfates
The structure of Li2FeSiO4 undergoes significant change on cycling, from the as-prepared γs form to an inverse βII polymorph, such that the SiO4, FeO4 and LiO4 tetrahedra all end up pointing in the same direction (Fig. 3d). Combined atomistic modelling and diffraction studies76 have revealed that, as a result of the structural changes, Li+ transport paths (and corresponding Li–Li separation distances) in the cycled structure are very different from those in the as-prepared material. These paths involve zigzag trajectories between Li sites, through intervening unoccupied octahedral sites that share faces with the LiO4 tetrahedra.DFT calculations on Li2FeSiO4 (with P21 symmetry) indicate 2D lithium-ion diffusion,71 and similar DFT studies72 based on earlier structural data have found Li-vacancy migration barriers of 0.9–1.0 eV in the delithiated silicate system. Significantly, the calculated migration energy is greater than the values reported for LiFePO4 and Li2FeP2O7. Higher migration energies imply lower Li conductivities and a lower rate capability for Li2FeSiO4 cathodes when Li is extracted and inserted.
The Li-ion migration behaviour of four polymorphs of Li2MnSiO4 has been investigated based on atomistic simulations;77 high activation energies (around 0.9 to 1.7 eV) are found regardless of the particular phase. All four polymorphs are thus expected to be poor Li-ion conductors, which implies low rate capabilities for Li2MnSiO4-based cathodes unless synthesised as nanoparticles to facilitate sufficient Li transport. Of the four polymorphs studied, the two orthorhombic phases are predicted to display essentially 2D Li-ion diffusion, while the two monoclinic phases should exhibit 3D ion diffusion.
The alkali-ion transport behaviour of both LiFeSO4F and NaFeSO4F tavorite-type materials has been investigated using potentials-based methods.114 The results indicate that LiFeSO4F is effectively a 3D lithium-ion conductor with an activation energy of about 0.4 eV for long-range diffusion, which involves a combination of zigzag pathways through tunnels in the [100], [010] and [111] directions of the tavorite lattice (Fig. 3e), which has triclinic (P![[1 with combining macron]](https://www.rsc.org/images/entities/char_0031_0304.gif) ) symmetry.
) symmetry.
MD simulations on LiFeSO4F with a bond valence force-field115 indicate superionic zigzag paths parallel to [111]. Ab initio MD simulations of Ramzan et al.79 also suggest 3D Li diffusion in LiFeSO4F, although the simulation timescales are very short in comparison to potentials-based MD. DFT calculations116 predict that Li-ion diffusion occurs primarily along isolated [111] channels, effectively making this material a 1D ionic conductor. All of these computational studies on the complex fluorosulfate agree that the most favourable diffusion path is in the [111] direction, although reasons for the disparity in activation energies along other pathways warrant further investigation.
For the related NaFeSO4F system, only one direction, [101], is found to have a relatively low activation energy, suggesting that this compound is a 1D Na-ion conductor.114 Such differences in intrinsic alkali-ion mobility coupled with the two phase behaviour of (de)intercalation of alkali ions and a large volume difference between end members in the NaFeSO4F–FeSO4F system helps to explain the difference in the observed electrochemical behaviour of the Li and Na fluorosulfates.
5.4 Dimensionality of Li-ion diffusion
The dimensionality of Li-ion transport within the crystal structures of cathode materials is critical for their charge–discharge rate capabilities, as alluded to in the previous section. Materials which support 2D or 3D Li-ion diffusion through their crystal lattices exhibit some of the highest charge–discharge rates when used as cathodes. In Table 2 we have listed a range of cathode materials and structure types, together with the dimensionality of Li-ion diffusion as determined largely from computational studies.| Structure class | Compound | Dimensionality | Ref. |
|---|---|---|---|
| Layered | LiCoO2 | 2D | 84 |
| LiNi1/2Mn1/2O2 | 2D | 88 | |
| LiNi1/3Mn1/3Co1/3O2 | 2D | 118 | |
| Spinel | LiMn2O4, | 3D | 90, 95 |
| LiMn1.5Ni0.5O4 | 3D | 91, 94, 96 | |
| Olivine | LiFePO4 | 1D | 98, 100 |
| LiMnPO4 | 1D | 98, 101 | |
| Pyrophosphate | Li2Fe2P2O7 | 2D | 112 |
| Orthosilicate | Li2FeSiO4 | 2D or 3D | 71, 72, 76 |
| Li2MnSiO4 | 2D or 3D | 77 | |
| Tavorite | LiFeSO4F | 1D or 3D | 114–116 |
| Borate | LiFeBO3 | 1D | 117 |
Li-ion diffusion in layer-structured LiCoO2 (and related materials LiNi1/3Mn1/3Co1/3O2 and LiNi1/2Mn1/2O2) is, not surprisingly, 2D with fast Li-ion transport between CoO6 octahedral layers and within well-defined Li layers parallel to the unit-cell basal plane. In the spinel oxides LiMn2O4 and LiMn1.5Ni0.5O4, with cubic or near-cubic symmetry, Li-ion diffusion is 3D (as well as being isotropic in all directions), and hence these materials exhibit some of the highest rate capabilities.
In contrast, Li-ion transport in LiFePO4 is essentially 1D along the channels of the orthorhombic structure with the shortest Li–Li jump distances, and may easily be blocked by cation antisite defects, especially Fe on Li sites. As discussed, this 1D behaviour explains why preparing the phosphate as nanoparticles, in order to provide shorter diffusion path lengths, leads to enhanced charge–discharge rates. Largely on account of the complex polymorphism in the Li2MSiO4 (M = Fe, Mn) systems, the transport pathways are less well characterised, with computational studies suggesting 2D and 3D behaviour depending on the particular polymorph structure, which may change during cycling.
6 Defect chemistry and ion doping
To understand fully the electrochemical behaviour of cathode materials, knowledge of the underlying point defect types and associated properties is important. The formation energetics of intrinsic atomic defects such as Schottky, Frenkel and antisite disorder in a range of cathode materials has been most readily investigated by potentials-based methods based on the following defect reactions (in Kröger–Vink notation): | (8) |
 | (9) |
 | (10) |
For the LiMPO4 (M = Mn, Fe), LiNi1/3Mn1/3Co1/3O2, Li2MnSiO4 and Li2FeP2O7 systems, potentials-based simulation studies suggest that the most favourable intrinsic defect is the cation antisite defect, in which a small population (<3%) of Fe2+, Mn2+ or Ni2+ ions are expected to sit on the Li sites (Table 3); the concentration of this defect is temperature dependent and hence sensitive to experimental synthesis conditions. After the simulation results were reported,100 structural analysis of hydrothermally synthesized LiFePO4 estimated 3 mol% Fe on lithium sites,47 while a scanning transmission electron microscopy (STEM) study119 provided evidence of antisite defects in LiFePO4, quoting a concentration of around 1%. In contrast, the Li/Fe antisite energies for the tavorite LiFeSO4F suggest that there would be no significant intrinsic concentration of Fe on Li at typical operating temperatures, although cation disorder is found in the triplite phase. Recent DFT simulations on the spinel LiNi0.5Mn1.5O4 suggest a correlation between the concentration of oxygen vacancy defects and voltage suppression.120
Charged point defects can also associate to form localized clusters, which can have significant effects on transport behaviour. Binding energy calculations121 for LiFePO4 suggest clustering of antisite defects as well as impurity-vacancy defects (rather than a random distribution); such phenomena may be important as precursors to local ordering or nanodomain formation. Energetically favourable nano-clusters include neutral 1D clusters comprised of antisite defects (Fe on Li) and Li vacancies orientated along the Li channel (Fig. 10), which could result in trapping of migrating Li+ species; hence defect clustering would inhibit Li extraction from the olivine phase.
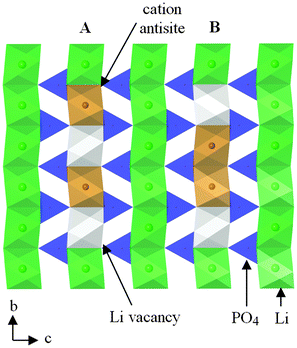 | ||
| Fig. 10 Schematic of a structural plane of LiFePO4 containing two neutral defect cluster arrangements comprised of two antisite defects (Fe on Li sites) and two Li vacancies within b-axis channels: (A) antisite cation and Li vacancy on alternating sites; (B) antisite cations on adjacent sites. Reprinted with permission from ref. 121. Copyright 2010 American Chemical Society. | ||
A combined DFT, statistical mechanics and STEM study122 of Li-ion mobility and Fe antisite defects (Fe–Li) in LiFePO4 indicates that Li vacancies are confined to the 1D Li channels, shuttling between neighbouring Fe–Li; the energy is lowered by the V-Li clusters spending more time bound to end-point Fe–Li clusters. Larger (V-Li)–Fe–Li–(V-Li) complexes also form, and account for some features of observed electron energy loss spectra.
In addition to intrinsic defects, potentials-based methods can be used to investigate the effects of doping by generating estimates of the energies of different dopant substitution reactions. This can provide a useful systematic guide to the site-selectivity of different dopant species and to trends in dopant solubility.
Simulation studies of a wide range of dopants in LiFePO4 from monovalent to pentavalent cations, for example, found low favourable energies only for Na+ substitution on the Li+ site, and divalent dopants (e.g., Zn, Cu, and Mg) on the transition-metal site.100,101 In contrast, supervalent doping (especially Ti4+ and Nb5+) appears energetically unfavourable on both Li+ and Fe2+ sites; moreover, the charge-compensation mechanism for such doping was found to leave the Fe2+ valence state unaltered and hence unlikely to contribute to high electronic conductivity. These results are in accord with experimental reports123–125 of unsuccessful incorporation of significant levels (>3%) of supervalent dopants to enhance electronic conductivity, and suggests the report43 of impressive increases in electronic conductivity upon addition of higher valent cations to LiFePO4 may be due to effects other than conventional solid-solution formation.
A combination of DFT calculations and materials characterisation studies126 found that codoping LiFePO4 with Si on P and F on O leads to improved electrical conductivity, and therefore enhanced electrochemical performance in comparison to undoped LiFePO4; it is suggested that such codoping modifies the nature of the conduction band minimum so that the transport mechanism is changed from polaron-type to band-like conduction.
DFT calculations of various dopants in LiFePO4 have also been used to investigate the formation energy and site preferences as a function of Li, Fe, P, and O2 chemical potentials;127 for all thermodynamically allowed chemical potentials, Na, Cu, Ag, Mg, and Zn are likely to exist as neutral defects in LiFePO4 under thermodynamic equilibrium and thus do not enhance the concentration of either small hole polarons or lithium vacancies, i.e., electronic or ionic conduction should not be affected by doping with these elements.
With regard to anion doping, DFT methods have been used to investigate N and F substitution for O in Li2FeSiO4.128 For the Pmn21 phase, it is predicted that the voltage associated with the Fe3+/Fe4+ redox couple is decreased by both substituents. The high theoretical specific capacity of Li2FeSiO4 could be retained in N-substituted silicates due to the oxidation of N3− anions, whilst the F-doped system exhibits a lower specific capacity typical of fluoride substitution.
7 Surfaces, morphologies and nanostructures
It is clear that morphological control of bulk crystalline or nanomaterials has an impact on their performance, as many properties are highly shape and size dependent.129 For example, the formation of LiFePO4 particles of sub-micron or nanometre size is thought to enhance electrochemical performance by reducing transport path lengths.130–132 However, surface structures and morphologies of particles are difficult to extract by experiment alone. Computer simulation, on the other hand, offers a valuable means of exploring such properties. Indeed, the growing field of nanoionics133 is driving the development of many new electroactive materials for batteries134 and other applications. Atomistic modelling is ideally suited for assisting such research, as the length scales (and possibly time scales) are directly comparable between experiment and simulations.135For such calculations, the advantage of interatomic potential methods is demonstrated by the large number of different surface planes and terminations that can be examined individually, quickly and efficiently. DFT methods, in contrast, can more accurately model the subtle changes in electron densities in the surface regions, as well as allow for deviations in stoichiometry under different conditions. Despite the difference in methodologies, there is often good overall agreement between the techniques.
7.1 Layered oxides
DFT and potentials-based techniques have both been used to study the surfaces and morphologies of LiCoO2 and related layered materials.136–140 For example, surface energies of several low-index surfaces of layered LiCoO2 (Fig. 11) have been investigated as a function of the external lithium and oxygen chemical potentials using GGA + U methods;136 the (0001) and (10![[1 with combining macron]](https://www.rsc.org/images/entities/char_0031_0304.gif) 4) surfaces were found to be present for all reasonable values of the Li and O chemical potentials, whereas the (01
4) surfaces were found to be present for all reasonable values of the Li and O chemical potentials, whereas the (01![[1 with combining macron]](https://www.rsc.org/images/entities/char_0031_0304.gif) 2) surface is stable only under oxidizing conditions.
2) surface is stable only under oxidizing conditions.
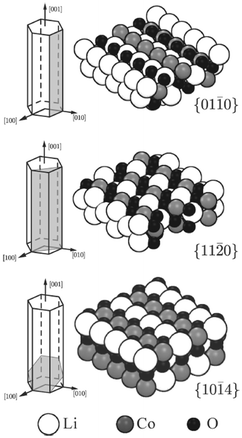 | ||
Fig. 11 Illustration of the cleavage plane and sphere model of the investigated nonpolar surfaces of LiCoO2; the {01![[1 with combining macron]](https://www.rsc.org/images/entities/char_0031_0304.gif) 0} and {11 0} and {11![[2 with combining macron]](https://www.rsc.org/images/entities/char_0032_0304.gif) 0} surfaces cleave the crystal perpendicular to the Li planes and in an angle of π/3 to each other; the {10 0} surfaces cleave the crystal perpendicular to the Li planes and in an angle of π/3 to each other; the {10![[1 with combining macron]](https://www.rsc.org/images/entities/char_0031_0304.gif) 4} surfaces cleave the crystal in an angle such that the surface Co is 5-fold coordinated. Reprinted with permission from ref. 136. Copyright 2010 American Chemical Society. 4} surfaces cleave the crystal in an angle such that the surface Co is 5-fold coordinated. Reprinted with permission from ref. 136. Copyright 2010 American Chemical Society. | ||
From GGA + U calculations138 it has also been proposed that electronic spin state transitions occur on the surfaces of stoichiometric LiCoO2, where trivalent Co ions at the surface adopt an intermediate spin state if they are square–pyramidal coordinated and a high spin state if they are pseudo-tetrahedral coordinated; hence low-coordinated geometries on the surface may have an effect on the Co(III)–Co(IV) redox potential of LiCoO2, especially for large surface-area-to-bulk ratios.
A combination of XPS measurements and DFT calculations139 has been used to examine local structures in stoichiometric LiCoO2 and lithium excess Li1+yCo1−yO2−y (y ∼ 0.05) materials; in addition to the XPS component attributed to the O2− ions of the crystalline network, a second component was observed on the high-binding energy side, which has been attributed to under-coordinated oxygen atoms on (001) surfaces; further analysis using scanning electron microscopy (SEM) indicated that the presence of defects (oxygen vacancies) needs to be considered in the lithium over-stoichiometric case.139
Recent computational studies have also probed the structures of twin boundaries141 (Fig. 12) and antiphase inversion domain boundaries in LiCoO2 thin films,142 as well as the growth of solid-electrolyte interphase (SEI) films at a solvent–graphitic anode interface.143 Further examples of how atomistic simulation of complex surfaces can complement experimental techniques include the use of DFT calculations to aid interpretation of STEM images of surface regions of spinel nanoparticles,144 and calculation of X-ray absorption near edge structure (XANES) and energy-loss near edge structure (ELNES) fingerprints for LiMO2 (M = Mn, Fe, Co, and Ni) crystals using the ab initio multiplet method.145
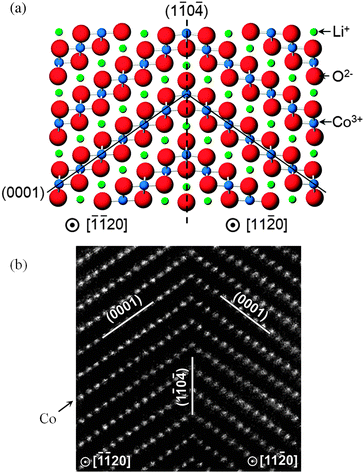 | ||
| Fig. 12 High symmetry near-Σ2 twist boundary in LiCoO2 (a) reproduced by both DFT and empirical potential simulations; and (b) as viewed using a high-angle annular dark field STEM (with only Co columns visible).141 | ||
7.2 Spinels and manganese oxides
DFT and potentials-based techniques have been used to examine the surfaces and nanostructures of LiMn2O4 spinel and MnO2-type materials.146–150 GGA + U simulations146 of the (001), (110), and (111) surface structures of LiMn2O4 demonstrated that the Mn-terminated (111) surface undergoes reconstruction in which the top layers mix in stoichiometric proportions to form an LiMn2O4 termination layer with square-planar-coordinated Mn; the average surface Mn oxidation states were found to be reduced relative to the bulk for all surfaces considered, as a consequence of the lower-energy cost of Jahn–Teller distortion at the surface. The Li-terminated (001) surface is the lowest in energy.Karim et al.147 have also used DFT methods to investigate low-index surface facets (100), (110), and (111) of LiMn2O4; their simulations indicate that the (111) surface is stabilized through a site exchange of the under-coordinated surface Mn ions with fully coordinated tetrahedral subsurface Li ions, effectively creating a partial inverse-spinel region at the surface. Based on these results, the equilibrium shape of an LiMn2O4 particle is predicted to exhibit a cubo-octahedral shape dominated by {111} surfaces, in agreement with common experimental observations of LiMn2O4 particles.
Sayle et al.149 simulated nanoporous rutile β-MnO2 using potentials-based MD techniques with nanoparticles evolved using simulated amorphisation and crystallisation (Fig. 13); it is predicted that, to maximise its electrochemical properties, the β-MnO2 host should be symmetrically porous and heavily twinned, and that there is a critical (wall) thickness for MnO2 nanomaterials above which the strain associated with Li insertion is accommodated. The simulations also revealed that the symmetrically porous MnO2 can expand and contract linearly and, crucially, elastically during lithiation–delithiation (i.e., charge–discharge) processes.
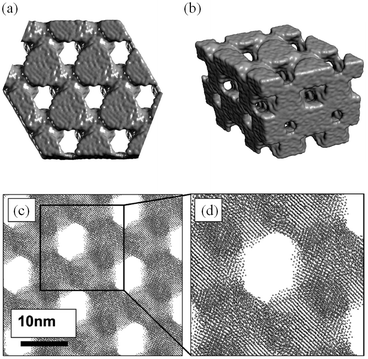 | ||
| Fig. 13 Final, low-temperature structures of MnO2 (a) surface rendered model of a thin slice viewed along [111]; (b) perspective view of a surface rendered model of the nanostructure; (c) sphere model representation of the atom positions revealing the hexagonal array of channels and the atomic planes of MnO2; and (d) an enlarged view of part of (c). Reprinted with permission from ref. 149. Copyright 2010 American Chemical Society. | ||
Tompsett et al.150 have used DFT + U methods to investigate the contrasting electrochemical behaviour of nanostructured mesoporous β-MnO2versus the bulk crystalline system, in which the latter can intercalate little or no lithium; the calculations indicate that Li migration in rutile-structured bulk β-MnO2 is primarily 1D along the long-axis tunnels with a small barrier of ∼0.2 eV, which is likely to contribute to its good performance in the mesoporous form. By explicit calculation of surface-to-bulk ion migration, Tompsett et al.150 also found a higher barrier of >0.6 eV for lithium insertion at the (101) surface (Fig. 14), which dominates the equilibrium morphology; this demonstrates the quantitative importance of surface-to-bulk ion migration, and suggests why intercalation becomes possible for nanosized crystals. Indeed, such intrinsic differences in the Li-ion mobility in the bulk and at the surfaces may be a key factor in the intercalation behaviour of nanostructured versus bulk crystalline systems for many cathode materials.
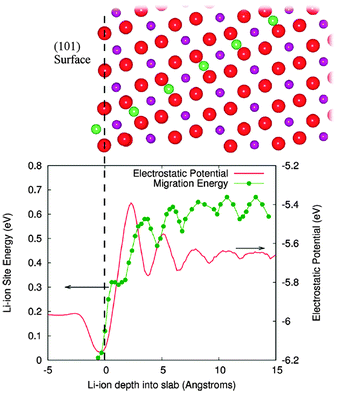 | ||
| Fig. 14 The surface to bulk Li ion migration barrier at the (101) surface of β-MnO2 is shown along with the corresponding electrostatic potential in the lower panel. Upper panel shows the migration path from this surface. Red spheres are oxygen, purple manganese, and green lithium; green line is a guide to the eye. The vertical dashed line at zero depth is aligned with the outermost oxygen layer. Reprinted with permission from ref. 150. Copyright 2010 American Chemical Society. | ||
7.3 Olivine phosphates
Focusing on the LiFePO4 system, both first-principles and interatomic-potential methods have been used to identify the same stable (low energy) surface structures by examining systematically different terminations of low index planes.151,152 These simulation studies showed that the majority of the surfaces undergo considerable relaxation, confirming that the surface chemistry and electrochemical activity cannot be reliably predicted by assuming rigid, unrelaxed terminations of the bulk lattice. Low energy (010) and (201) surfaces identified by both potentials-based and DFT calculations are found to dominate the equilibrium morphology based on Wulff constructions151,152 (Fig. 15 and 16).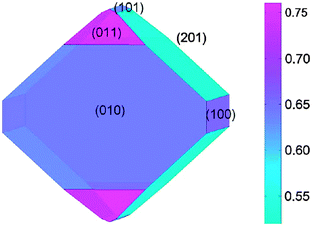 | ||
| Fig. 15 Equilibrium (Wulff) shape of LiFePO4 using surface energies calculated with DFT (from ref. 151). The scale bar gives the surface energy scale in Jm−2. | ||
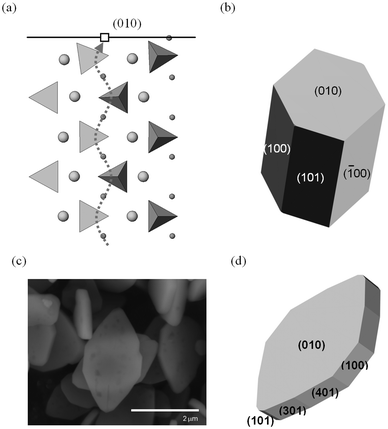 | ||
| Fig. 16 Surfaces and morphologies of LiFePO4; (a) side view of the simulated relaxed (010) surface, showing tilting of the PO4 tetrahedron near the Li+ vacancy (open square) in the topmost layer. The curved Li+ migration path (dotted line) identified from simulation work lies normal to the surface plane. (Li+: small spheres; Fe2+: large spheres PO4 tetrahedra; nb. ion sizes not to scale); (b) calculated growth morphology; (c) SEM micrograph of LiFePO4 plate-like particles; (d) simulated plate-like morphology and identification of surface planes. Reproduced from ref. 152 with permission from The Royal Society of Chemistry. | ||
In addition to the surface energies, potentials-based simulations152 were also used to calculate surface attachment energies, from which so-called “growth” morphologies could be generated, to give an indication of what particles grown under non-equilibrium conditions may look like. In the case of LiFePO4, such a non-equilibrium crystal is capped by (010) faces (Fig. 16); this morphology is consistent with particles of pure LiFePO4 imaged using SEM for some samples reported in the literature,130 although different synthesis routes have produced a variety of crystallite morphologies such as hexagonal platelets and block-type shapes.15,131
The exposure of the (010) surface on LiFePO4 crystals is significant since it is normal to the most facile pathway for lithium-ion conduction (viz. the [010] channel in the Pnma system), as illustrated in Fig. 16, and hence important for the (de)intercalation rate of lithium ions. GGA + U calculations151 show that the surface redox potentials for the extraction and insertion of Li from the (010) surface is significantly lower (ca. 0.6 V) than the bulk values. SEM images of plate-like crystallites of uncoated LiFePO4 from hydrothermal synthesis exhibiting large (010) faces can be reproduced by refining the simulated surface energies152 (shown in Fig. 16). This reduction in diffusion path length of lithium ions from bulk to surface is expected to enhance the electrochemical performance.
Smith et al.153 have performed atomistic MD simulations of the (010) surface of LiFePO4 in contact with two types of electrolyte: an organic liquid electrolyte (OLE), ethylene carbonate![[thin space (1/6-em)]](https://www.rsc.org/images/entities/char_2009.gif) :
:![[thin space (1/6-em)]](https://www.rsc.org/images/entities/char_2009.gif) dimethyl carbonate (3
dimethyl carbonate (3![[thin space (1/6-em)]](https://www.rsc.org/images/entities/char_2009.gif) :
:![[thin space (1/6-em)]](https://www.rsc.org/images/entities/char_2009.gif) 7) with approximately 1 mol kg−1 LiPF6; and an ionic liquid-based electrolyte (ILE), 1-ethyl-3-methyl-imidazolium:bis(fluorosulfonyl)imide (EMIM+: FSI−). The results suggest that the resistance for bringing Li+ from the bulk electrolyte to the LiFePO4 surface through the interfacial barrier is small for both the OLE and ILE. The ability of EMIM+ cations to donate positive charge to the LiFePO4/electrolyte interface may result in a significant decrease in Li-ion concentration at the surface and a corresponding increase in impedance to Li-ion intercalation into LiFePO4.
7) with approximately 1 mol kg−1 LiPF6; and an ionic liquid-based electrolyte (ILE), 1-ethyl-3-methyl-imidazolium:bis(fluorosulfonyl)imide (EMIM+: FSI−). The results suggest that the resistance for bringing Li+ from the bulk electrolyte to the LiFePO4 surface through the interfacial barrier is small for both the OLE and ILE. The ability of EMIM+ cations to donate positive charge to the LiFePO4/electrolyte interface may result in a significant decrease in Li-ion concentration at the surface and a corresponding increase in impedance to Li-ion intercalation into LiFePO4.
Coating carbon layers on LiFePO4 nanoparticles is a common strategy for providing sufficient electronic conductivity to allow the material to function as a cathode material. Geng et al.154 have investigated the interaction energies of graphene lying parallel and perpendicular to the LiFePO4 (010) surface using DFT methods, with their results suggesting that a perpendicular orientation of graphene sheets is energetically favourable.
Although not the focus of this review, it is also worth noting that the computational techniques described here are also being applied to alternative oxide anode materials including spinel-structured Li4Ti5O12,155–158 TiO2(B)159–166 and layered-structured LiVO2,167 as well as solid-state electrolytes such as LixLa2/3−x/3TiO3 (LLTO),168 lithium garnets,169 γ-Li3PO4 and related LIPONs,170 LISICONs,171 and Li10GeP2S12.172,173
8 Sodium-ion battery cathode materials
Na-ion batteries are attracting considerable renewed interest19–23 as promising candidates for new battery systems, especially for large-scale grid storage, due to their cost advantages (sodium is the 6th most abundant element on Earth). Early research into Na-ion conductors174–177 was superseded by the higher energy density provided by Li-ion cells. Compared to the decades of researching lithium insertion materials, there has been relatively limited computational research into cathode materials for Na-ion batteries.178–187 As a timely overview, recent computational studies are highlighted in this section.8.1 NaxMO2 materials
Kim et al.179 have used DFT methods to study the sodium insertion–deinsertion mechanisms of Na0.44MnO2, a promising Na-battery material on account of its high capacity and good cycling properties; their calculated voltage profile agrees well with experimental data (Fig. 17), identifying seven intermediate phases. They found that the different orientations of sodium polyhedra lead to two different Na2 sites, and suggested that unstable intermediate phases in the biphasic region between Na0.44MnO2 and Na0.55MnO2 could be a source of the observed capacity fading.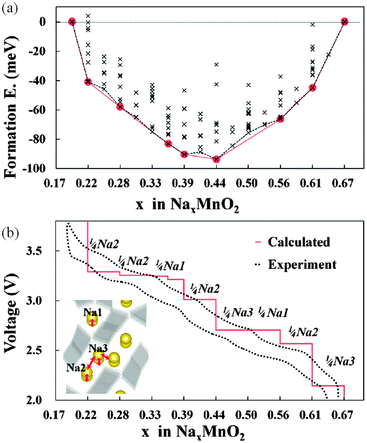 | ||
| Fig. 17 (a) Formation energies calculated from 156 different sodium configurations indicating seven stable intermediate phases during cycling of NaxMnO2 (x = 0.19–0.44); (b) the calculated voltage profile along the minimum energy path of formation energies, with the red line of (a) showing good agreement with the first charging–discharging experiment (0.1 C). The extracted sodium sites for each voltage plateau are indicated. Reprinted with permission from ref. 179. Copyright 2010 American Chemical Society. | ||
Lee et al.180 have recently investigated the P2–Na2/3[Ni1/3Mn2/3]O2 system, which exhibits good cycling performance and high rate capability. The phase transformation from P2 to O2 was simulated using DFT by considering specific ordered arrangements of Na ions found for Na contents of 1/3 and 1/2 per formula unit, corresponding to voltage steps in the charging profile. Nudged elastic band (NEB) calculations also indicate that Na-ion diffusivity in the P2 structure is higher than that in the corresponding O3-structured Li compounds.
Hinuma et al.181 constructed phase diagrams for NaxCoO2 by combining DFT methods (both GGA and GGA + U) with cluster-expansion and Monte Carlo simulation techniques; comparison of calculated ground states, Na intercalation voltages, c lattice parameters of the hexagonal cell, and Na1/Na2 ratios with experimental results suggests that GGA is a good approximation for the composition range 0.5 ≤ x ≤ 0.8.
8.2 Sodium-polyanion materials
Computational techniques have also been applied recently to a variety of sodium-based polyanion compounds.183–187 Using DFT methods, Ong et al.183 have examined the differences in the voltage, phase stability and diffusion barriers of a range of Na-ion and Li-ion based materials. The calculated voltages for the Na-based compounds are 0.18–0.57 V lower than those of the corresponding Li voltages (Fig. 18), which is believed to be largely a cathodic effect related to the much smaller energy gain from inserting Na into the host structure compared to inserting Li. In terms of phase stability, they found that open structures, such as the layered and NASICON structures, have both Na and Li analogues, whereas for the close-packed AMPO4 structures, Na generally prefers the maricite structure, while Li prefers the olivine structure, in agreement with previous experimental reports. They also found that the barriers for Na+ migration can potentially be lower than those for Li+ migration in the layered structures.183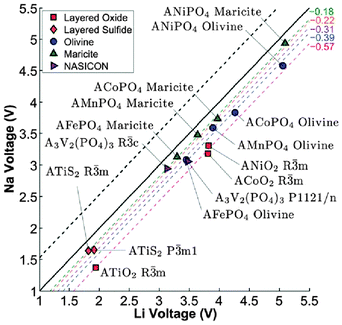 | ||
| Fig. 18 Calculated Na voltage vs. calculated Li voltage for different structures. The black dashed line indicates the +0.53 V difference between the cohesive energies of Na and Li, while the other coloured dashed lines indicate the fitted average voltage difference ΔVNa–Li. Reproduced from ref. 183 with permission from The Royal Society of Chemistry. | ||
Tripathi et al. used potentials-based methods184 to compare the Na conduction properties of olivines NaMPO4 (M = Fe, Mn) with layer-structured Na2FePO4F (Fig. 19); the activation energy for Na-ion conduction in NaFePO4 along the 1D channels is slightly lower than for Li-ion migration in LiFePO4. The migration barriers (∼0.4 eV) in layered Na2FePO4F are equally favourable, indicating high Na-ion mobility through a 2D network within the ac plane of the orthorhombic Pnma structure (Fig. 19). The results reveal the crucial importance of the volume-expansion-induced strain during Na+ (de)intercalation, which is greater than for the Li+ ion for steric reasons, suggesting that materials with a high volume difference between the end-member phases will lead to poor rate capability and faster capacity fade.
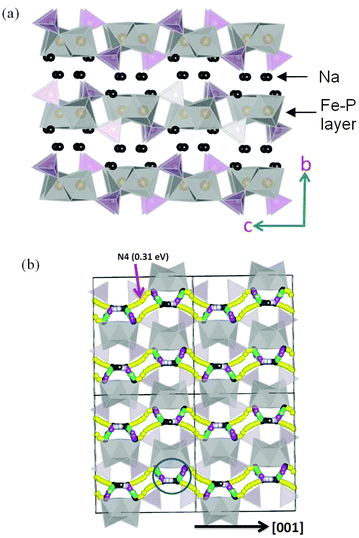 | ||
| Fig. 19 (a) Structure of layered Na2FePO4F (orthorhombic Pnma) showing Fe (grey) and P (purple) polyhedral layers; (b) Na-ion migration paths along the a and c axes in Na2FePO4F; octahedral FeO4F2 and tetrahedral PO4 are represented by grey and yellow respectively. Reproduced from ref. 184 with permission from The Royal Society of Chemistry. | ||
It was concluded that, where the activation energy for Na-ion transport is high and the volume expansion is also significant, extremely poor electrochemical performance can be predicted for Na-based cathodes (as found for NaFeSO4F (ref. 114)). From these results, Tripathi et al.184 suggest that, in general, important considerations for the design of future Na-ion electrodes are a combination of low activation energy for Na+ transport and low volume expansion (e.g. <5%), along with no antisite defects to impede sodium-ion diffusion.
DFT calculations of Kim et al.185 on the pyrophosphate Na2FeP2O7 revealed two kinds of reactions over the entire voltage range of 2.0–4.5 V (vs. Na/Na+): a single-phase reaction around 2.5 V and a series of two-phase reactions in the voltage range of 3.0–3.25 V. DFT studies on the Mn-based pyrophosphate Na2MnP2O7,186 which exhibits electrochemical activity superior to that of its Li analogue (monoclinic Li2MnP2O7), suggest that the enhanced kinetics of Na2MnP2O7 is due to the locally flexible accommodation of Jahn–Teller distortions aided by the corner-sharing polyhedra in the triclinic crystal structure.
9 Conclusions and future outlook
This review has highlighted the valuable role that advanced computational techniques now play in contemporary studies of materials for lithium-ion batteries by focusing on research into a broad range of positive electrode (cathode) materials encompassing layered, spinel and polyanionic framework compounds. We have also included a timely overview of recent work in the growing area of new sodium-ion cathode materials for potential use in batteries for large-scale grid storage.The principal aims of computer modelling can be summarised as follows:
(a) to complement and assist in the analysis of experimental results (e.g., crystal structures, cell voltages, rate capabilities);
(b) to elucidate key atomic-scale features and provide fundamental understanding of processes that are difficult to extract from experiment alone (e.g., ion diffusion paths and dimensionality, defect chemistry, surfaces of nanomaterials);
(c) to play a predictive role in the development of promising new electrode materials.
It is clear that for next-generation portable electronics and electric vehicles, new rechargeable battery materials exhibiting improved safety, higher energy density, lower cost, faster charge–discharge rates and longer cycle life are needed. Future computational studies and improvements in simulation techniques are likely to address many of these challenges and will encompass the following important areas:
(i) New materials. At present, most research into lithium and sodium battery materials using DFT and potentials-based techniques is concerned with voltage, ion diffusion and structural properties of bulk materials; this is set to continue as they are used to study an ever-increasing range of novel materials of greater compositional and structural complexity. The use of high-throughput ab initio computational tools will also continue to help screen large numbers of new candidate compounds.
(ii) Surfaces and nanostructured materials. There is increased interest in modelling surfaces and nanostructured materials. Key features include grain boundaries, surface structures, and heterointerfaces (whether solid–solid or solid–liquid), particularly their effects on ionic and electronic transport. For example, future computational studies on nanomaterials will play an increasing role in revealing how hydroxylation and electrolyte molecules affect the nanoelectrode surfaces.
(iii) Simulation techniques. Another consequence of the continuing growth in computer power will be the increasing use of computationally expensive techniques such as hybrid functional DFT and QM/MM embedded cluster methods. At present the small number of atoms and short time spans (a few picoseconds) that can be treated using ab initio molecular dynamics (MD) makes it difficult to extract statistically meaningful transport data. Use of long time-scale MD (>1 ns), currently limited to potentials-based models, will be particularly useful for studying insertion kinetics and nanostructures. Other technique developments include global evolutionary algorithms to explore low energy structures, and increased coupling between computation and experimental techniques, encompassing solid-state NMR, pair distribution function (PDF) analysis and maximum entropy methods.
In conclusion, whichever direction the future takes, it is clear that major advances in lithium- and sodium-ion batteries for electronics, electric vehicles and grid storage will depend on exploring new materials and concepts, and on a greater fundamental understanding of their operation on the atomic and nano scales.
Acknowledgements
This work has been supported by the EPSRC, the Supergen Energy Storage consortium, the Materials Chemistry Consortium and the Alistore ERI. The authors are grateful for valuable discussions with group members and collaborators, including A. R. Armstrong, P. G. Bruce, J. M. Clark, C. Eames, C. Masquelier, L. F. Nazar, P. Panchmatia, S. C. Parker, D. A. Tompsett, A. Walsh, A. Whiteside and S. Wood.Notes and references
- M. S. Whittingham, MRS Bull., 2008, 33, 411 CrossRef CAS.
- B. Dunn, H. Kamath and J.-M. Tarascon, Science, 2011, 334, 928 CrossRef CAS PubMed.
- J. Liu, J.-G. Zhang, Z. Yang, J. P. Lemmon, C. Imhoff, G. L. Graff, L. Li, J. Hu, C. Wang, J. Xiao, G. Xia, V. V. Viswanathan, S. Baskaran, V. Sprenkle, X. Li, Y. Shao and B. Schwenzer, Adv. Funct. Mater., 2013, 23, 929 CrossRef CAS.
- M. R. Palacín, Chem. Soc. Rev., 2009, 38, 2565 RSC.
- M. M. Thackeray, C. Wolverton and E. D. Isaacs, Energy Environ. Sci., 2012, 4, 7854 Search PubMed.
- M. S. Whittingham, Chem. Rev., 2004, 104, 4271 CrossRef CAS; C. Masquelier and L. Croguennec, Chem. Rev., 2013, 113, 6552 CrossRef PubMed.
- M. Armand and J.-M. Tarascon, Nature, 2008, 451, 652 CrossRef CAS PubMed.
- P. G. Bruce, Solid State Ionics, 2008, 179, 752 CrossRef CAS PubMed; P. G. Bruce, S. A. Freunberger, L. J. Hardwick and J.-M. Tarascon, Nat. Mater., 2012, 11, 19 CrossRef PubMed.
- M. Park, X. Zhang, M. Chung, G. B. Less and A. M. Sastry, J. Power Sources, 2010, 195, 7904 CrossRef CAS PubMed.
- B. Scrosati and J. Garche, J. Power Sources, 2010, 195, 2419 CrossRef CAS PubMed; B. Scrosati, J. Hassoun and Y.-K. Sun, Energy Environ. Sci., 2011, 4, 3287 Search PubMed.
- J. B. Goodenough, Chem. Mater., 2010, 22, 587 CrossRef CAS; J. B. Goodenough and K.-S. Park, J. Am. Chem. Soc., 2013, 135, 1167 CrossRef PubMed.
- V. Etacheri, R. Marom, R. Elazari, G. Sailtra and D. Aurbach, Energy Environ. Sci., 2011, 4, 3243 CAS.
- K. Takada, Acta Mater., 2013, 61, 759 CrossRef CAS PubMed; Z. Gong and Y. Yang, Energy Environ. Sci., 2011, 4, 3223 Search PubMed.
- J. W. Fergus, J. Power Sources, 2010, 195, 939 CrossRef CAS PubMed.
- B. L. Ellis, K. T. Lee and L. F. Nazar, Chem. Mater., 2010, 22, 691 CrossRef CAS.
- B. Xu, D. Qian, Z. Wang and Y. S. Meng, Mater. Sci. Eng., R, 2012, 73, 51 CrossRef CAS PubMed; P. He, H. Yu, D. Li and H. Zhou, J. Mater. Chem., 2012, 22, 3680 RSC.
- J. B. Goodenough, J. Power Sources, 2007, 174, 996 CrossRef CAS PubMed.
- K. Zaghib, A. Guerfi, P. Hovington, A. Vijh, M. Trudeau, A. Mauger, J. B. Goodenough and C. M. Julien, J. Power Sources, 2013, 232, 357 CrossRef CAS PubMed.
- B. L. Ellis and L. F. Nazar, Curr. Opin. Solid State Mater. Sci., 2012, 16, 168 CrossRef CAS PubMed.
- S. W. Kim, D.-H. Seo, X. Ma, G. Ceder and K. Kang, Adv. Energy Mater., 2012, 2, 710 CrossRef CAS.
- V. Palomares, P. Serras, I. Villaluenga, K. B. Hueso, J. Carretero-González and T. Rojo, Energy Environ. Sci., 2012, 5, 5884 CAS.
- J. W. Fergus, Solid State Ionics, 2012, 227, 102 CrossRef CAS PubMed.
- M. D. Slater, D. Kim, E. Lee and C. S. Johnson, Adv. Funct. Mater., 2013, 23, 947 CrossRef CAS; N. Yabuuchi, M. Kajiyama, J. Iwatate, H. Nishikawa, S. Hitomi, R. Okuyama, R. Usui, Y. Yamada and S. Komaba, Nat. Mater., 2012, 11, 512 CrossRef PubMed; A. Ponrouch, R. Dedryvère, D. Monti, A. E. Demet, J. M. Ateba Mba, L. Croguennec, C. Masquelier, P. Johansson and M. R. Palacín, Energy Environ. Sci., 2013, 6, 2361 Search PubMed; H. Pan, Y.-S. Hu and L. Chen, Energy Environ. Sci., 2013, 6, 2338 Search PubMed.
- Computer Modelling in Inorganic Crystallography, ed. C. R. A. Catlow, Academic Press, San Diego, 1997 Search PubMed.
- J. H. Harding, Rep. Prog. Phys., 1990, 53, 1403 CrossRef CAS; C. R. A. Catlow, Z. X. Guo, M. Miskufova, S. A. Shevlin, A. G. H. Smith, A. A. Sokol, A. Walsh, D. J. Wilson and S. M. Woodley, Philos. Trans. R. Soc., A, 2010, 368, 3379 CrossRef PubMed.
- Computational Methods for Energy Materials, ed. A. Walsh, A. A. Sokol and C. R. A. Catlow, John Wiley & Sons, Ltd, Chichester, 2013 Search PubMed.
- Y. S. Meng and M. E. Arroyo-de Dompablo, Energy Environ. Sci., 2009, 2, 589 Search PubMed; Y. S. Meng and M. E. Arroyo-de Dompablo, Acc. Chem. Res., 2013, 46, 1171 CrossRef CAS PubMed.
- G. Ceder, MRS Bull., 2011, 35, 693 CrossRef.
- J. D. Gale and A. L. Rohl, Mol. Simul., 2003, 29, 291 CrossRef CAS.
- I. T. Todorov, W. Smith, K. Trachenko and M. T. Dove, J. Mater. Chem., 2006, 16, 1911 RSC.
- W. Kohn and L. J. Sham, Phys. Rev, 1965, 140, A1133–A1138 CrossRef.
- W. Koch and M. C. Holthausen, A Chemist's Guide to Density Functional Theory, Wiley-VCH, Weinheim, 2001 Search PubMed.
- C. J. Cramer and D. G. Truhlar, Phys. Chem. Chem. Phys., 2009, 11, 10757 RSC; V. L. Chevrier, S. P. Ong, R. Armiento, M. K. Y. Chan and G. Ceder, Phys. Rev. B: Condens. Matter Mater. Phys., 2010, 82, 075122 CrossRef CAS; J. P. Perdew, MRS Bull., 2013, 38, 743 CrossRef.
- G. Kresse and J. Furthmüller, Phys. Rev. B: Condens. Matter Mater. Phys., 1996, 54, 11169 CrossRef CAS; J. Hafner, J. Comput. Chem., 2008, 29, 2044 CrossRef PubMed.
- M. C. Payne, M. P. Teter, D. C. Allan, T. A. Arias and J. D. Joannopoulos, Rev. Mod. Phys., 1992, 64, 1045 CrossRef CAS.
- B. Civalleri, Ph. D'Arco, R. Orlando, V. R. Saunders and R. Dovesi, Chem. Phys. Lett., 2001, 348, 131 CrossRef CAS.
- K. Schwarz and P. Blaha, Comput. Mater. Sci., 2003, 28, 259 CrossRef CAS.
- C. R. A. Catlow and S. M. Woodley, J. Mater. Chem., 2006, 16, 1883 RSC.
- K. Mizushima, P. C. Jones, P. J. Wiseman and J. B. Goodenough, Mater. Res. Bull., 1980, 15, 783 CrossRef CAS.
- M. G. S. R. Thomas, P. G. Bruce and J. B. Goodenough, Solid State Ionics, 1985, 17, 13 CrossRef CAS.
- A. K. Padhi, K. S. Nanjundaswamy and J. B. Goodenough, J. Electrochem. Soc., 1997, 144, 1188 CrossRef CAS PubMed; A. K. Padhi, K. S. Nanjundaswamy, C. Masquelier and J. B. Goodenough, J. Electrochem. Soc., 1997, 144, 2581 CrossRef PubMed.
- N. Ravet, Y. Chouinard, J. F. Magnan, S. Besner, M. Gauthier and M. Armand, J. Power Sources, 2001, 97–98, 503 CrossRef CAS.
- S. Y. Chung, J. T. Bloking and Y. M. Chiang, Nat. Mater., 2002, 1, 123 CrossRef CAS PubMed.
- P. Subramanya Herle, B. Ellis, N. Coombs and L. F. Nazar, Nat. Mater., 2004, 3, 147 CrossRef PubMed.
- C. Delacourt, L. Laffont, R. Bouchet, C. Wurm, J. B. Leriche, M. Morcrette, J. M. Tarascon and C. Masquelier, J. Electrochem. Soc., 2005, 152, A913 CrossRef CAS PubMed.
- R. Amin, P. Balaya and J. Maier, Electrochem. Solid-State Lett., 2007, 10, A13 CrossRef CAS PubMed.
- J. Chen, M. J. Vacchio, S. Wang, N. Chernova, P. Y. Zavalij and M. S. Whittingham, Solid State Ionics, 2008, 178, 1676 CrossRef CAS PubMed.
- T. Muraliganth, A. V. Murugan and A. Manthiram, J. Mater. Chem., 2008, 18, 5661 RSC.
- A. Nytén, A. Abouimrane, M. Armand, T. Gustafsson and J. O. Thomas, Electrochem. Commun., 2005, 7, 156 CrossRef PubMed.
- C. Sirisopanaporn, R. Dominko, C. Masquelier, A. R. Armstrong, G. Maliad and P. G. Bruce, J. Mater. Chem., 2011, 21, 17823 RSC.
- M. S. Islam, R. Dominko, C. Masquelier, C. Sirisopanaporn, A. R. Armstrong and P. G. Bruce, J. Mater. Chem., 2011, 21, 9811 RSC.
- N. Recham, J.-N. Chotard, L. Dupont, C. Delacourt, W. Walker, M. Armand and J.-M. Tarascon, Nat. Mater., 2010, 9, 68 CrossRef CAS PubMed.
- P. Barpanda, M. Ati, B. C. Melot, G. Rousse, J.-N. Chotard, M.-L. Doublet, M. T. Sougrati, S. A. Corr, J.-C. Jumas and J.-M. Tarascon, Nat. Mater., 2011, 10, 772 CrossRef CAS PubMed.
- M. K. Aydinol, A. F. Kohan, G. Ceder, K. Cho and J. Joannopoulos, Phys. Rev. B: Condens. Matter Mater. Phys., 1997, 56, 1354 CrossRef CAS.
- G. Ceder, Y.-M. Chiang, D. R. Sadoway, M. K. Aydinol, Y.-I. Jang and B. Huang, Nature, 1998, 392, 694 CrossRef CAS PubMed.
- J. S. Braithwaite, C. R. A. Catlow, J. D. Gale, J. H. Harding and P. E. Ngoepe, J. Mater. Chem., 2000, 10, 239 RSC.
- F. Zhou, M. Cococcioni, C. A. Marianetti, D. Morgan and G. Ceder, Phys. Rev. B: Condens. Matter Mater. Phys., 2004, 70, 235121 CrossRef; T. Maxisch, F. Zhou and G. Ceder, Phys. Rev. B: Condens. Matter Mater. Phys., 2006, 73, 104301 CrossRef.
- J. Bréger, M. Jiang, N. Dupré, Y. S. Meng, Y. Shao-Horn, G. Ceder and C. P. Grey, J. Solid State Chem., 2005, 178, 2575 CrossRef CAS PubMed; P. Xiao, Z. Q. Deng, A. Manthiram and G. Henkelman, J. Phys. Chem. C, 2012, 116, 23201 Search PubMed.
- S. Laubach, S. Laubach, P. C. Schmidt, D. Ensling, S. Schmid, W. Jaegermann, A. Thißen, K. Nikolowskid and H. Ehrenberg, Phys. Chem. Chem. Phys., 2009, 11, 3278 RSC.
- R. Malik, F. Zhou and G. Ceder, Phys. Rev. B: Condens. Matter Mater. Phys., 2009, 79, 214201 CrossRef.
- A. Van der Ven, M. K. Aydinol, G. Ceder, G. Kresse and J. Hafner, Phys. Rev. B: Condens. Matter Mater. Phys., 1998, 58, 2975 CrossRef CAS.
- D. Carlier, A. Van der Ven, C. Delmas and G. Ceder, Chem. Mater., 2003, 15, 2651 CrossRef CAS.
- J. Kim, D. S. Middlemiss, N. A. Chernova, B. Y. X. Zhu, C. Masquelier and C. P. Grey, J. Am. Chem. Soc., 2010, 132, 16825 CrossRef CAS PubMed.
- G. Mali, A. Meden and R. Dominko, Chem. Commun., 2010, 46, 3306 RSC.
- M. E. Arroyo-de Dompablo, M. Armand, J. M. Tarascon and U. Amador, Electrochem. Commun., 2006, 8, 1292 CrossRef CAS PubMed.
- M. E. Arroyo-deDompablo, R. Dominko, J. M. Gallardo-Amores, L. Dupont, G. Mali, H. Ehrenberg, J. Jamnik and E. Morán, Chem. Mater., 2008, 20, 5574 CrossRef CAS.
- S. Q. Wu, Z. Z. Zhu, Y. Yang and Z. F. Hou, Comput. Mater. Sci., 2009, 44, 1243 CrossRef CAS PubMed.
- G. Zhong, Y. Li, P. Yan, Z. Liu, M. Xie and H. Lin, J. Phys. Chem. C, 2010, 114, 3693 CAS.
- P. Larsson, R. Ahuja, A. Liivat and J. O. Thomas, Comput. Mater. Sci., 2010, 178 Search PubMed; A. Liivat, Solid State Ionics, 2012, 228, 19 CrossRef CAS PubMed.
- D.-H. Seo, H. Kim, I. Park, J. Hong and K. Kang, Phys. Rev. B: Condens. Matter Mater. Phys., 2011, 84, 220106 CrossRef.
- D. W. Su, H. Ahn and G. X. Wang, Appl. Phys. Lett., 2011, 99, 141909 CrossRef.
- A. Liivat and J. O. Thomas, Solid State Ionics, 2011, 192, 58 CrossRef CAS PubMed.
- P. Zhang, C. H. Hu, S. Q. Wu, Z. Z. Zhu and Y. Yang, Phys. Chem. Chem. Phys., 2012, 14, 7346 RSC; R. C. Longo, K. Xiong and K. Cho, J. Electrochem. Soc., 2013, 160, A60 CrossRef CAS PubMed; M. M. Kalantarian, S. Asgari and P. Mustarelli, J. Mater. Chem. A, 2013, 1, 2847 Search PubMed.
- A. Saracibar, A. Van der Ven and M. E. Arroyo-de Dompablo, Chem. Mater., 2012, 24, 495 CrossRef CAS.
- C. Eames, A. R. Armstrong, P. G. Bruce and M. S. Islam, Chem. Mater., 2012, 24, 2155 CrossRef CAS.
- A. R. Armstrong, N. Kuganathan, M. S. Islam and P. G. Bruce, J. Am. Chem. Soc., 2011, 133, 13031 CrossRef CAS PubMed.
- N. Kuganathan and M. S. Islam, Chem. Mater., 2009, 21, 5196 CrossRef CAS; C. A. J. Fisher, N. Kuganathan and M. S. Islam, J. Mater. Chem. A, 2013, 1, 4207 Search PubMed.
- Y. Cai, X. Xu, F. Du, Z. Li, X. Meng, C. Wang and Y. J. Wei, J. Phys. Chem. C, 2011, 115, 7032 CAS.
- C. Frayret, A. Villesuzanne, N. Spaldin, E. Bousquet, J.-N. Chotard, N. Recham and J.-M. Tarascon, Phys. Chem. Chem. Phys., 2010, 12, 15512 RSC; M. Ramzan, S. Lebègue, T. W. Kang and R. Ahuja, J. Phys. Chem. C, 2011, 115, 2600 Search PubMed.
- S. C. Chung, P. Barpanda, S. Nishimura, Y. Yamada and A. Yamada, Phys. Chem. Chem. Phys., 2012, 14, 8678 RSC.
- M. Ben Yahia, F. Lemoigno, G. Rousse, F. Boucher, J.-M. Tarascon and M.-L. Doublet, Energy Environ. Sci., 2012, 5, 9584 CAS.
- G. Hautier, A. Jain, S. P. Ong, B. Kang, C. Moore, R. Doe and G. Ceder, Chem. Mater., 2011, 23, 3495 CrossRef CAS; G. Hautier, A. Jain, H. Chen, C. Moore, S. P. Ong and G. Ceder, J. Mater. Chem., 2011, 21, 17147 RSC.
- A. Van der Ven and G. Ceder, Electrochem. Solid-State Lett., 2000, 3, 301 CrossRef CAS PubMed.
- A. Van der Ven and G. Ceder, J. Power Sources, 2001, 97–98, 529 CrossRef CAS.
- J. Reed and G. Ceder, Electrochem. Solid-State Lett., 2002, 5, A145 CrossRef CAS PubMed; M. E. Arroyo y de Dompablo, A. Van der Ven and G. Ceder, Phys. Rev. B: Condens. Matter Mater. Phys., 2002, 66, 064112 CrossRef.
- M. S. Islam, R. A. Davies and J. D. Gale, Chem. Mater., 2003, 15, 4280 CrossRef CAS.
- S. H. Choi, O. A. Shlyakhtin, J. Kim and Y. S. Yoon, J. Power Sources, 2005, 140, 355 CrossRef CAS PubMed.
- K. Kang, Y. S. Meng, J. Bréger, C. P. Grey and G. Ceder, Science, 2006, 311, 977 CrossRef CAS PubMed.
- S. Laubach, S. Laubach, P. C. Schmidt, M. Gröting, K. Albe, W. Jaegermann and W. Wolf, Z. Phys. Chem., 2009, 223, 1327 CrossRef CAS.
- B. Ammundsen, J. Rozière and M. S. Islam, J. Phys. Chem. B, 1997, 101, 8156 CrossRef CAS.
- M. Atanasov, J.-L. Barras, L. Benco and C. Daul, J. Am. Chem. Soc., 2000, 122, 4718 CrossRef CAS.
- Y. Koyama, I. Tanaka, H. Adachi, Y. Uchimoto and M. Wakihara, J. Electrochem. Soc., 2003, 150, A63 CrossRef CAS PubMed.
- B. Xu and Y. S. Meng, J. Power Sources, 2010, 195, 4971 CrossRef CAS PubMed.
- M.-C. Yang, B. Xu, J.-H. Cheng, C.-J. Pan, B.-J. Hwang and Y. S. Meng, Chem. Mater., 2011, 23, 2832 CrossRef CAS.
- M. Nakayama, M. Kaneko and M. Wakihara, Phys. Chem. Chem. Phys., 2012, 14, 13963 RSC.
- C. Y. Ouyang, S. Q. Shi, Z. X. Wang, H. Li, X. J. Huang and L. Q. Chen, Europhys. Lett., 2004, 67, 28 CrossRef CAS.
- K. Tateishi, D. du Boulay, N. Ishizawa and K. Kawamura, J. Solid State Chem., 2003, 174, 175 CrossRef CAS; K. Tateishi, D. du Boulay and N. Ishizawa, Appl. Phys. Lett., 2004, 84, 529 CrossRef; N. Ishizawa and K. Tateishi, J. Ceram. Soc. Jpn., 2009, 117, 6 CrossRef.
- D. Morgan, A. Van der Ven and G. Ceder, Electrochem. Solid-State Lett., 2004, 7, A30 CrossRef CAS PubMed.
- Z. Liu and X. Huang, Solid State Ionics, 2010, 181, 1209 CrossRef CAS PubMed.
- M. S. Islam, D. J. Driscoll, C. A. J. Fisher and P. R. Slater, Chem. Mater., 2005, 17, 5085 CrossRef CAS.
- C. A. J. Fisher, V. M. Hart Prieto and M. S. Islam, Chem. Mater., 2008, 20, 5907 CrossRef CAS.
- S. Nishimura, Y. Kobayashi, K. Ohayama, R. Kanno, M. Yashima, Y. Yamaguchi and A. Yamada, Nat. Mater., 2008, 7, 707 CrossRef CAS PubMed.
- R. Malik, A. Abdellahi and G. Ceder, J. Electrochem. Soc., 2013, 160, A3179 CrossRef CAS PubMed.
- S. Adams, J. Solid State Electrochem., 2010, 14, 1787 CrossRef CAS PubMed.
- S. E. Boulfelfel, G. Seifert and S. Leoni, J. Mater. Chem., 2011, 21, 16365 RSC.
- J. J. Yang and J. S. Tse, J. Phys. Chem. A, 2011, 115, 13045 CrossRef CAS PubMed.
- C. Kuss, G. Liang and S. B. Schougaard, J. Mater. Chem., 2012, 22, 24889 RSC; C. Tealdi, C. Spreafico and P. Mustarelli, J. Mater. Chem., 2012, 22, 24870 RSC.
- G. K. P. Dathar, D. Sheppard, K. Stevenson and G. Henkelman, Chem. Mater., 2011, 23, 4032 CrossRef CAS.
- S. Nishimura, M. Nakamura, R. Natsui and A. Yamada, J. Am. Chem. Soc., 2010, 132, 13596 CrossRef CAS PubMed; P. Barpanda, S. Nishimura and A. Yamada, Adv. Energy Mater., 2012, 2, 841 CrossRef.
- H. Kim, S. Lee, Y.-U. Park, H. Kim, J. Kim, S. Jeon and K. Kang, Chem. Mater., 2011, 23, 3930 CrossRef CAS; H. Kim, I. Park, D.-H. Seo, S. Lee, S.-W. Kim, W. J. Kwon, Y.-U. Park, C. S. Kim, S. Jeon and K. Kang, J. Am. Chem. Soc., 2012, 134, 10369 CrossRef PubMed.
- H. Zhou, S. Upreti, N. A. Chernova, G. Hautier, G. Ceder and M. S. Whittingham, Chem. Mater., 2011, 23, 293 CrossRef CAS.
- J. M. Clark, S. Nishimura, A. Yamada and M. S. Islam, Angew. Chem., Int. Ed., 2012, 51, 13149 CrossRef CAS PubMed.
- S. Lee and S. S. Park, Chem. Mater., 2012, 24, 3550 CrossRef CAS.
- R. Tripathi, G. R. Gardiner, M. S. Islam and L. F. Nazar, Chem. Mater., 2011, 23, 2278 CrossRef CAS.
- S. Adams and R. Prasada Rao, Solid State Ionics, 2011, 184, 57 CrossRef CAS PubMed.
- T. Mueller, G. Hautier, A. Jain and G. Ceder, Chem. Mater., 2011, 23, 3854 CrossRef CAS.
- Y. Janssen, D. S. Middlemiss, S.-H. Bo, C. P. Grey and P. G. Khalifah, J. Am. Chem. Soc., 2012, 134, 12516 CrossRef CAS PubMed.
- S. Lee and S. S. Park, J. Phys. Chem. C, 2012, 116, 6484 CAS.
- S. Y. Chung, S. Y. Choi, T. Yamamoto and Y. Ikuhara, Phys. Rev. Lett., 2008, 100, 125502 CrossRef.
- P. V. Sushko, K. M. Rosso, J.-G. Zhang, J. Liu and M. L. Sushko, Adv. Funct. Mater., 2013 DOI:10.1002/adfm.201301205.
- G. Gardiner and M. S. Islam, Chem. Mater., 2010, 22, 1242 CrossRef CAS.
- J. Lee, W. Zhou, J. C. Idrobo, S. J. Pennycook and S. T. Pantelides, Phys. Rev. Lett., 2011, 107, 085507 CrossRef; J. Lee, S. J. Pennycook and S. T. Pantelides, Appl. Phys. Lett., 2012, 101, 033901 CrossRef.
- G. Butt, N. Sammes, G. Tompsett, A. Smirnova and O. Yamamoto, J. Power Sources, 2004, 134, 72 CrossRef CAS PubMed; C. Delacourt, C. Wurm, L. Laffont, J. B. Leriche and C. Masquelier, Solid State Ionics, 2006, 177, 333 CrossRef PubMed.
- J. Wolfenstine, J. Power Sources, 2006, 158, 1431 CrossRef CAS PubMed.
- B. Ellis, P. Subramanya Herle, Y.-H. Rho, L. F. Nazar, R. Dunlap, L. K. Perry and D. H. Ryan, Faraday Discuss., 2007, 134, 119 RSC.
- C. Ban, W.-J. Yin, H. Tang, S.-H. Wei, Y. Yan and A. C. Dillon, Adv. Energy Mater., 2012, 2, 1028 CrossRef CAS.
- K. Hoang and M. Johannes, Chem. Mater., 2011, 23, 3003 CrossRef CAS; K. Hoang and M. D. Johannes, J. Power Sources, 2012, 206, 274 CrossRef PubMed.
- M. Armand, J.-M. Tarascon and M. E. Arroyo-de Dompablo, Electrochem. Commun., 2011, 13, 1047 CrossRef CAS PubMed.
- P. G. Bruce, B. Scrosati and J. M. Tarascon, Angew. Chem., Int. Ed., 2008, 47, 2930 CrossRef CAS PubMed.
- S. Franger, C. Benoit, C. Bourbon and F. Le Cras, J. Electrochem. Soc., 2006, 67, 1338 CAS.
- B. Ellis, W. H. Kan, W. R. M. Makahnouk and L. F. Nazar, J. Mater. Chem., 2007, 17, 3248 RSC; G. Chen, X. Song and T. J. Richardson, Electrochem. Solid-State Lett., 2006, 9, A295 CrossRef CAS PubMed.
- R. Malik, D. Burch, M. Bazant and G. Ceder, Nano Lett., 2010, 10, 4123 CrossRef CAS PubMed.
- J. Maier, Nat. Mater., 2005, 4, 815 CrossRef CAS; Q. Zhang, E. Uchaker, S. L. Candelariaza and G. Cao, Chem. Soc. Rev., 2013, 42, 3127 RSC.
- R. Liu, J. Duay and S. B. Lee, Chem. Commun., 2011, 47, 1384 RSC.
- C. R. A. Catlow, S. T. Bromley, S. Hamad, M. Mora-Fonz, A. A. Sokola and S. M. Woodley, Phys. Chem. Chem. Phys., 2010, 12, 786 RSC.
- D. Kramer and G. Ceder, Chem. Mater., 2009, 21, 3799 CrossRef CAS.
- B. Xu, C. R. Fell, M. Chi and Y. S. Meng, Energy Environ. Sci., 2011, 4, 2223 CAS.
- D. Qian, Y. Hinuma, H. Chen, L.-S. Du, K. Carroll, G. Ceder, C. P. Grey and Y. S. Meng, J. Am. Chem. Soc., 2012, 134, 609 Search PubMed.
- L. Dahéron, H. Martinez, R. Dedryvère, I. Baraille, M. Ménétrier, C. Denage, C. Delmas and D. Gonbeau, J. Phys. Chem. C, 2009, 113, 5843 Search PubMed.
- Y. Kim, H. Lee and S. Kang, J. Mater. Chem., 2012, 22, 12874 RSC.
- C. A. J. Fisher, R. Huang, T. Hitosugi, H. Moriwake, A. Kuwabara, Y. H. Ikuhara, H. Oki and Y. Ikuhara, Nanosci. Nanotechnol. Lett., 2012, 4, 165 CrossRef CAS PubMed; H. Moriwake, A. Kuwabara, C. A. J. Fisher, R. Huang, T. Hitosugi, Y. H. Ikuhara, H. Oki and Y. Ikuhara, Adv. Mater., 2013, 25, 618 CrossRef PubMed.
- S. Zheng, C. A. J. Fisher, T. Hitosugi, Y. H. Ikuhara, A. Kuwabara, H. Moriwake, H. Oki and Y. Ikuhara, Acta Mater., 2013, 61, 7671 CrossRef CAS PubMed.
- K. Leung and J. L. Budzien, Phys. Chem. Chem. Phys., 2010, 12, 6583 RSC.
- R. Huang, Y. H. Ikuhara, T. Mizoguchi, S. D. Findlay, A. Kuwabara, C. A. J. Fisher, H. Moriwake, H. Oki, T. Hirayama and Y. Ikuhara, Angew. Chem., Int. Ed., 2011, 50, 3053 CrossRef CAS PubMed.
- H. Ikeno, T. Mizoguchi, Y. Koyama, Z. Ogumi, Y. Uchimoto and I. Tanaka, J. Phys. Chem. C, 2011, 115, 11871 CAS.
- R. Benedek and M. M. Thackeray, Phys. Rev. B: Condens. Matter Mater. Phys., 2011, 83, 195439 CrossRef.
- A. Karim, S. Fosse and K. A. Persson, Phys. Rev. B: Condens. Matter Mater. Phys., 2013, 87, 075322 CrossRef.
- C. Y. Ouyang, Ž. Šljivančanin and A. Baldereschi, J. Chem. Phys., 2010, 133, 204701 CrossRef CAS PubMed; K. Leung, J. Phys. Chem. C, 2012, 116, 9852 Search PubMed.
- T. X. T. Sayle, R. R. Maphanga, P. E. Ngoepe and D. C. Sayle, J. Am. Chem. Soc., 2009, 131, 6161 CrossRef CAS PubMed; R. R. Maphanga, D. C. Sayle, T. X. T. Sayle and P. E. Ngoepe, Phys. Chem. Chem. Phys., 2011, 13, 1307 RSC.
- D. A. Tompsett, S. C. Parker, P. G. Bruce and M. S. Islam, Chem. Mater., 2013, 25, 536 CrossRef CAS.
- L. Wang, F. Zhou, Y. S. Meng and G. Ceder, Phys. Rev. B: Condens. Matter Mater. Phys., 2007, 76, 165435 CrossRef.
- C. A. J. Fisher and M. S. Islam, J. Mater. Chem., 2008, 18, 1209 RSC.
- G. D. Smith, O. Borodin, S. P. Russo, R. J. Rees and A. F. Hollenkamp, Phys. Chem. Chem. Phys., 2009, 11, 9884 RSC.
- W. T. Geng, D. H. Ping, J. Nara and T. Ohno, J. Phys. Chem. C, 2012, 116, 17650 CAS.
- S. Ganapathy and M. Wagemaker, ACS Nano, 2012, 6, 8702 CrossRef CAS PubMed.
- M. Vijayakumar, S. Kerisit, K. M. Rosso, S. D. Burton, J. A. Sears, Z. Yang, G. L. Graff, J. Liu and J. Hu, J. Power Sources, 2011, 196, 2211 CrossRef CAS PubMed.
- Z. J. Ding, L. Zhao, L. M. Suo, Y. Jiao, S. Meng, Y. S. Hu, Z. X. Wang and L. Q. Chen, Phys. Chem. Chem. Phys., 2011, 13, 15127 RSC.
- C. Y. Ouyang, Z. Y. Zhong and M. S. Lei, Electrochem. Commun., 2007, 9, 1107 CrossRef CAS PubMed.
- A. Vittadini, M. Casarin and A. Selloni, J. Phys. Chem. C, 2009, 113, 18973 CAS.
- M. Ben Yahia, F. Lemoigno, T. Beuvier, J. S. Filhol, M. Richard-Plouet, L. Brohan and M. L. Doublet, J. Chem. Phys., 2009, 130, 204501 CrossRef PubMed.
- D. Panduwinata and J. D. Gale, J. Mater. Chem., 2009, 19, 3931 RSC.
- A. R. Armstrong, C. Arrouvel, V. Gentili, S. C. Parker, M. S. Islam and P. G. Bruce, Chem. Mater., 2010, 22, 6426 CrossRef CAS; C. Arrouvel, S. C. Parker and M. S. Islam, Chem. Mater., 2009, 21, 4778 CrossRef.
- S. Kerisit, K. M. Rosso, Z. G. Yang and J. Liu, J. Phys. Chem. C, 2010, 114, 19096 CAS.
- M. V. Koudriachova, J. Nano Res., 2010, 11, 159 CrossRef CAS.
- B. J. Morgan and P. A. Madden, Phys. Rev. B: Condens. Matter Mater. Phys., 2012, 86, 035147 CrossRef.
- A. S. Dalton, A. A. Belak and A. Van der Ven, Chem. Mater., 2012, 24, 1568 CrossRef CAS.
- A. R. Armstrong, C. Lyness, P. M. Panchmatia, M. S. Islam and P. G. Bruce, Nat. Mater., 2011, 10, 223 CrossRef CAS PubMed.
- T. Katsumata, Y. Inaguma, M. Itoh and K. Kawamura, Chem. Mater., 2002, 14, 3930 CrossRef CAS.
- S. Adams and R. Prasada Rao, J. Mater. Chem., 2012, 22, 1426 RSC.
- N. D. Lepley and N. A. W. Holzwarth, J. Electrochem. Soc., 2012, 159, A538 CrossRef CAS PubMed; K. Senevirathne, C. S. Day, M. D. Gross, A. Lachgar and N. A. W. Holzwarth, Solid State Ionics, 2013, 233, 95 CrossRef PubMed.
- K. Fujimura, A. Seko, Y. Koyama, A. Kuwabara, I. Kishida, K. Shitara, C. A. J. Fisher, H. Moriwake and I. Tanaka, Adv. Energy Mater., 2013, 3, 980 CrossRef CAS.
- N. Kamaya, K. Homma, Y. Yamakawa, M. Hirayama, R. Kanno, M. Yonemura, T. Kamiyama, Y. Kato, S. Hama, K. Kawamoto and A. Mitsui, Nat. Mater., 2011, 10, 682 CrossRef CAS PubMed.
- M. Xu, J. Ding and E. Ma, Appl. Phys. Lett., 2012, 101, 031901 CrossRef.
- J. B. Goodenough, H. Y-P. Hong and J. A. Kafalas, Mater. Res. Bull., 1976, 11, 203 CrossRef CAS.
- A. S. Nagelberg and W. L. Worrell, J. Solid State Chem., 1979, 29, 345 CrossRef CAS.
- C. Delmas, J.-J. Braconnier, C. Fouassier and P. Hagenmuller, Solid State Ionics, 1981, 3–4, 165 CrossRef CAS.
- K. M. Abraham, Solid State Ionics, 1982, 7, 199 CrossRef CAS.
- R. Bertholet, D. Carlier and C. Delmas, Nat. Mater., 2011, 10, 74 CrossRef CAS PubMed; D. Hamani, M. Ati, J.-M. Tarascon and P. Rozier, Electrochem. Commun., 2011, 13, 938 CrossRef PubMed.
- H. Kim, D. J. Kim, D.-H. Seo, M. S. Yeom, K. Kang, D. K. Kim and Y. Jung, Chem. Mater., 2012, 24, 1205 CrossRef CAS.
- D. H. Lee, J. Xu and Y. S. Meng, Phys. Chem. Chem. Phys., 2013, 15, 3304 RSC.
- Y. Hinuma, Y. S. Meng and G. Ceder, Phys. Rev. B: Condens. Matter Mater. Phys., 2008, 77, 224111 CrossRef.
- D. A. Tompsett and M. S. Islam, Chem. Mater., 2013, 25, 2515 CrossRef CAS.
- S. P. Ong, V. L. Chevrier, G. Hautier, A. Jain, C. Moore, S. Kim, X. Ma and G. Ceder, Energy Environ. Sci., 2011, 4, 3680 CAS.
- R. Tripathi, S. M. Wood, M. S. Islam and L. F. Nazar, Energy Environ. Sci., 2013, 6, 2257 CAS.
- H. Kim, R. A. Shakoor, C. Park, S. Y. Lim, J.-S. Kim, Y. N. Jo, W. Cho, K. Miyasaka, R. Kahraman, Y. Jung and J. W. Choi, Adv. Funct. Mater., 2013, 23, 1147 CrossRef CAS.
- C. S. Park, H. Kim, R. A. Shakoor, E. Yang, S. Y. Lim, R. Kahraman, Y. Jung and J. W. Choi, J. Am. Chem. Soc., 2013, 135, 2787 CrossRef CAS PubMed.
- Y. Zheng, P. Zhang, S. Q. Wu, Y. H. Wen, Z. Z. Zhu and Y. Yang, J. Electrochem. Soc., 2013, 160, A927 CrossRef CAS PubMed; R. A. Shakoor, D.-H. Seo, H. Kim, Y.-U. Park, J. Kim, S.-W. Kim, H. Gwon, S. Lee and K. Kang, J. Mater. Chem., 2012, 22, 20535 RSC.
| This journal is © The Royal Society of Chemistry 2014 |


