 Open Access Article
Accurate tuning of ordered nanotubular platinum electrodes by galvanic plating†
Valentin
Roscher‡
a,
Markus
Licklederer
b,
Johannes
Schumacher
b,
Grisell
Reyes Rios
ab,
Björn
Hoffmann
c,
Silke
Christiansen
cd and
Julien
Bachmann
*ab
aUniversity of Hamburg, Institute of Applied Physics and INCH, Sedanstrasse 19, 20146 Hamburg, Germany. E-mail: julien.bachmann@fau.de
bFriedrich Alexander University of Erlangen-Nürnberg, Institute of Inorganic Chemistry, Egerlandstrasse 1, 91058 Erlangen, Germany
cMax Planck Institute for the Science of Light, Gunther-Scharowsky-Strasse 1, 91058 Erlangen, Germany
dHelmholtz-Center Berlin (HZB), Hahn-Meitner-Platz 1, 14109 Berlin, Germany
First published on 24th October 2013
Abstract
Platinum nanotubes are created by galvanic deposition inside porous templates. The effects of the electrolyte's ion concentration and pH, of the applied potential and of the deposition duration on the morphology of the tubes are investigated systematically. The system provides a model electrode platform with accurately tunable geometry for the fundamental investigation of electrochemical transformations. For slow electrochemical reactions, we observe a linear increase of the galvanic current with the length of the nanotubes, and therefore with the specific surface area of the electrode. In contrast to this, inherently fast electrochemical transformations are diffusion-limited and give rise to the same current density independently of the geometry. These results delineate a strategy for optimizing the performance of electrochemical energy conversion devices systematically via nanostructuring the electrode surfaces.
Introduction
Nanostructured electrode surfaces are broadly considered as a promising strategy towards efficient, cost-effective energy-converting or energy-storing devices such as batteries, fuel cells, electrolyzers, and solar cells.1 Energy conversion relies on the transfer of electrons across an interface, so that the enhanced specific surface area of a structured electrode could allow for an increased throughput. Simultaneously, the transport of charge carriers (electrons and holes, but also ions and molecules) towards the interface and back away from it may become limiting. Therefore, device performance improvements by electrode nanostructuring must result from an optimized geometry which balances interface area gain with short transport paths.2Despite impressive individual achievements, a general knowledge of the scientific parameters underpinning these phenomena (interfacial electron transfer rates, reaction mechanisms, and diffusion constants) is still missing. Electrode performance improvements reached through a systematic experimental variation of the geometric and/or operation parameters in such micro- and nanoelectrodes are limited to very few examples and to flat electrode surfaces.3,4 Fundamental studies of transport effects at three-dimensional nanoporous electrodes can only be performed at surfaces featuring ordered nanostructures of well-defined and accurately tunable geometry. Such ordered nanostructures can be made, for example, by vapor–liquid–solid (VLS) growth of nanowires,5 or by atomic layer deposition (ALD) of an appropriate template such as porous anodic alumina.6 Those vacuum-based techniques, however, require dedicated instrumentation. Alternatively, electrodeposition (galvanic plating) can be performed in a porous template to yield ordered nanowire arrays.7 This latter method presents the advantage of experimental simplicity and broad access, but is limited to short wires because when the template is removed to uncover the wires’ external surfaces, capillary forces drive their agglomeration and bending.
In this paper, we establish such a model system consisting of ordered, straight, cylindrical platinum nanotubes, the length and diameter of which can be set at the experimentalist's discretion and individually. The tubes present an inner surface to the electrolyte, which allows for subsequent electrochemical investigation inside the supporting matrix. In this manner, agglomeration of long structures is prevented. To prepare these structures, we make exclusive use of straightforward electrodeposition methods of broad availability. Further, we demonstrate how our samples can provide insight into the rate-limiting factors of electrochemical reactions by measuring the galvanic current as a function of the nanotube length for various reactions with contrasting electrode kinetics.
Preparation
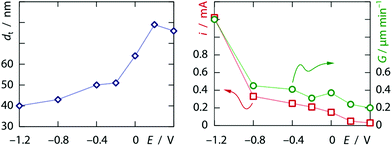
The preparation combines two major ingredients. Firstly, we use a template that provides the overall order of the tubes and defines their diameter. Secondly, we perform the galvanic plating of platinum under conditions such that it results in the coating of the pore walls and thereby the formation of tubes instead of the complete filling of the pore volume, which yields solid wires.8 The inner surface of the platinum nanotubes later serves as the electrochemically active area. The electrochemical deposition of tubes instead of wires in elongated pores can be controlled by the formation of a dihydrogen bubble at the lower pore extremity.9,10 In this case, the morphology and wall thickness depend on the concentration of metal ions, pH, and applied potential in a predictable manner.In the first step, these effects were studied with polycarbonate ‘track-etch’ filters serving as templates with 200 nm pore diameter, after an electrical contact was defined on one side by sputter-coating of a thin gold layer, followed by a short galvanic deposition of gold from a commercial electrolyte. Hexachloroplatinic acid (6.0 mM) was used in 1.0 M sulfuric acid as an electrolyte. Under these conditions, the application of a potential of +0.40 V or lower vs. a saturated Ag/AgCl/KCl reference electrode11 results in appreciable deposition of metallic Pt.12 As expected, the current increases when the potential is lowered. However, the stabilized currents obtained between +0.20 V and −0.60 V are of the same order of magnitude, whereas the Tafel equation predicts an exponential dependence I(η) of the galvanic current I on the overpotential η = |E − E0| for a single reaction. The current then increases more steeply at more negative potentials. Congruently, differences can be observed in the morphology of samples grown for 3.5 minutes, when they are investigated by scanning electron microscopy (SEM) after dissolving the polymeric matrix (examples of the overall sample morphologies are shown in the ESI†). Nanotubes are obtained at all potentials under these conditions, but their wall thickness varies. Fig. 1 summarizes the quantitative data gathered from this series of samples. Clearly, the growth rate does not scale linearly with the current density, which again points to a non-unity galvanic efficiency for platinum reduction—proton reduction becoming more prevalent at more negative potentials. This evolution is paralleled by a systematic decrease of the tube wall thickness as more negative potentials are applied. These observations are qualitatively consistent with the published model.10 Note that at the most negative potential, the tubes reach the top extremity of the pores after approximately 3.5 minutes of growth, which results in the subsequent increase of the experimental absolute current.
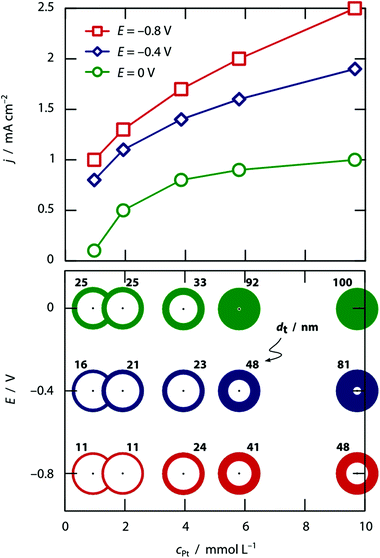
This theoretical model is further substantiated by the concentration dependence, documented at three different values of the applied potential in Fig. 2. The higher the hexachloroplatinate concentration, the thicker the wall, as one could expect given that the electroplating current should depend on the ionic concentration linearly. Note that at pH 0, the two parameters concentration and potential enable the experimentalist to tune the tube wall thickness from roughly 10% of the pore radius to 100% of it, that is, to solid wires.
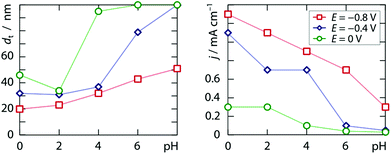
Alternatively, the morphology of the deposit can be affected by the pH. Within the range 0 ≤ pH ≤ 2.4 accessible by adding sulfuric acid to the 2.0 mM chloroplatinic acid electrolyte, we find significant variation of neither the galvanic current density nor the tube wall thickness upon pH at either −0.8 V, −0.4 V or 0.0 V. However, when potassium hydrogen phosphate (0.12 M) is acidified with hydrochloric acid, a clear trend emerges at all three applied potentials, documented in Fig. 3, which once again qualitatively follows the model put forth previously.10
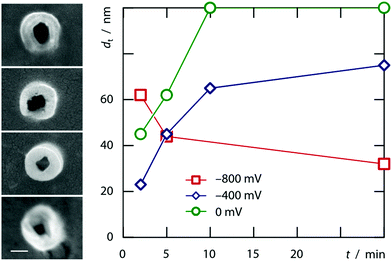
The model, however, does not account for the wall thickness variation observed when tubes obtained after various deposition times are compared with each other. Fig. 4 documents that tubes grown at very negative potentials tend to thin out whereas those grown closer to equilibrium conditions will close down to wires.
The method established in the track-etch membranes can be transferred to another, more ordered, class of porous templates, namely, porous ‘anodic’ alumina. The anodization of aluminum at +195 V in phosphoric acid results in the creation of hexagonally ordered cylindrical pores,13,14 in which Pt wires and tubes can be grown under the conditions described above. Fig. 5 shows ordered arrays of Pt nanowires obtained in this type of template. We note that beyond a length of approximately 2 μm, the wall thickness is no longer constant, in agreement with the observations presented in Fig. 4. Pores of 10 μm or more can only be filled with either solid wires or thin-walled tubes.
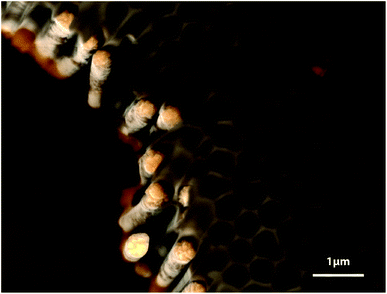 | ||
| Fig. 5 Scanning electron micrograph of Pt nanowires grown in an anodic alumina template (10 mM H2PtCl6, pH 1.5, −250 mV vs. Ag/AgCl, 30 minutes). | ||
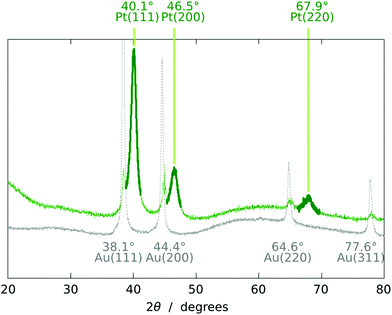
The chemical identity of the deposit is established by energy-dispersive X-ray spectroscopy and X-ray diffraction. The X-ray diffractogram (Fig. 6) displays the peaks expected of fcc Pt,15–17 in addition to those of the underlying Au contact. The amorphous alumina matrix contributes a very broad background signal.
Electrode behavior
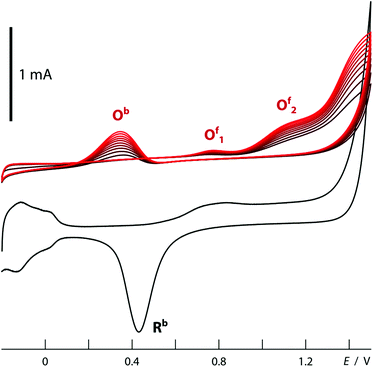
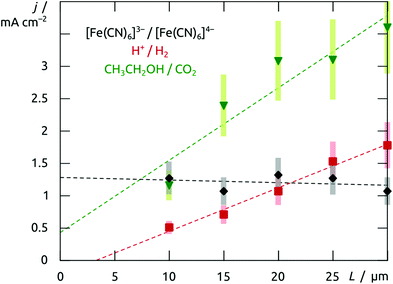
The structured material deposited here displays the electrochemical behavior expected for platinum. The cyclic voltammogram recorded in 1 M H2SO4 when an array of nanotubes is used as the working electrode (black curve in Fig. 7) is in perfect agreement with the literature precedents reported for flat platinum electrodes.18 The two reversible peaks at negative potential are due to the reductive uptake of hydrogen adatoms from the electrolyte and their oxidative loss. The poorly reversible wave near +0.5 V corresponds to the oxidative formation of surface hydroxides and oxides and their reductive loss. Finally, oxygen evolution sets on beyond +1.2 V. More interestingly, such Pt nanotube arrays can also provide a platform for the electrochemical oxidation of ethanol, found in direct ethanol fuel cells. The essentially perfect match obtained between our electrochemical curves (Fig. 7, red) and those published for flat reference samples furnishes an additional example for the electrochemical competence of our nanotubular system.19,20 In line with Goodenough's report,19 the nanostructured electrode gives rise to the cathodic peak labeled Rb in the absence of alcohol only (reduction of adsorbed Pt–OH moieties), whereas in its presence, one observes the anodic waves Of1 and Of2 (attributed to the oxidation of adsorbed formyls and carbonyls to CO2, respectively) on the anodic scan, as well as an additional, unusual anodic feature Ob on the cathodic sweep (due to the three-electron oxidation of adsorbed Pt–CO groups upon one-electron reduction of Pt–OH).This electrode system now provides a well-defined and broadly tunable platform for the investigation of transport effects in electrochemical reactions: by varying the platinum tube length, the experimentalist can change the electrode's specific surface area in direct proportion to the length of the ion diffusion paths in the solution towards the solid surface. For this purpose, electrodes can be prepared from anodic alumina membranes of various thicknesses, in which Pt nanotubes are grown until they reach the pore extremity and a continuous Pt layer develops atop the membrane. This solid metallic layer is then utilized as the electrical contact for the subsequent electrochemical measurements: the sample is flipped over and Au removed in a KI3 solution. When electrodes prepared in this way with 10 μm to 30 μm long Pt tubes (200 nm diameter, 20(±10) nm wall thickness) are poised at +0.20 V in an aqueous solution of 0.05 M potassium hexacyanoferrate(II), the galvanic current stabilizes at similar values for all of them (Fig. 8). This is in line with the well-established fast one-electron transfer reactions of the [Fe(CN)6]3−/4− redox couple. In this case, ion transport from the bulk solution to the interface is slower than electron transfer at the interface, so that the increase of interface area leads to no significant gain in galvanic throughput. The situation is different for slow multielectron transformations such as the two-electron reduction of water. Here (at −0.30 V in 0.5 M H2SO4), the current increases with the tube length in a linear manner (Fig. 8). In this case, the diffusion of protons is fast with respect to their reduction to dihydrogen at the surface. Therefore, the full surface area of the tubes participates in the electrochemistry no matter how deeply buried some of the electrodes may be. The oxidation of ethanol, a reaction of interest for fuel cells, behaves in a similar manner. This is also a slow, multielectron transformation which profits from an increased specific surface area despite the longer diffusion pathways associated with the nanopores, as is apparent in Fig. 8 (data taken in acidic ethanol solution at +1.1 V).
Conclusions
Taken together, our results establish the applicability of a nanotubular platinum/alumina system as a model with well-defined, tunable geometry for systematic investigations of electrochemical reactions. The system is prepared exclusively using simple electrochemical techniques. The electrode consists of the electrochemist's standard material platinum, but the system can be generalized to other metal compositions with tailored catalytic activity. The length of the tubes is defined by the duration of the galvanic plating procedure and/or by the thickness of the porous template, their diameter by the conditions of the aluminum anodization, and their wall thickness by the parameters of the galvanic plating. The influence of pH, hexachloroplatinate concentration and applied potential on the morphology of the deposit obtained after short deposition times are all in qualitative agreement with a published theoretical model. The limitations of the theory become apparent for longer deposition durations, where the tube wall thicknesses evolve with time.At nanotubular surfaces obtained with these methods, the electrolytic current associated with some difficult and inherently slow multielectron reactions depends on the specific surface area linearly. These results are directly applicable to various types of electrochemical devices, in particular batteries and fuel cells, in which electrodes can now be structured in a systematic manner.
Materials and methods
All solutions were prepared with water from a Millipore DirectQ system. Chemicals were purchased from VWR, Sigma Aldrich or Strem Chemicals and used without further purification. Nucleopore track-etch polycarbonate membrane filters were purchased from Whatman with a nominal pore diameter of 200 nm and thickness of 5 μm. A 70 nm thick Au layer was deposited onto one side of the membrane as an electrical contact with a Cressington sputter coater 108. Subsequently, a thicker gold layer was obtained from an Auruna 5000 electrolyte from Umicore (−2 V in a two-electrode configuration, 30 minutes). The sample was then laid with its Au-covered side onto a Cu substrate, whereas the other side was exposed to the electrolyte. The platinum electrolyte solution was prepared by dissolving H2PtCl6·6H2O and buffer or acid in various concentrations, as detailed in the text. The galvanic plating (as well as the subsequent electrochemical investigations) was performed at room temperature on potentiostats Reference 600 or G300 from Gamry. The standard three-electrode configuration was used with a platinum mesh auxiliary electrode and an aqueous Ag/AgCl/KCl(sat) reference from BASi (Bioanalytical Systems, Inc.). Various potentials were used as described in the text, all of them are reported with respect to the Ag/AgCl/KCl(sat) reference. The electrolyte was not stirred. The anodic alumina templates were prepared by the standard two-step anodization procedure (electrolysis under 195 V at 0 °C in 1 wt% H3PO4),15,16 after a preliminary electropolishing step (20 V) in a 1![[thin space (1/6-em)]](https://www.rsc.org/images/entities/char_2009.gif) :
:![[thin space (1/6-em)]](https://www.rsc.org/images/entities/char_2009.gif) 3 (v/v) mixture of conc. HClO4 and ethanol. After sputtering Au onto one side of the anodic templates, the Au contact was made thicker by a short galvanic plating in a commercial bath (Auruna from Umicore Galvanotechnik GmbH). The electrodeposition of Pt was performed in these templates with the methods described above for the polycarbonate templates.
3 (v/v) mixture of conc. HClO4 and ethanol. After sputtering Au onto one side of the anodic templates, the Au contact was made thicker by a short galvanic plating in a commercial bath (Auruna from Umicore Galvanotechnik GmbH). The electrodeposition of Pt was performed in these templates with the methods described above for the polycarbonate templates.
After electrodeposition, the samples were prepared for structural characterization. They were glued onto a copper foil using silver paste from Plano and the polycarbonate matrix was dissolved in dichloromethane. Scanning electron micrographs were taken on a Hitachi S4800 with field emission and a Jeol JSM 6400 with a LaB6 cathode. The tube wall thicknesses were determined from SEM micrographs of vertically standing nanotubes. The uncertainties mentioned in the graph captions represent the experimental error of the SEM thickness measurement and the distribution of individual values. Low-magnification micrographs documenting the structural homogeneity of the samples are presented in the ESI.† Energy-dispersive X-ray spectroscopy was acquired on the Jeol SEM with an SDD detector. X-ray diffraction data were collected on a Bruker D8 Advance using monochromatized Cu Kα radiation (1.5406 Å).
Samples to be tested as electrodes were left inside the anodic alumina matrix. The steady-state electrolytic currents of various redox reactions were measured in bulk electrolyses. The fast hexacyanoferrate(II/III) couple was tested as an aqueous 0.05 M K4Fe(CN)6 solution in 1 M KCl at +0.20 V (vs. Ag/AgCl/KCl(sat.)). The reduction of water was performed at −0.30 V in 0.5 M H2SO4. The oxidation of ethanol was investigated at +1.10 V in an aqueous solution of 0.5 M ethanol and 0.5 M H2SO4.
Acknowledgements
We thank Prof. W. Peukert (FAU Chemical Engineering) for access to XRD and S. Romeis (FAU Chemical Engineering) and S. Bochmann (FAU Inorganic Chemistry) for their support with XRD. GRR acknowledges the German Academic Exchange Service DAAD for a predoctoral fellowship. This research was supported in Hamburg by the Wissenschaftsstiftung Hamburg via the graduate schools ‘C1 Chemistry in Resource and Energy Management’ and ‘Key Technologies for Sustainable Energy Systems in Smart Grids’, and in Erlangen by the German Federal Ministry of Education and Research BMBF via the project ‘tubulAir±’ (project number 03SF0436G), and by the DFG Cluster of Excellence ‘Engineering of Advanced Materials’ in the framework of an EAM Starting Grant.References
- A. S. Arico, P. Bruce, B. Scrosati, J. M. Tarascon and W. Van Schalkwijk, Nat. Mater., 2005, 4, 366–377 CrossRef CAS PubMed.
- T. S. Zhao, C. Xu, R. Chen and W. W. Yang, Prog. Energy Combust. Sci., 2009, 35, 275–292 CrossRef CAS PubMed.
- M. P. Nagale and I. Fritsch, Anal. Chem., 1998, 70, 2908–2913 CrossRef CAS.
- C. Amatore, N. Da Mota, C. Lemmer, C. Pebay, C. Sella and L. Thouin, Anal. Chem., 2008, 80, 9483–9490 CrossRef CAS PubMed.
- B. Tian, T. J. Kempa and C. M. Lieber, Chem. Soc. Rev., 2009, 38, 16–24 RSC.
- J. Gemmer, Y. Hinrichsen, A. Abel and J. Bachmann, J. Catal., 2012, 290, 220–224 CrossRef CAS PubMed.
- C. W. Xu, H. Wang, P. K. Shen and S. P. Jiang, Adv. Mater., 2007, 19, 4256–4259 CrossRef CAS.
- The electrodeposition of platinum nanotubes has been reported, but only for one constant set of experimental parameters: X. Y. Zhang, D. H. Dong, D. Li, T. Williams, H. T. Wang and P. A. Webley, Electrochem. Commun., 2009, 11, 190–193 CrossRef CAS PubMed.
- L. Philippe, N. Kacem and J. Michler, J. Phys. Chem. C, 2007, 111, 5229–5235 CAS.
- L. Philippe and J. Michler, Small, 2008, 4, 904–907 CrossRef CAS PubMed.
- The saturated Ag/AgCl/KCl system lies at +0.197 V vs. the normal hydrogen electrode (NHE).
- E 0(PtCl42–/Pt) = 0.72 V vs. NHE or 0.52 V vs. Ag/AgCl/KCl(sat): CRC Handbook of Chemistry of Physics, ed. D. R. Lide, CRC Press, Boca Raton, 73rd edn, 1992 Search PubMed.
- H. Masuda, K. Yada and A. Osaka, Jpn. J. Appl. Phys., 1998, 37, L1340–L1342 CrossRef.
- A. P. Li, F. Müller, A. Birner, K. Nielsch and U. Gösele, J. Appl. Phys., 1998, 84, 6023–6026 CrossRef CAS.
- A. W. Hull, Phys. Rev., 1921, 17, 571–587 CrossRef CAS.
- G. Bredig and R. Allolio, Z. Phys. Chem. Neue Folge, 1927, 126, 41 CAS.
- V. M. Goldschmidt, J. Iron Steel Inst., 1947, 155, 221 Search PubMed.
- L. Bai, L. Gao and B. E. Conway, J. Chem. Soc., Faraday Trans., 1993, 89, 243–249 RSC.
- R. Mancharan and J. B. Goodenough, J. Mater. Chem., 1992, 2, 875–887 RSC.
- R. S. Amin, R. M. Abdel Hameed, K. M. El-Khatib, M. Elsayed Youssef and A. A. Elzatahry, Electrochim. Acta, 2012, 59, 499–508 CrossRef CAS PubMed.
Footnotes |
| † Electronic supplementary information (ESI) available. See DOI: 10.1039/c3dt52608a |
| ‡ Current address: University of Applied Sciences Hamburg, Berliner Tor 7, 20099 Hamburg, Germany. |
| This journal is © The Royal Society of Chemistry 2014 |

