SGP-2, an acidic polysaccharide from Sarcandra glabra, inhibits proliferation and migration of human osteosarcoma cells
Zhenzhen
Zhang†
ab,
Wei
Liu†
abc,
Ying
Zheng
ab,
Lei
Jin
ab,
Wenbing
Yao
*ab and
Xiangdong
Gao
*ab
aState Key Laboratory of Natural Medicines, PR China. E-mail: wbyao@cpu.edu.cn; xdgao@cpu.edu.cn; Fax: +86 25 83271218; Fax: +86 25 83271249; Tel: +86 25 83271218 Tel: +86 25 83271543
bSchool of Life Science and Technology, China Pharmaceutical University, Nanjing 210009, PR China
cDepartment of Food Quality and Safety, China Pharmaceutical University, Nanjing 210009, PR China
First published on 14th November 2013
Abstract
An acidic polysaccharide (SGP-2), with a molecular weight of 1880 kDa, was purified from the defatted whole-plant of Sarcandra glabra (Thunb.) Nakai. SGP-2 is mainly composed of glucose, galactose, mannose, arabinose and galacturonic acid in a molar ratio of 12.19![[thin space (1/6-em)]](https://www.rsc.org/images/entities/char_2009.gif) :
:![[thin space (1/6-em)]](https://www.rsc.org/images/entities/char_2009.gif) 8.68
8.68![[thin space (1/6-em)]](https://www.rsc.org/images/entities/char_2009.gif) :
:![[thin space (1/6-em)]](https://www.rsc.org/images/entities/char_2009.gif) 6.03
6.03![[thin space (1/6-em)]](https://www.rsc.org/images/entities/char_2009.gif) :
:![[thin space (1/6-em)]](https://www.rsc.org/images/entities/char_2009.gif) 1.00
1.00![[thin space (1/6-em)]](https://www.rsc.org/images/entities/char_2009.gif) :
:![[thin space (1/6-em)]](https://www.rsc.org/images/entities/char_2009.gif) 15.24. The primary structure analysis reveals that SGP-2 consists of 1,4-linked α-D-galacturonic acid, methyl-esterified 1,4-linked α-D-galacturonic acid, 1,5-linked α-L-arabinose, 1,4-linked α-D-mannose, 1,6-linked β-D-glucose and 1,3-linked β-D-galactose with branch chains of 1,4,6-linked β-D-glucose, 1,3,6-linked α-D-mannose and 1,4,6-linked α-D-galactose. The results of a cell viability assay and colony formation assay indicate that SGP-2 has a potent anti-proliferation activity on human osteosarcoma MG-63 cells. SGP-2 increases the proportion of apoptotic cells and activates caspase-3. In addition, the anti-proliferation effect induced by SGP-2 is blocked by the pan-caspase inhibitor. Moreover, SGP-2 inhibits the migratory capacity of MG-63 cells accompanied with the inhibition of receptor for advanced glycation end-products (RAGE) and nuclear factor-kappa B (NF-κB). Taken together, these results suggest that SGP-2 has anti-cancer potential in the treatment of human osteosarcoma.
15.24. The primary structure analysis reveals that SGP-2 consists of 1,4-linked α-D-galacturonic acid, methyl-esterified 1,4-linked α-D-galacturonic acid, 1,5-linked α-L-arabinose, 1,4-linked α-D-mannose, 1,6-linked β-D-glucose and 1,3-linked β-D-galactose with branch chains of 1,4,6-linked β-D-glucose, 1,3,6-linked α-D-mannose and 1,4,6-linked α-D-galactose. The results of a cell viability assay and colony formation assay indicate that SGP-2 has a potent anti-proliferation activity on human osteosarcoma MG-63 cells. SGP-2 increases the proportion of apoptotic cells and activates caspase-3. In addition, the anti-proliferation effect induced by SGP-2 is blocked by the pan-caspase inhibitor. Moreover, SGP-2 inhibits the migratory capacity of MG-63 cells accompanied with the inhibition of receptor for advanced glycation end-products (RAGE) and nuclear factor-kappa B (NF-κB). Taken together, these results suggest that SGP-2 has anti-cancer potential in the treatment of human osteosarcoma.
Introduction
Cancer is the leading cause of death in economically developed countries and the second leading cause of death in developing countries.1 Human osteosarcoma is the most common malignant tumor of bone with a poor response to chemotherapy or radiation treatment.2 Pulmonary metastasis is the predominant site of osteosarcoma recurrence and the most common cause of death.3 These make the management of osteosarcoma a complicated challenge. Therefore, new therapeutic targets and approaches must be sought to suppress the metastatic, invasive or cell migratory abilities as well as the proliferation of osteosarcoma.Nuclear factor kappa-B (NF-κB), a well known transcription factor, regulates a wide range of biological processes, including immunity, inflammation, proliferation and apoptosis.4 To date, there is good evidence for its role in tumor formation and the development of metastasis. For example, inhibition of NF-κB in prostate carcinoma cells suppresses both growth and development of metastatic lesions by those cells in vivo when they are injected into the prostate orthotopically.5 In the quiescent state, NF-κB is normally trapped by the inhibitor of κB (IκB) proteins in the cytoplasm. When cells are exposed to a variety of stimuli, including cytokines, ultraviolet radiation, stress, and pathogenic assaults, the IκB is phosphorylated by the active IκB kinase (IKK) complex, which is composed of two kinase subunits (IKKα and IKKβ) and a regulatory subunit (IKKγ). Phosphorylation of IκB results in its proteasomal degradation and the release of NF-κB. Subsequently, NF-κB translocates to the nucleus where it influences gene transcription by binding to specific regulatory DNA elements.6 In most cells, NF-κB activation protects cells from apoptosis, through induction of survival genes.7 NF-κB also regulates tumor development through transcriptional regulation of a wide variety of genes that encode anti-apoptotic proteins, cell cycle-related proteins, proteins involved in angiogenesis, invasion and metastasis.8 Given that inappropriate activation of NF-κB is a common feature of many human cancers, NF-κB represents an important target for cancer treatment.
Current therapies against cancer are still unsatisfactory, mainly because of their serious side effects. Therefore, attention has shifted to the discovery of new anti-cancer agents, such as the use of natural products from plants. Sarcandra glabra (Thunb.) Nakai (colloquially known as Zhongjiefeng or Caoshanhu), is a plant belonging to the family of Chloranthaceae, traditionally used as herbal tea or a food supplement in China.9 Previous studies have proved that various components of S. glabra exhibit anti-cancer activities. Isofraxidin and fumaric acid, the two major active constituents of S. glabra, have good anti-tumor effects.10 An ethyl acetate (EA) extract of S. glabra suppresses the proliferation of human leukemic HL-60 cells by up-regulating the pro-apoptotic Bax/Bcl-2 ratio associated with cell cycle arrest.11 Although some studies have been conducted to determine the anti-cancer effect of S. glabra, to our best knowledge, the studies on the anti-cancer effect of biomacromolecules (especially polysaccharides) from S. glabra are rare.
Natural polysaccharides with few side effects have been described to possess anti-cancer activities or increase the efficacy of conventional chemotherapy drugs.12 Based on these encouraging observations, a great deal of effort could be focused on discovering anti-cancer polysaccharides for the development of effective therapeutics to various human cancers. Recently, some acidic polysaccharides displaying anti-cancer activity have been reported, such as the acidic polysaccharides isolated from Angelica sinensis (Oliv.) Diels,13Gracilaria lemaneiformis14 and Panax ginseng.15 However, there are few reports on the acidic S. glabra polysaccharides and their anti-cancer activities.
Therefore, the aim of present study is to isolate and characterize the acidic polysaccharide from S. glabra and evaluate its anti-cancer effect in vitro.
Materials and methods
Materials and chemicals
The materials of S. glabra were purchased from Nanchang, Jiangxi Province, China, as reported by Jin et al.16 Dimethyl sulfoxide (DMSO), streptomycin, penicillin, standard monosaccharides, doxorubicin, 1-phenyl-3-5-pyrazolone (PMP) and 3-[4,5-dimethylthiazole-2-yl]-2,5-diphenyltetrazolium bromide (MTT) were purchased from Sigma-Aldrich (St. Louis, MO, USA). DEAE-cellulose, Sepharcyl S-400 and dextrans of different molecular weights were purchased from Pharmacia Co. Ltd. (Uppsala, Sweden). Fetal bovine serum (FBS), Minimum Essential Medium (MEM) and Roswell Park Memorial Institute-1640 (RPMI-1640) medium were purchased from Life Technologies (Carlsbad, CA, USA). N-Benzyloxycarbonyl-Val-Ala-Asp-fluoro-methylketone (Z-VAD-FMK) was purchased from Tocris Bioscience (Tocris Cookson Limited, Bristol, UK). Cleaved caspase-3, β-actin, receptor for advanced glycation end products (RAGE), NF-κB p65, phospho-I kappa B kinase α/β (p-IKKα/β), histone H3, anti-rabbit IgG (H + L) (DyLight® 680 Conjugate), anti-mouse IgG (H + L) (DyLight® 800 Conjugate) and anti-rabbit IgG, HRP-linked antibody were purchased from Cell Signaling Technology (Beverly, MA, USA). All other chemicals and reagents were analytical grade.Isolation and purification of polysaccharide
The aerial parts of S. glabra were pretreated with ethanol to deactivate the endogenous enzymes and remove some soluble materials. After pretreatment, the solid part was extracted with hot distilled water and precipitated with ethanol to obtain crude S. glabra polysaccharide (SGP) according to our previous method.16 SGP was dissolved in deionized water, centrifuged, and then loaded to a column (2.6 cm × 30 cm) of DEAE-cellulose-52 (equilibrated with deionized water). Elution was carried out with deionized water, subsequently with 1 M NaCl elution at a flow rate of 18 mL h−1. The polysaccharide obtained from the deionized water fraction was named SGP-1 as previously described.16 The major eluted fraction from the 1 M NaCl elution was further purified by gel-filtration chromatography on a column of Sepharcyl S-400. The main polysaccharide fraction was collected, lyophilized to give the polysaccharide, coded as SGP-2. The total carbohydrate content of SGP-2 was determined by the phenol-sulfuric acid method using D-glucose as the standard sample.17 The uronic acid content was determined by the meta-hydroxydiphenyl-sulfuric method using D-galacturonic acid as the standard sample.18Homogeneity and molecular weight
The homogeneity and molecular weight of SGP-2 were evaluated and determined by high performance size-exclusion chromatography (HPSEC). The sample solution was applied to Agilent 1100 High Performance Liquid Chromatography (HPLC) equipped with a Shodex SUGAR KS-805 column (8.0 mm ID × 300 mm) and a RID detector. The mobile phase was deionized water, and the flow rate was 1.0 mL min−1 at 30 °C. The molecular weight of the SGP-2 was estimated by comparison with a calibration curve prepared with dextrans standards of known molecular weight (21.4, 41.1, 84.4, 133.8, 2000 kDa, respectively). The correlation between the dextrans standard molar mass and the retention time was calculated as shown in the equation below:log![[thin space (1/6-em)]](https://www.rsc.org/images/entities/char_2009.gif) M = 10.302 − 0.6669TR, R2 = 0.9925 M = 10.302 − 0.6669TR, R2 = 0.9925 |
Monosaccharide composition determination
SGP-2 (5 mg) was completely hydrolyzed with 1 mL of 2 M trifluoroacetic acid (TFA) at 100 °C for 8 h.16 After completely removing TFA through co-distillation with methanol, the residue was dissolved in 1 mL distilled water and used for further derivatization. For the HPLC method of the precolumn derivation with PMP, the hydrolyzed samples were derived with PMP and analyzed by HPLC (ZORBAXEclips XDB-C18, 5 μm, 250 mm × 4.6 mm column) analysis with detection by absorbance monitoring at 245 nm.19 For the gas chromatography (GC) method, the hydrolyzed samples were acetylated by acetic anhydride and determined by GC with a HP-5 capillary column (HP6820, Hewlett-Packard).16 Standard monosaccharides were also derived and analyzed under the same procedure as referenced above.Total proteins and phenolic content determination
The Bradford method was adapted to determine the total protein content with a little modification of the use of bovine serum albumin (BSA) as standard.20 The phenolic content was determined according to the reported method.16 Gallic acid was used as the standard.Fourier transform infrared (FT-IR) spectroscopy
The FT-IR spectrum of SGP-2 was recorded with a Nicolet 5700 IR spectrometer with the range of 4000–400 cm−1. The sample was analyzed as KBr pellets.Nuclear magnetic resonance spectroscopy
The 1H-NMR and 13C-NMR spectra of SGP-2 were determined using a Bruker DRX-500 Spectrometer (Bruker, Rheinstetten, Germany) at 30 °C. SGP-2 was dissolved in D2O.Cell line cultures
All cells were purchased from the Cell Bank of Shanghai Institute of Biochemistry and Cell Biology, Chinese Academy of Sciences (Shanghai, China). Human non-small cell lung carcinoma NCI-H460, colon carcinoma HCT116, hepatocellular carcinoma HepG2 and normal hepatic cell L02 were maintained in RPMI-1640 medium. Human osteosarcoma MG-63 was maintained in MEM medium. All cells were supplemented with 10% FBS, 50 μg mL−1 penicillin and 50 μg mL−1 streptomycin. All cells were cultured at 37 °C in a humidified atmosphere containing 5% CO2.Cell viability assay
The cell viability was measured using a MTT assay. The cells (5 × 10⁴ cells per mL) were placed into 96-well plates and cultured for 24 h prior to treatment. The cells were treated with various concentrations of SGP-2. At the end of the treatment, 20 μL MTT solution (5 mg mL−1) was added to each well and incubated for another 4 h. The medium was removed and 150 μL DMSO was added to the wells. Then the absorbance was measured at a test wavelength of 570 nm and a reference wavelength of 650 nm using a Multiskan Spectrum Microplate Spectrophotometer (Thermo, Finland). The percentage of cell viability was calculated by the following equation:| Inhibitory rate (%) = [100 − (At/As)] × 100% |
A t and As indicated the absorbance of the test substances and solvent control, respectively.
Colony forming assay
MG-63 cells were treated with various concentrations of SGP-2 (62.5–250 nM) for 48 h. After, the cells were washed and replanted in 100 mm Petri dishes and incubated to allow colony formation for 20 days. The cells were then stained with 0.1% crystal violet solution (1 mL) for 20 min. The excess crystal violet solution was washed away with distilled water to visualize the clonogenic potential of the cells.21Migration assay
The migration assay was performed as described previously22 with some modifications. MG-63 cells were plated into a 12-well cell culture plate. The cells were allowed to grow in 10% FBS containing MEM to confluence and then were washed with a serum-free medium and were serum starved for 16 h. A 1 mm wide scratch was made across the cell layer using a sterile pipette tip. After washing with serum-free medium twice, the cells were treated with different concentrations of SGP-2 (31.25–125 nM). Plates were photographed after 6, 12, 18 and 24 h. All experiments were performed at least three times.Annexin V-FITC/PI staining assay
The detection of apoptosis was performed in 6-well plates according to the manufacturer's protocol of the Annexin V-FITC Apoptosis Detection Kit (BD, San Jose, CA, USA). Briefly, MG-63 cells in 6-well plates were incubated with various concentrations of SGP-2 (62.5–250 nM) for 24 h or 48 h. The adherent cells and supernatant in each well were collected and washed three times with ice-cold phosphate-buffered saline (PBS) solution (137 mM NaCl, 2.7 mM KCl, 4.3 mM Na2HPO4, 1.4 mM KH2PO4, pH 7.4). The cells were then resuspended in 250 μL binding buffer with 5 μL Annexin V (AV) and 5 μL propidium iodide (PI) for 15 min. Subsequently, the cells were analyzed by flow cytometry (BD FACSCanto, NJ, USA).In-cell Western assay
Cleaved caspase 3 was quantified using an in-cell western assay according to the literature procedure23 with some modifications. MG-63 cells were seeded on a 96-well plate and treated with SGP-2 at different concentrations (62.5–250 nM) for 48 h. The cells were fixed in 3.8% formaldehyde and permeabilized in 0.3% Triton X-100 prior to the blocking buffer (5% normal goat serum and 0.3% Triton X-100 in PBS solution) overnight (4–8 °C). Both cleaved caspase-3 rabbit mAb and β-actin mouse mAb (loading control antibody) were diluted in antibody dilution buffer (1% BSA and 0.3% Triton X-100 in PBS solution) and added to the wells simultaneously. After incubation with primary antibodies for 2 h, the cells were then washed and incubated with secondary antibodies (DyLight® 680 and DyLight® 800). Following further washes, the plates were quantitated using the Odyssey infrared imaging system.Western blotting assay
MG-63 cells were treated with SGP-2 at different concentrations (31.25–125 nM) for 24 h. The protein extraction of the cytosolic and nuclear fraction was achieved using a nuclei isolation kit (NanJing KeyGEN Biotechnology Co., Ltd., Nanjing, China), according to the manufacturer's protocols. Western blot analysis was performed as described previously.24 Briefly, the proteins were separated by SDS-PAGE and electrophoretically transferred onto polyvinylidene fluoride membranes (Millipore). RAGE, NF-κB p65, p-IKK α/β, β-actin and histone H3 antibodies were used as primary antibodies. HRP-conjugated goat anti-rabbit IgG were used as the secondary antibodies. Bound immuno-complexes were detected using a ChemiDOC™ XRS+ system (BioRad Laboratories, Hercules, CA).Statistical analysis
The results were expressed as the mean ± standard error (SD). The results were analyzed using One-Way ANOVA with the Tukey multiple comparison test (post test) using SPSS software (student's version). Differences of p less than 0.05 were considered significant.Results and discussion
Homogeneity, molecular weight and monosaccharide composition
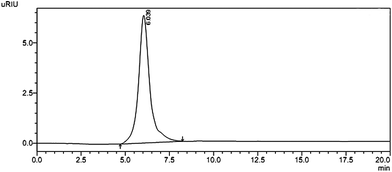
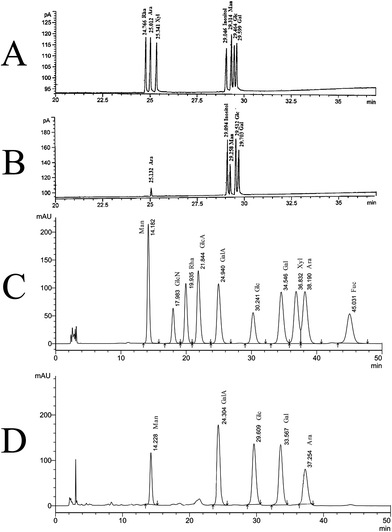
Crude polysaccharide was isolated from S. glabra and the yield was about 4.55%. After being purified through DEAE-cellulose-52, the fraction obtained from 1 M NaCl elution was subsequently purified by gel-filtration chromatography on a column of Sephacryl S-400 to get a powdery polysaccharide named SGP-2. A single and symmetrical peak obtained by HPLC indicated that SGP-2 was a homogeneous polysaccharide (Fig. 1). The average molecular weight of SGP-2 was 1880 kDa, deduced with the standard curve of dextrans standards. The total carbohydrate content of SGP-2 was 98.4%. The negative result of the Bradford test and no absorption at 280 or 260 nm in the UV spectrum demonstrated the absence of protein and nucleic acid in SGP-2. No reaction of the Folin–Ciocalteu reagent with SGP-2 indicated that SGP-2 contained no phenolics.Neutral monosaccharide composition determined by GC analysis was shown in Fig. 2A and B. SGP-2 was composed of glucose (Glc), galactose (Gal), mannose (Man), arabinose (Ara) in a molar ratio of 12.19![[thin space (1/6-em)]](https://www.rsc.org/images/entities/char_2009.gif) :
:![[thin space (1/6-em)]](https://www.rsc.org/images/entities/char_2009.gif) 8.68
8.68![[thin space (1/6-em)]](https://www.rsc.org/images/entities/char_2009.gif) :
:![[thin space (1/6-em)]](https://www.rsc.org/images/entities/char_2009.gif) 6.03
6.03![[thin space (1/6-em)]](https://www.rsc.org/images/entities/char_2009.gif) :
:![[thin space (1/6-em)]](https://www.rsc.org/images/entities/char_2009.gif) 1.00 (Fig. 2B). According to the monosaccharide composition result, as determined using PMP-HPLC, galacturonic acid (GalA) also was a major component of SGP-2 (Fig. 2D). The content of galacturonic acid was then determined to be 37.54% by photometry with meta-hydroxydiphenyl in the presence of sulfuric acid. According to the information above, SGP-2 was composed of Glc, Gal, Man, Ara and GalA in a molar ratio of 12.19
1.00 (Fig. 2B). According to the monosaccharide composition result, as determined using PMP-HPLC, galacturonic acid (GalA) also was a major component of SGP-2 (Fig. 2D). The content of galacturonic acid was then determined to be 37.54% by photometry with meta-hydroxydiphenyl in the presence of sulfuric acid. According to the information above, SGP-2 was composed of Glc, Gal, Man, Ara and GalA in a molar ratio of 12.19![[thin space (1/6-em)]](https://www.rsc.org/images/entities/char_2009.gif) :
:![[thin space (1/6-em)]](https://www.rsc.org/images/entities/char_2009.gif) 8.68
8.68![[thin space (1/6-em)]](https://www.rsc.org/images/entities/char_2009.gif) :
:![[thin space (1/6-em)]](https://www.rsc.org/images/entities/char_2009.gif) 6.03
6.03![[thin space (1/6-em)]](https://www.rsc.org/images/entities/char_2009.gif) :
:![[thin space (1/6-em)]](https://www.rsc.org/images/entities/char_2009.gif) 1.00
1.00![[thin space (1/6-em)]](https://www.rsc.org/images/entities/char_2009.gif) :
:![[thin space (1/6-em)]](https://www.rsc.org/images/entities/char_2009.gif) 15.24.
15.24.
Structure characterization of SGP-2
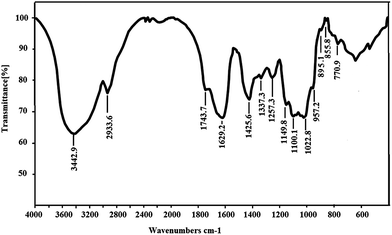
As shown in Fig. 3, the IR spectrum of SGP-2 exhibited saccharide characteristic peaks at 3600 cm−1 to 600 cm−1. In the spectrum, a broad band at around 3442 cm−1 exhibited an O–H stretch vibration and the peak at 2933 cm−1 was assigned to the C–H stretch vibration. The bands in the range of 350–600 cm−1 were assigned to skeletal modes of pyranose rings.25 The absorptions at 1000 cm−1 to 1200 cm−1 indicated the presence of C–O bonds and that the monosaccharide of SGP-2 had furanose rings.26 The absorption peaks at 1743 cm−1, 1425 cm−1 and 1257 cm−1 are the characteristic absorptions of a C![[double bond, length as m-dash]](https://www.rsc.org/images/entities/char_e001.gif) O stretching vibration, C–O stretching vibration and O–H bending, respectively, which indicated the presence of –COOH in SGP-2.27,28 These observations confirmed that SGP-2 was a polysaccharide containing uronic acid. The absorption at 855 cm−1 and 895 cm−1 indicated that SGP-2 contained both α-configuration and β-configuration sugar units.
O stretching vibration, C–O stretching vibration and O–H bending, respectively, which indicated the presence of –COOH in SGP-2.27,28 These observations confirmed that SGP-2 was a polysaccharide containing uronic acid. The absorption at 855 cm−1 and 895 cm−1 indicated that SGP-2 contained both α-configuration and β-configuration sugar units.
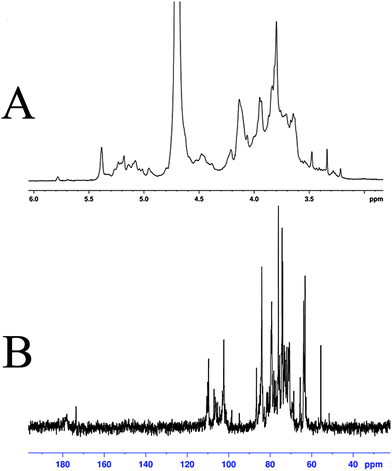
The structural features of SGP-2 were further elucidated by NMR spectral analysis (Fig. 4). Signals in the 1H and 13C-NMR spectrum of SGP-2 were assigned according to monosaccharide composition analysis and literature values.29–37 Details of the assignment are given in Table 1. Briefly, the anomeric proton signals (δ 4.2 to 5.35 ppm) of the 1H-NMR spectrum (Fig. 4A) of SGP-2 implied that sugar residues were connected by α-configuration and β-configuration glycosidic bonds. The intense signal at δ 3.80 ppm was due to the methyl groups of esterified galacturonic acid (GalpA Me). Consistently, typical signals were observed for the C-6 carboxyl group of galacturonic acid units at δ 178.0 and 173.6 ppm in 13C-NMR spectrum (Fig. 4B). The occurrence of two carboxyl signals confirmed the presence of free and esterified carboxyl groups of GalpA. The resonance peak at δ 55.5 ppm was characteristic of the methyl ester of GalpA. Signals at δ 110.1 ppm and 109.6 ppm were assigned to anomeric carbons of α-Araf residues. Signals around δ 98.5–107.0 ppm further confirmed that there were both α and β anomeric configurations of monosaccharide residues existing in SGP-2. The signals in the 13C-NMR spectrum range from δ 67 to 70 ppm confirmed the presence of (1 → 6) glycosidic linkages in SGP-2, while that of δ 80–83 ppm implied the presence of (1 → 3/4) glycosidic linkages. The NMR data, accompanied with monosaccharide composition and IR results, indicated that SGP-2 had a backbone chain mainly composed of 1,4-linked α-D-GalpA, 1,4-linked α-D-GalpA-6-OMe, 1,5-linked α-L-Araf, 1,4-linked α-D-Manp, 1,6-linked β-D-Glcp and 1,3-linked β-D-Galp with branch chains of 1,4,6-linked β-D-Glcp, 1,3,6-linked α-D-Manp and 1,4,6-linked α-D-Galp.
| Residue | Chemical shifts 13C and 1H (δ, ppm) | ||||||
|---|---|---|---|---|---|---|---|
| C-1/H-1 | C-2/H-2 | C-3/H-3 | C-4/H-4 | C-5/H-5 | C-6/H-6 | CH3O | |
| →4)-α-D-GalpA-(1→ | 101.2 | 69.5 | 70.7 | 79.3 | 73.2 | 178.0 | |
| 5.08 | 3.87 | 4.13 | 4.48 | 4.95 | |||
| →4)-α-D-GalpA-6-OMe-(1→ | 101.7 | 69.5 | 69.5 | 80.3 | 72.5 | 173.6 | 55.5 |
| 4.96 | 3.71 | 4.06 | 4.48 | 5.14 | 3.80 | ||
| α-D-Glcp-(1→ | 98.5 | 72.0 | 73.2 | 69.5 | 72.9 | 63.1 | |
| 4.96 | 3.48 | 3.64 | 3.44 | 3.84 | 3.67 | ||
| →4,6)-β-D-Glcp-(1→ | 105.3 | 72.5 | 77.8 | 79.0 | 76.7 | 72.0 | |
| 4.48 | 3.28 | 3.54 | 3.44 | 3.64 | 3.84 | ||
| →6)-β-D-Glcp-(1→ | 105.8 | 76.0 | 77.8 | 72.5 | 78.2 | 71.3 | |
| 4.48 | 3.34 | 3.54 | 3.34 | 3.54 | 3.80 | ||
| β-D-Galp-(1→ | 107.0 | 73.2 | 74.2 | 70.7 | 76.7 | 62.6 | |
| 4.48 | 3.67 | 3.64 | 3.94 | 3.71 | 3.84 | ||
| →4,6)-α-D-Galp-(1→ | 103.0 | 71.3 | 72.5 | 82.8 | 72.5 | 70.7 | |
| 5.01 | 3.87 | 3.87 | 4.21 | 4.48 | 3.76 | ||
| →3)-β-D-Galp-(1→ | 104.3 | 72.5 | 81.4 | 69.5 | 76.7 | 62.6 | |
| 4.48 | 3.76 | 3.71 | 4.14 | 3.67 | 3.84 | ||
| α-L-Araf-(1→ | 110.1 | 81.4 | 76.7 | 84.0 | 63.4 | ||
| 5.04 | 4.14 | 4.06 | 4.21 | 3.84 | |||
| →5)-α-L-Araf-(1→ | 109.6 | 81.0 | 77.2 | 82.8 | 64.8 | ||
| 5.14 | 4.14 | 3.95 | 4.06 | 3.71 | |||
| →4)-α-D-Manp-(1→ | 103.0 | 68.6 | 86.6 | 84.7 | 76.0 | 63.1 | |
| 5.23 | 4.21 | 4.06 | 3.95 | 4.13 | 3.94 | ||
| →3,6)-α-D-Manp-(1→ | 102.3 | 71.3 | 76.7 | 74.2 | 74.9 | 70.7 | |
| 5.18 | 3.95 | 4.06 | 4.14 | 3.76 | 3.87 | ||
SGP-2 inhibits the proliferation of different human cancer cells
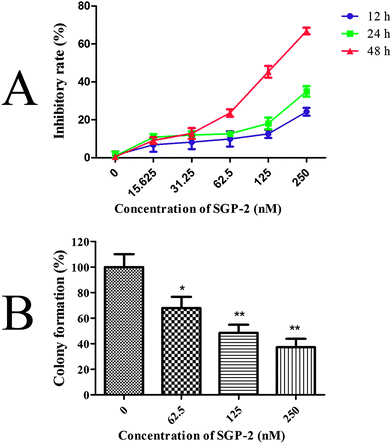
The inhibitory effects of SGP-2 on cell viability were estimated by the MTT assay. Doxorubicin served as a positive control. Our study showed that SGP-2 and doxorubicin exhibited different inhibitory effects on four human cancer cells including MG-63, NCI-H460, HCT-116 and HepG2 (Table 2). However, doxorubicin exerted significant cytotoxicity against normal human hepatic L02 cells. Notably, little inhibition effect was observed in L02 cells when treated with the maximum dissolved dose of SGP-2 (about 50![[thin space (1/6-em)]](https://www.rsc.org/images/entities/char_2009.gif) 000 nM) (Table 2). Subsequent experiments were performed on MG-63 cells in consideration of the strongest anti-proliferative activity of SGP-2 among the four testing cell lines. The results in Fig. 5A demonstrated that the inhibitory ratio increased as the concentration of SGP-2 rose. It was noted that the efficiency of inhibition was also correlated with exposure time at a given SGP-2 concentration. This correlation was obvious when the time was more than 12 h but inconspicuous with shorter times (data not shown). Specifically, the inhibitory ratios of cell viability were dramatically increased when the time of SGP-2 treatment reached 24 h and 48 h. Our results implied that SGP-2 had a concentration- and time-dependent reduction of MG-63 cell viability. The effects of SGP-2 on the relative colony formation ability of MG-63 cells (Fig. 5B) were also investigated. The results indicated that the clonogenicity of MG-63 cells was reduced in a dose-dependent manner after exposure to SGP-2 for 48 h.
000 nM) (Table 2). Subsequent experiments were performed on MG-63 cells in consideration of the strongest anti-proliferative activity of SGP-2 among the four testing cell lines. The results in Fig. 5A demonstrated that the inhibitory ratio increased as the concentration of SGP-2 rose. It was noted that the efficiency of inhibition was also correlated with exposure time at a given SGP-2 concentration. This correlation was obvious when the time was more than 12 h but inconspicuous with shorter times (data not shown). Specifically, the inhibitory ratios of cell viability were dramatically increased when the time of SGP-2 treatment reached 24 h and 48 h. Our results implied that SGP-2 had a concentration- and time-dependent reduction of MG-63 cell viability. The effects of SGP-2 on the relative colony formation ability of MG-63 cells (Fig. 5B) were also investigated. The results indicated that the clonogenicity of MG-63 cells was reduced in a dose-dependent manner after exposure to SGP-2 for 48 h.
| IC50 (nM) | Cell lines | ||||
|---|---|---|---|---|---|
| MG-63 | NCI-H460 | HCT-116 | HepG2 | L02 | |
| a Data are means ± SD, n ≥ 3. | |||||
| SGP-2 | 224.42 ± 12.98 | 402.21 ± 32.78 | 516.34 ± 37.35 | 267.95 ± 17.32 | >50![[thin space (1/6-em)]](https://www.rsc.org/images/entities/char_2009.gif) 000 000 |
| Doxorubicin | 845.41 ± 95.52 | 177.63 ± 15.23 | 1235.12 ± 12.93 | 950.31 ± 93.12 | 231.67 ± 19.34 |
SGP-2 induces apoptosis in MG-63 cells
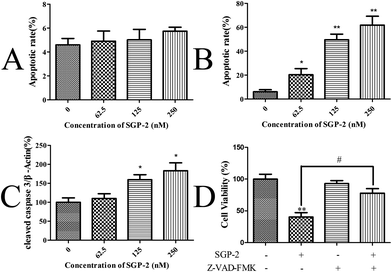
Upon apoptosis, the cell changes the structure of its plasma membrane, leading to the exposure of phosphatidylserine (PS) on the cell surface. In the presence of calcium, high-affinity binding of Annexin V to PS occurs.38 To evaluate the effect of SGP-2 on the induction of apoptosis, the cells stained with Annexin V and PI were harvested and assayed by quantitative flow cytometry analysis. Only a small portion of MG-63 cells underwent apoptosis after SGP-2 treatment, implying SGP-2 did not induce apoptosis in MG-63 cells at 24 h (Fig. 6A). However, after SGP-2 treatment for 48 h, the apoptotic rate increased from 20.38% to 61.79% following the concentration range from 62.5 to 250 nM (Fig. 6B). This result indicated that SGP-2 induced concentration-dependent apoptosis in MG-63 cells after the 48 h treatment.Caspase-3 is considered to be the most important executioner of apoptosis. Caspase-3 specifically activates the endonuclease named Caspase Activated DNAse (CAD). In proliferating cells, CAD is combined with its inhibitor ICAD (Inhibitor of Caspase Activated DNAse). In apoptotic cells, activated caspase-3 cleaves ICAD to release CAD. CAD then degrades chromosomal DNA within the nuclei and causes chromatin condensation.39 Caspase-3 also induces cytoskeletal reorganization and disintegration of the cell into apoptotic bodies. Therefore, the activation style of caspase-3 (cleaved caspase-3) was measured to justify the induction of apoptosis by SGP-2 on the protein level. A remarkable increase in the cleaved caspase-3 levels was observed in a dose-dependent manner in the MG-63 cells exposed to SGP-2 for 48 h, compared with the absence (Fig. 6C). Furthermore, we obtained evidence that the cell viability following SGP-2 treatment was rescued in the presence of the pan-caspase inhibitor Z-VAD-FMK (Fig. 6D). Taken together, these data demonstrated that the anti-proliferative effects of SGP-2 on MG-63 cells were partly due to the activation of the caspase-dependent pathway.
SGP-2 suppresses migration of MG-63 cells in vitro
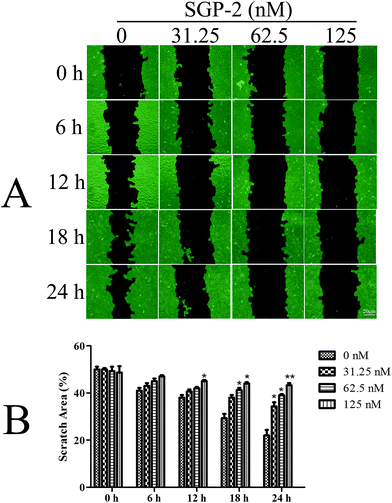
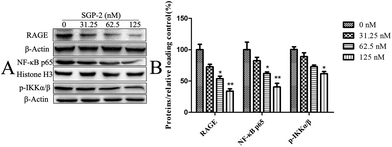
Since osteosarcoma is a highly malignant cancer with a high capacity for metastasis,3 it is very important to explore new compounds to prevent the metastasis of patients with osteosarcoma. One important characteristic of tumor metastasis is the migratory ability of tumor cells. In the current report, we evaluated the anti-migration activity of SGP-2 for the first time towards osteosarcoma MG-63 cells. According to the results of Fig. 5A, the viability of the MG-63 cells was only slightly affected within 24 h after treatment with SGP-2 at a concentration below 125 nM. So, this dose was taken in the following experiments to confirm that SGP-2 had a direct effect on the cell's capacity for the migration expected for reducing its viability. As shown in Fig. 7A, the scratch area between the cell layers after making a wound was occupied by the migrating cancer cells without SGP-2 treatment. Interestingly, the scratch area between the cell layers was seldom occupied by the migrating cells treated with SGP-2 and this effect was dose-dependent and time-dependent. As summarized in Fig. 7B, the scratch area between the cell layers was significantly greater in SGP-2-treated cells as compared to non-SGP-2-treated control cells. These data suggested that SGP-2 inhibited the migratory capacity of osteosarcoma MG-63 cells.RAGE is a member of the immunoglobulin superfamily originally identified for its ability to bind advanced glycation end products (AGE).40 Nowadays, accumulating evidence indicates that RAGE plays an important role in tumor cell migration, proliferation, and metastasis. Elevated expression levels of RAGE have been detected in a large number of tumors.41 In contrast, silence of RAGE effectively inhibits the invasion capacity of colorectal cancer cells in vitro.42 Taken together, the inhibition of RAGE expression could be an alternative way for cancer treatment. Thus, we decided to investigate the effect of SGP-2 on the expression of RAGE in MG-63 cells. As shown in Fig. 8, upon treatment with 31.25, 62.5 and 125 nM of SGP-2 for 24 h, the levels of RAGE were decreased by 27.3%, 46.3% and 66.2%, respectively. The reduction of RAGE by SGP-2 was in a dose-dependent manner. This result showed that the RAGE expression appeared to be closely associated with the depth of migration activity (Fig. 7). As determined in a previous study, the over-expression of RAGE stimulates tumor cell proliferation and migration by inducing NF-κB activation in colorectal cancer cells.43 Therefore, we examined the effect of SGP-2 on the activation of NF-κB in MG-63 cells. The results of Western blot analysis revealed that the cells with SGP-2 treatment decreased the nuclear translocation of NF-κB p65 in a dose-dependent manner (Fig. 8). Treatment with SGP-2 also resulted in the down-regulation of phosphorylation of IKKα/β (Fig. 8), an enzyme responsible for NF-κB activation.44 The inactivation of IKKα/β decreased the extent of IκB degradation and thereby inhibited the translocation of NF-κB. To sum up, the RAGE and NF-κB signaling pathways might be involved in the inhibition of cell migration mediated by SGP-2.
Conclusion
In this investigation, an acidic polysaccharide named as SGP-2, with a molecular weight of 1880 kDa, was isolated and purified from S. glabra through a DEAE-cellulose column and Sephacryl S-400 column. Structure characterization demonstrates that the backbone chain in SGP-2 is mainly composed of 1,4-linked α-D-GalpA, 1,4-linked α-D-GalpA-6-OMe, 1,5-linked α-L-Araf, 1,4-linked α-D-Manp, 1,6-linked β-D-Glcp and 1,3-linked β-D-Galp, while branch chains are composed of 1,4,6-linked β-D-Glcp, 1,3,6-linked α-D-Manp and 1,4,6-linked α-D-Galp. SGP-2 exhibits strong anti-proliferation activity on several cancer cells but not normal cells. SGP-2 also inhibits the migration of human osteosarcoma MG-63 cells.Although S. glabra is a popular folk medicine and has attracted great attention due to its anti-cancer activity, there is little information available about its polysaccharide component. This is the first report providing in vitro evidence of the anti-cancer potential of the bioactive polysaccharide of S. glabra. SGP-2 significantly inhibits the proliferation of MG-63 cells. SGP-2 increases the proportion of apoptotic cells and enhances the level of cleaved caspase-3. Moreover, the anti-proliferation effect induced by SGP-2 is rescued by the pan-caspase inhibitor Z-VAD-FMK. These results suggest that the anti-proliferation activity of SGP acts through inducing caspase-dependent apoptosis. Furthermore, SGP-2 inhibits the migratory capacity of osteosarcoma MG-63 cells accompanied with the inhibition of RAGE and NF-κB. This study provides a theoretical basis for future clinical applications of SGP-2 in cancer therapies. We may rationally assume that SGP-2 could be a potential candidate for the development of a novel functional food ingredient for cancer chemoprevention and so this biopolymer has been selected for further studies and in vivo experiments, which are already in progress.
Acknowledgements
This study was supported by the National Natural Science Foundation of China (no. 81072570), the National Scientific and Technological Major Project for Significant New Drugs Creation (no. 2012ZX09502001-004), the Training Program Foundation for the 333 High Level Talents of Jiangsu Province, the Project Program of State Key Laboratory of Natural Medicines, China Pharmaceutical University (no. JKGP201103), the Specialized Research Fund for the Doctoral Program of Higher Education of China (no. 20100096110004), Natural Science Foundation of Jiangsu Province of China (no. BK2011621), Fundamental Research Funds for the Central Universities (no. JKPZ2013014) and the Priority Academic Program Development of Jiangsu Higher Education Institutions.References
- A. Jemal, F. Bray, M. M. Center, J. Ferlay, E. Ward and D. Forman, Ca-Cancer J. Clin., 2011, 61, 69–90 CrossRef PubMed.
- N. Marina, M. Gebhardt, L. Teot and R. Gorlick, Oncologist, 2004, 9, 422–441 CrossRef PubMed.
- M. Osaki, F. Takeshita, Y. Sugimoto, N. Kosaka, Y. Yamamoto, Y. Yoshioka, E. Kobayashi, T. Yamada, A. Kawai, T. Inoue, H. Ito, M. Oshimura and T. Ochiya, Mol. Ther., 2011, 19, 1123–1130 CrossRef CAS PubMed.
- K. Campbell and N. Perkins, Regulation of NF-κB function, Biochem. Soc. Symp., 2006, 73, 165–180 CAS.
- S. Huang, C. A. Pettaway, H. Uehara, C. D. Bucana and I. J. Fidler, Oncogene, 2001, 20, 4188–4197 CrossRef CAS PubMed.
- F. Liu, Y. Xia, A. S. Parker and I. M. Verma, Immunol. Rev., 2012, 246, 239–253 CrossRef PubMed.
- J. Kucharczak, M. J. Simmons, Y. Fan and C. Gélinas, Oncogene, 2003, 22, 8961–8982 CrossRef CAS PubMed.
- S. Shishodia and B. B. Aggarwal, J. Biol. Chem., 2004, 279, 47148–47158 CrossRef CAS PubMed.
- R. R. He, X. S. Yao, H. Y. Li, Y. Dai, Y. H. Duan, Y. F. Li and H. Kurihara, Biol. Pharm. Bull., 2009, 32, 247–252 CAS.
- W. Zheng, S. Wang, X. Chen and Z. Hu, Talanta, 2003, 60, 955–960 CrossRef CAS.
- W. Y. Li, L. C. Chiu, W. S. Lam, W. Y. Wong, Y. T. Chan, Y. P. Ho, E. Y. Wong, Y. S. Wong and V. E. Ooi, Oncol. Rep., 2007, 17, 425–431 CAS.
- A. Zong, H. Cao and F. Wang, Carbohydr. Polym., 2012, 90, 1395–1410 CrossRef CAS PubMed.
- W. Cao, X.-Q. Li, X. Wang, T. Li, X. Chen, S.-B. Liu and Q.-B. Mei, Int. J. Biol. Macromol., 2010, 46, 115–122 CrossRef CAS PubMed.
- Y. Fan, W. Wang, W. Song, H. Chen, A. Teng and A. Liu, Carbohydr. Polym., 2012, 88, 1313–1318 CrossRef CAS PubMed.
- G.-Y. Kim, Y.-H. Oh and Y.-M. Park, Biochem. Biophys. Res. Commun., 2003, 309, 399–407 CrossRef CAS PubMed.
- L. Jin, X. Guan, W. Liu, X. Zhang, W. Yan, W. Yao and X. Gao, Carbohydr. Polym., 2012, 90, 524–532 CrossRef CAS PubMed.
- M. DuBois, K. A. Gilles, J. K. Hamilton, P. A. Rebers and F. Smith, Anal. Chem., 1956, 28, 350–356 CrossRef CAS.
- T. M. C. C. Filisetti-Cozzi and N. C. Carpita, Anal. Biochem., 1991, 197, 157–162 CrossRef CAS.
- S. Honda, E. Akao, S. Suzuki, M. Okuda, K. Kakehi and J. Nakamura, Anal. Biochem., 1989, 180, 351–357 CrossRef CAS.
- N. J. Kruger, Methods Mol. Biol., 1994, 32, 9–15 CAS.
- K. Shenoy, Y. Wu and S. Pervaiz, Cancer Res., 2009, 69, 1941–1950 CrossRef CAS PubMed.
- M. Vaid, R. Prasad, Q. Sun and S. K. Katiyar, PLoS One, 2011, 6, e23000 CAS.
- L. M. Howells, C. P. Neal, M. C. Brown, D. P. Berry and M. M. Manson, Biochem. Pharmacol., 2008, 75, 1774–1782 CrossRef CAS PubMed.
- C. Zhang, L. Yang, X. B. Wang, J. S. Wang, Y. D. Geng, C. S. Yang and L. Y. Kong, Cancer Lett., 2013, 340, 51–62 CrossRef CAS PubMed.
- L. Zhao, Y. Dong, G. Chen and Q. Hu, Carbohydr. Polym., 2010, 80, 783–789 CrossRef CAS PubMed.
- J. Zhu, W. Liu, J. Yu, S. Zou, J. Wang, W. Yao and X. Gao, Carbohydr. Polym., 2013, 98, 8–16 CrossRef CAS PubMed.
- J. Chen, T. Zhang, B. Jiang, W. Mu and M. Miao, Carbohydr. Polym., 2012, 87, 40–45 CrossRef CAS PubMed.
- Y. Sun, J. Tang, X. Gu and D. Li, Int. J. Biol. Macromol., 2005, 36, 283–289 CrossRef CAS PubMed.
- D. C. Silva, A. L. P. Freitas, F. C. N. Barros, K. O. A. L. Lins, A. P. N. N. Alves, N. M. N. Alencar, I. S. T. de Figueiredo, C. Pessoa, M. O. de Moraes, L. V. Costa-Lotufo, J. P. A. Feitosa, J. S. Maciel and R. C. M. de Paula, Carbohydr. Polym., 2012, 87, 139–145 CrossRef CAS PubMed.
- L. Catoire, R. Goldberg, M. Pierron, C. Morvan and C. Hervé du Penhoat, Eur. Biophys. J., 1998, 27, 127–136 CrossRef CAS.
- Y. Sun, S. W. Cui, J. Tang and X. Gu, Carbohydr. Polym., 2010, 80, 544–550 CrossRef CAS PubMed.
- Z.-w. Sun, L.-x. Zhang, B. Zhang and T.-g. Niu, Food Chem., 2010, 118, 675–680 CrossRef CAS PubMed.
- R. Yu, Y. Yin, W. Yang, W. Ma, L. Yang, X. Chen, Z. Zhang, B. Ye and L. Song, Carbohydr. Polym., 2009, 75, 166–171 CrossRef CAS PubMed.
- Q. Huang, Y. Jin, L. Zhang, P. C. K. Cheung and J. F. Kennedy, Carbohydr. Polym., 2007, 70, 324–333 CrossRef CAS PubMed.
- X. Xu, D. Ruan, Y. Jin, A. S. Shashkov, S. y. N. Senchenkova, M. Kilcoyne, A. V. Savage and L. Zhang, Carbohydr. Res., 2004, 339, 1631–1636 CrossRef CAS PubMed.
- Y. Zhang, L. Zhang, J. Yang and Z. Liang, Fitoterapia, 2010, 81, 157–161 CrossRef CAS PubMed.
- L. Zhao, Y. Wang, H.-l. Shen, X.-d. Shen, Y. Nie, Y. Wang, T. Han, M. Yin and Q.-y. Zhang, Fitoterapia, 2012, 83, 1712–1720 CrossRef CAS PubMed.
- M. van Engeland, L. J. Nieland, F. C. Ramaekers, B. Schutte and C. P. Reutelingsperger, Cytometry, 1998, 31, 1–9 CrossRef CAS.
- H. Sakahira, M. Enari and S. Nagata, Nature, 1998, 391, 96–99 CrossRef CAS PubMed.
- W. Kim, B. I. Hudson, B. Moser, J. Guo, L. L. Rong, Y. Lu, W. Qu, E. Lalla, S. Lerner and Y. Chen, Ann. N. Y. Acad. Sci., 2005, 1043, 553–561 CrossRef CAS PubMed.
- C. Gebhardt, A. Riehl, M. Durchdewald, J. Németh, G. Fürstenberger, K. Müller-Decker, A. Enk, B. Arnold, A. Bierhaus and P. P. Nawroth, J. Exp. Med., 2008, 205, 275–285 CrossRef CAS PubMed.
- H. Liang, Y. Zhong, S. Zhou and L. Peng, Cancer Lett., 2011, 313, 91–98 CrossRef CAS PubMed.
- M. K. Fuentes, S. S. Nigavekar, T. Arumugam, C. D. Logsdon, A. M. Schmidt, J. C. Park and E. H. Huang, Dis. Colon Rectum, 2007, 50, 1230–1240 CrossRef PubMed.
- R. Prasad and S. K. Katiyar, Cancer Lett., 2013, 334, 118–126 CrossRef CAS PubMed.
Footnote |
| † These two authors contributed equally to this work. |
| This journal is © The Royal Society of Chemistry 2014 |

