Depth profiling of graphite electrode in lithium ion battery using glow discharge optical emission spectroscopy with small quantities of hydrogen or oxygen addition to argon
Hikari
Takahara
*ab,
Atsushi
Kojyo
a,
Kenji
Kodama
a,
Tatsuya
Nakamura
b,
Kumi
Shono
c,
Yo
Kobayashi
c,
Masahiro
Shikano
d and
Hironori
Kobayashi
d
aRigaku Corporation, X-ray Instrument Division, 14-8 Akaoji-cho, Takatsuki, Osaka 569-1146, Japan. E-mail: hikari@rigaku.co.jp; Tel: +81-72-693-6813
bUniversity of Hyogo, 2167, Shosha, Himeji, Hyogo 671-2280, Japan
cCentral Research Institute of Electric Power Industry (CRIEPI), 2-11-1, Iwado Kita, Komae, Tokyo 201-8511, Japan
dNational Institute of Advanced Industrial Science and Technology (AIST), 1-8-31, Midorigaoka, Ikeda, Osaka 563-8577, Japan
First published on 26th September 2013
Abstract
Depth profiling and quantification using glow discharge optical emission spectroscopy (GD-OES) were applied to a graphite electrode in a lithium ion battery. To improve the measurement time and reliability beyond conventional argon discharge plasma, reactive sputtering with the respective addition of oxygen (0.50% v/v O2 in Ar) and hydrogen (1.00% v/v H2 in Ar) was investigated. Samples contained dispersed 0–5 wt% LiF or 0–0.5 wt% Li3PO4 in graphite electrodes. Adding oxygen to argon plasma increased the sputtering rate and the sensitivity in quantitative analysis of lithium drastically. That unexpected depth profile was obtained for graphite electrode samples possibly because chemical etching by oxygen was inhomogeneous. In contrast, adding hydrogen to argon plasma exhibited benefits both for depth profiling and for quantifying Li for graphite electrode samples with a shorter measurement time and higher sensitivity than that of conventional pure argon discharge. Molecular spectra showed strong C–H and C–C bands, suggesting that formation of volatile material fragments of CH and CC increased with hydrogen addition during measurements. Surface analysis results with SEM and XPS showed that redeposition of sputtered materials and Ar+ ion implantation that occurred in pure argon plasma were also suppressed.
1. Introduction
Lithium ion batteries (LIB) have been applied to portable electronics devices for the last decade. Recently, LIB application in the fields of energy vehicles and stationary energy storage systems has attracted considerable attention to enable the use of renewable energies such as solar and wind energies efficiently. As higher energy capacity and power are required along with long-term stability, safety, and lower costs, further development and studies are being conducted world-wide. To attain this goal, extensive research into battery materials, configurations, and deterioration mechanisms is being conducted. Lithium ion cell comprises a positive electrode, a negative electrode, organic liquid electrolyte with lithium-ion conductivity, and an electrically insulating polymer separator. Lithium insertion oxides such as LiCoO2, LiNiO2, and LiFePO4 are typically used as active materials for the positive electrode. Carbon-based materials such as graphite and hard carbon are representatives of active materials used in negative electrodes, although Si or Sn alloy and Li4Ti5O12 have also been considered recently for their respective benefits of higher energy capacity and safety. Lithium ion reversibly reacts in both electrodes during cell charge and discharge: during the charge process, lithium ions migrate from the positive electrode material to the negative electrode material through the electrolyte; the electrons flow through the external circuit from the positive electrode to the negative electrode. An inverse reaction occurs during the discharge process.An important subject related to LIB development is cell deterioration that occurs through long-duration use or high-temperature use. The cell can be degraded for numerous and various reasons: formation of inactive layer so-called solid electrolyte interphase (SEI),1 structural change of electrode materials, decomposition of organic liquid electrolytes, gas evolution, and so on. Especially, it is well known that SEI is concerned with the cell performance and cell deterioration in LIB. The SEI is formed in the graphite electrode during charge–discharge cycling and storage. The numerous studies on characterization of SEI with XPS, FT-IR, and NMR have reported that SEI is composed of LiF, Li2CO3, lithium alkyl carbonates ROCO2Li, and some decomposed solvents such as LixPFyOz originated from LiPF6.2,3 The SEI consumes Li ions as inactive states and fades the reversible Li ion transfer between electrodes. The formation of SEI could occur inhomogeneously in graphite electrode, so that we consider that radiofrequency glow discharge optical emission spectroscopy (rf-GD-OES)4 will be a powerful tool for in-depth and quantitative analysis of the distribution of SEI.
The positive and negative electrodes of LIB are typically formed by a 20–100 μm active layer consisting of an active material, carbon black of electric conductivity assistant, and a polymer binder on Al or Cu foil current collector. Depth profiling of positive electrodes was attempted previously using rf-GD-OES.5 The lithium composition was analyzed from the surface to the interface of the current collector completely for various states of charge (SOC) of LiNiO2-based electrode. The quantitative results agree well with inductively coupled plasma-mass spectroscopy (ICP-MS). Recent reports have also described that rf-GD-OES is applicable for the analysis of carbon-based negative electrodes.6,7 The hard carbon electrodes (30 μm active layer) were measured up to the Cu current collector. However, the measurements took a long time, 5000–8000 s, in contrast with 2000–3000 s for positive electrodes (30 μm active layer) because of a low sputtering yield of carbon (0.12 atoms per ion compared to 1.0 for Fe, at 400 eV Ar ions8). Moreover, redeposition was observed on the sputtered surface of an electrode sample, which could slow the sputtering rate further. To improve the measurement of carbon-based electrode to be faster and reliable without redeposition, the concept of plasma etching is examined in this study.
Plasma etching9 is the removal of a material (while leaving other materials) from a sample surface using the chemical selectivity of a gas etchant. This technology is important for fabricating integrated circuits in the semiconductor industry. Etch chemistry is chosen to yield a volatile product. Halogen atom etchants (F, Cl, Br) are used to remove patterned Si and poly Si. Oxygen is commonly used to remove carbon-based materials and organic polymers presented by a photoresist mask.
| C(s) + O(g) → CO(g) | (1) |
| Polymer (mostly C and H) + O(g) → CO2 (g) + H2O(g) | (2) |
In the industrial usage of GD-OES, pure Ar gas has usually been used as a discharge gas. However, other pure noble gases (He, Ne, Kr) and their binary gas mixtures (Ar–He, Kr–He, Ar–Kr, Ar–N2, …) are known to modify the sputtering rate and optical emissions. Pure Ne gas enhanced the detection of fluorine with high excitation energy.10 Gas mixtures changed the emission characteristics through collision energy transfer between the gases.11,12 The addition of activated gases such as oxygen and hydrogen in argon (0.5–10% v/v) was also widely investigated to assess discharge behaviors, sputtering rates, and emissions.13,14 When adding oxygen to argon, the electric current in glow discharge (GD) plasma decreased compared to pure argon, followed by the sputtering rate reduction of metallic materials (stainless steels and copper) and insulating materials (glass). According to a calculated model, metastable Ar (Arm), which has a large contribution to ionization processes of materials as well as an electron impact, was quenched to a considerable degree by collision with O2 molecules.15 Simultaneously, an oxidation film was formed on material surface, which reduced the sputtering rate much more strongly in the metallic materials than in insulating glass samples.16 For hydrogen addition to argon, the sputtering rate of the materials did not decrease so much irrespective of electrical current reduction because H2 related species such as ArH+ offset the decrease of Ar+ ion flux to some extent.17 Emission yields decreased in most analytical lines because of decreased Arm, but several lines such as Si I 288.1 nm, Mg I 383.3 nm, Zn I 330.2 nm, and Cu I 217.9 nm were enhanced, which is the so-called “hydrogen effect”.18
This study investigates the addition of oxygen and hydrogen to Ar discharge gas in rf-GD-OES for carbon-based electrode materials, applying their reactive effects as an oxidant or a reductant to improve the sputtering rate and reliability on the depth profiling. Graphite electrodes for LIB were measured either with 0.50% v/v O2 in Ar and 1.00% v/v H2 in Ar. Variation of the sputtering rate by the additives was evaluated. The sputtered sample surfaces were observed using scanning electron microscopy (SEM) and XPS to characterize the effects of the additives. The depth profile and quantitative ability were investigated for LiF or Li3PO4 that had been distributed intentionally in the graphite electrode samples. The GD-OES measurements were examined for the distribution analysis of SEI for deteriorated graphite electrodes in commercially available LIB.
2. Experimental
The sample electrodes were prepared with organic-based and water-based systems which are widely used in LIB.19 For the organic-based system, poly(vinylidene fluoride) (PVDF) binder was used. The 95% graphite powder (MAG-D; Hitachi Chemical) and 5% PVDF binder were mixed in N-methyl-2-pyrrolidone (NMP) solvent to prepare the slurry. For the water-based system, styrene–butadiene rubber (SBR) and carboxymethylcellulose (CMC) were used. A slurry was prepared by mixing 95% graphite, 2% carbon fiber of electronic-conductivity assistant (VGCF, Showa Denko), 2% CMC and 1% SBR in distilled water. The slurries were cast on 20 μm Cu foil, dried at 100 °C for one night, and roll-pressed to 1.0–1.4 g cm−3 and 55–90 μm for the active layer excluding Cu foil. LiF of 0–5 wt% in the active layer was dispersed in organic-based slurry, considering the chemical stabilities of LiF in organic solvents. Then 0–0.5 wt% Li3PO4 was dispersed in water-based slurry because Li3PO4 is slightly soluble in water. The electrode samples were cut into 15 mm × 15 mm pieces and were pasted onto a brazen holder for GD-OES measurement.GD-OES measurements were conducted on a spectrometer system (GDA750; Rigaku/Spectruma). High purity of argon (99.9999%) and high purity (99.9999%) of gas mixtures of 0.50% v/v O2 and 1.00% v/v H2 in argon were used as discharging gases. Radiofrequency power and pulsed glow discharge were applied under the following conditions: 550 V electric voltage, 200 Pa gas pressure, and 50% pulse rate at 2500 Hz frequency. The measurement spot was 4 mm diameter. The following elements and their emission lines were applied in this study: H 121.57 nm, Li 610.41 or 670.78 nm, C 156.14 nm, O 130.22 nm, P 177.49 nm, and Cu 327.39 nm. The emission line of fluorine was difficult to detect because of the lower sensitivity at Ar-based discharge gas.10 The crater shape variation was recorded with a stylus profilometer (Surfcom 1500DX; Tokyo Seimitsu Co. Ltd.). Then SEM imaging and XPS surface characterization were conducted for the electrode samples before and after GD-OES measurements. The SEM micrographs were taken with 15 kV accelerating voltage (JSM 5500 LV; JEOL). The XPS data were collected using an Al Kα radiation source operated at 46.95 eV and an applied power of 25 W (PHI 5000 VersaProbe; Ulvac-Phi Inc.). The energies associated with each spectrum were calibrated to the C1s (284.6 eV), which is assigned mainly to C–C of graphite in the composite electrode. Li contents included in Li3PO4 sample electrodes were ascertained using inductively coupled plasma-optical emission spectroscopy (ICP-OES, iCAP6200; Thermo Scientific).
Commercially available Al-laminated type cell samples were composed of LiM2O4-based positive electrode and graphite negative electrode.20 A cycle test for 300 or 600 cycles under 2.5–4.0 V cut-off voltages and C/2 current rate at 25 or 45 °C was operated for them. After these tests, the cells were disassembled and the negative electrode samples were rinsed with dimethyl carbonate in an argon-filled glove box. The samples were transferred to the apparatus using an experimental vessel without exposing to the air, and then measured by rf-GD-OES with the same condition as described above. The negative electrode samples retained little deintercalation capacity (<1% in all cells), which means that the stored lithium has electrochemically inactive form as SEI.
3. Results and discussion
3.1. Influences of oxygen and hydrogen addition on rf-GD-OES analysis for the carbon electrode
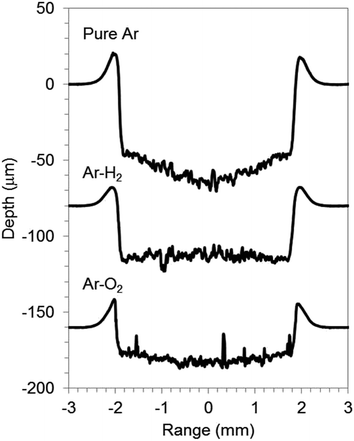
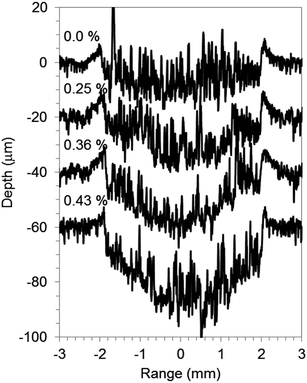
GD-OES analysis of graphite electrode was done for addition of a small amount of oxygen or hydrogen in argon discharge gas, 0.50% O2 v/v in Ar (Ar–O2) and 1.00% H2 v/v in Ar (Ar–H2). In order to understand the characteristics of the three discharge gasses, Cu foil, a typical metallic material, was chosen as a reference. Fig. 1 and 2 show the crater shapes and the SEM micrographs of crater bottoms for Cu with pure Ar, Ar–H2, and Ar–O2. The sputtering time was 1000 s for all gas species. The sputtered depths of 30 μm for Ar–H2 and 20 μm for Ar–O2 were lower than 55 μm for pure Ar, which indicates that a small amount of added oxygen and hydrogen decrease the Cu sputtering rate. The addition of gases also changes the crater shape to a flat bottom from rather concave in pure Ar. In the SEM micrograph of the surface of the crater bottom, projections resembling islands were formed for Ar–O2 (Fig. 2(c)), although it was smooth for pure Ar and Ar–H2 (Fig. 2(a) and (b)). The island-like areas were found to increase in oxygen contents (3.6–7.8 wt%) compared to the other parts (1.6–1.7 wt%) using energy-dispersive X-ray fluorescence spectroscopy (EDX) conducted by SEM, reflecting the promotion of surface oxidation for Ar–O2. These influences of oxygen and hydrogen additives found on Cu metal, reduction of the sputtering rate, change in crater shape, and formation of oxide for Ar–O2, are consistent with previous reports describing stainless steel samples.16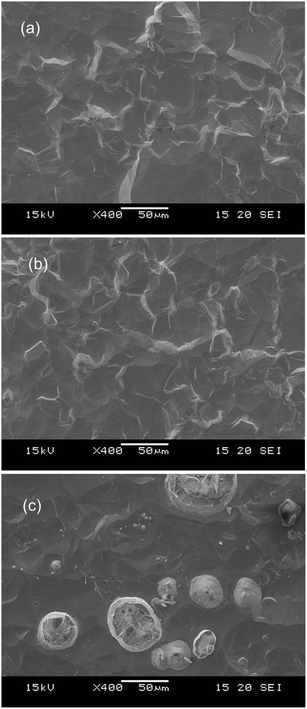 | ||
| Fig. 2 SEM micrographs of crater bottom of Cu sputtered with pure Ar (a), 1.00% v/v H2 in argon (Ar–H2) (b), and 0.50% v/v O2 in Ar (Ar–O2) (c). | ||
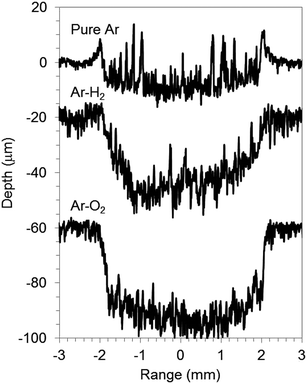
The graphite electrode samples comprised graphite particles of around 10 μm size contiguously adhered with PVDF binder on Cu foil of a current collector. The SEM micrograph of the sample surface is portrayed in Fig. 3(a). The electrode active layer was 80 μm thick; the Cu foil was 20 μm thick. Fig. 3(b), (d) and 4 respectively depict SEM micrographs and crater shapes for graphite electrode samples sputtered with pure Ar, Ar–H2, and Ar–O2. The measurement time was 3000 s for pure Ar and Ar–H2, and 1000 s for Ar–O2. The sputtered depth with pure Ar was 9 μm for 3000 s of sputtering time (Fig. 4). The sputtering rate is much lower than pure Cu (55 μm for 1000 s in the same measurement condition, in Fig. 1), because the sputtering yield of carbon (0.12 atoms per ion compared to 1.0 for Fe, at 400 eV Ar ions8) is much lower than that of Cu (1.65 atoms per ion compared to 1.0 for Fe, at 400 eV Ar ions8). Furthermore, the bottom of the crater shape was very jagged for pure Ar. The corresponding SEM micrograph reveals that redeposited materials are formed on the sputtered surface, which is probably reflected by the rough bottom of the crater (Fig. 3(b)). When using Ar–H2, the sputtered surface is smooth, indicating that the formation of redeposition is suppressed by the addition of 1% H2 (Fig. 3(c)). The sputtering rate was enhanced several times to 20 μm for 3000 s in Ar–H2 (Fig. 4). Using Ar–O2, the sputtering rate became about ten times higher than that of pure Ar (30 μm for 1000 s, Fig. 4). This drastic enhancement of the sputtering rate can result from the chemical etching effect of carbon by oxygen in Ar–O2, as described in chemical formulas (1) and (2). The SEM micrograph shows that the sputtered surface becomes rough and crisp, although redeposition did not occur (Fig. 3(d)).
 | ||
| Fig. 3 SEM micrographs of the crater bottom of graphite electrode samples before (a) and after sputtering with pure Ar (b), 1.00% v/v H2 in argon (Ar–H2) (c), and 0.50% v/v O2 in Ar (Ar–O2) (d). | ||
To investigate details of the sputtered surface, XPS measurement was performed. Fig. 5 shows XPS C 1s, F 1s, and Ar 2p spectra for the sample surface sputtered with pure Ar, Ar–H2, and Ar–O2. The electrode sample comprises graphite and PVDF, so that C, F, and H are the intrinsic elemental components. In C1s spectra (Fig. 5(a)), only a peak appeared at 284.6 eV, which is assigned to C–C bond in graphite. Peaks corresponding to C–F and C–H of PVDF (290.8 and 286.1 eV, respectively)21 were not observed clearly because of small constituents of PVDF. However, a peak originated from C–F of PVDF (687 eV)21 is apparent in F 1s spectra (Fig. 5(b)). The peak intensity is much higher in Ar–O2 than in pure Ar and Ar–H2, suggesting preferential sputtering; C would be selectively sputtered with oxygen to enhance the concentration of F on the sputtered surface in Ar–O2. In the corresponding SEM micrograph, portrayed in Fig. 3(d), the surface appears to be partly unetched and partly eroded to the inner layer. Therefore it was considered that the fluorine compound could be left on the sputtered surface if the graphite particle is removed preferentially. In Ar 2p spectra (Fig. 5(c)), a peak is found at 242 eV for pure Ar and Ar–O2. This peak is responsible for Ar+ ion implantation that occurred unintentionally on the sample surface during the GD-OES measurement. The Ar peak disappears for Ar–H2, implying that the addition of hydrogen might prevent impinging of Ar+ ions into C matrix. Argon has some reactive interaction with H+ in the argon–hydrogen plasma to form ArH+.17 This kind of interaction might remove argon from the sputtered sample surface though it is a supposition.
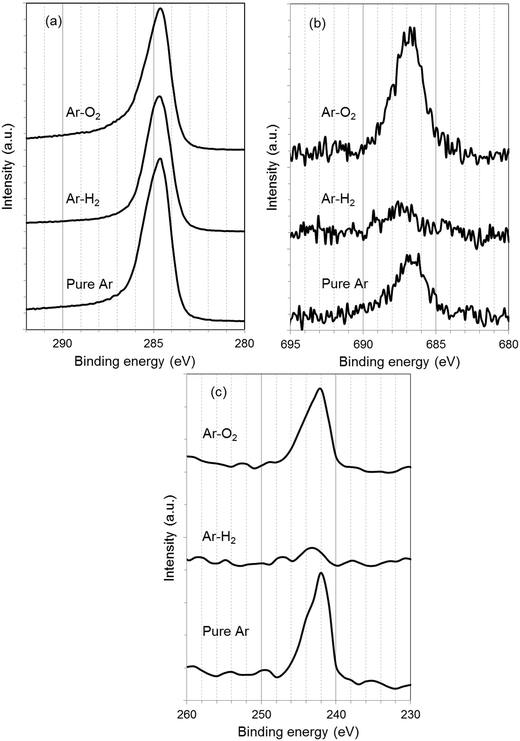 | ||
| Fig. 5 XPS spectra of C 1s (a), F 1s (b), and Ar 2p (c) for the crater bottom of graphite electrode samples sputtered with pure Ar, 1.00% v/v H2 in argon (Ar–H2), and 0.50% v/v O2 in Ar (Ar–O2). | ||
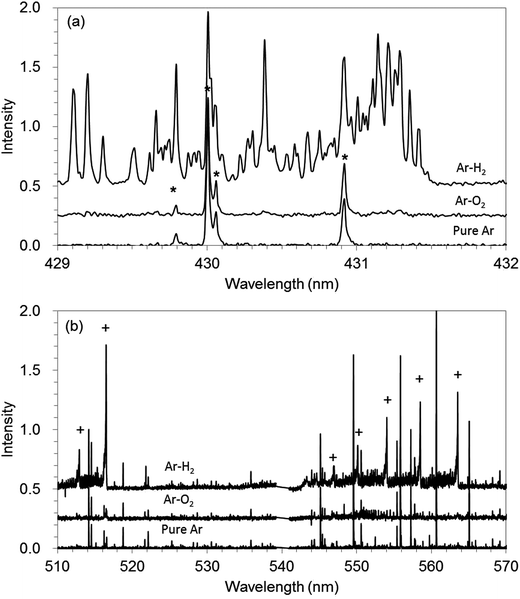
The molecular spectra can help to elucidate the effects of hydrogen addition, although the mechanism could not be explained clearly yet. Fig. 6(a) and (b) show molecular spectra of C–H and C–C, respectively, which were recorded with spectrometer equipped with a CCD detector in GD-OES measurement for pure Ar, Ar–H2, and Ar–O2. The C–H molecular band structure is observed in the range of 429–432 nm (ref. 22 and 23) (Fig. 6(a)). The strong C–H band is shown in Ar–H2. This indicates that CH radical is formed in the plasma by the reaction between carbon in the sample and hydrogen in discharge gas. Additionally, C–C band in 510–570 is also strong for Ar–H2, whereas the signals are slight for Ar and Ar–O2 (Fig. 6(b)). This indicates that CC radical is also formed in the plasma by hydrogen addition. It could be considered that CnHm type of radicals were formed first in Ar–H2, and then CC radicals involved in them possibly contributed to the optical emission. Thus hydrogen addition could be recognized as a sort of reactive sputtering for carbon-based materials and the formation of volatile material fragments such as CH and CnHm can increase the sputtering rate.
3.2. Depth profiling of carbon electrode with oxygen and hydrogen addition
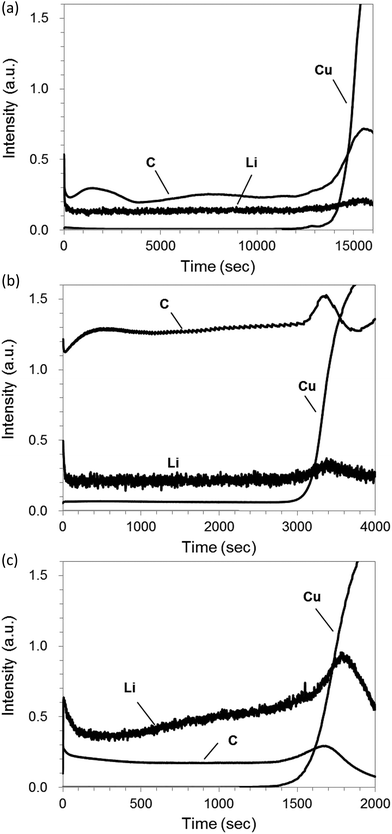
Fig. 7(a) shows rf-GD-OES depth profiles with pure Ar for a graphite electrode sample including 1% LiF (PVDF binder, 55 μm thickness of graphite layer). The rapid increase of Cu intensity indicates that sputtering penetrates the graphite layer to reach Cu foil. Consequently, it took 15![[thin space (1/6-em)]](https://www.rsc.org/images/entities/char_2009.gif) 000 s to measure the depth profile from the surface of the graphite layer to the bottom. The intensities of C increased drastically around the rapid increase of Cu because the sputtering rate of the carbon electrode layer is influenced by the presence of Cu, which has a high sputtering yield (1.6 atoms/ion at 400 eV Ar ions8).7 For Ar–H2, the sputtering time of the electrode layer was diminished to 3500 s. Moreover, the C and Li intensities increased several times, which reflects the reactive effect and the higher sputtering rate with the benefit of hydrogen addition (Fig. 7(b)).
000 s to measure the depth profile from the surface of the graphite layer to the bottom. The intensities of C increased drastically around the rapid increase of Cu because the sputtering rate of the carbon electrode layer is influenced by the presence of Cu, which has a high sputtering yield (1.6 atoms/ion at 400 eV Ar ions8).7 For Ar–H2, the sputtering time of the electrode layer was diminished to 3500 s. Moreover, the C and Li intensities increased several times, which reflects the reactive effect and the higher sputtering rate with the benefit of hydrogen addition (Fig. 7(b)).
For Ar–O2, the sputtering rate was accelerated further compared to the results in Ar–H2: sputtering to the bottom of the graphite layer took only 1500 s (Fig. 7(c)). This effect is predominantly attributable to chemical etching by oxygen, as described in chemical formulas (1) and/or (2). The C intensity for Ar–O2 did not increase, compared to pure Ar, despite its ten-times higher sputtering rate. This lack of increase can be attributed to the strong absorption of oxygen in vacuum-ultraviolet below 195 nm, although it should not be affected in Ar–H2 by the absorption band of hydrogen appeared below 110 nm.24 The lithium emission at 610 nm is hardly affected by the absorption of oxygen. Therefore, the Li intensity increases, as expected, from the enhancement of sputtering rate in Ar–O2. However, the depth profile of Li sloped toward the longer sputtering time, although it was flat for pure Ar and Ar–H2. Results show that the sputtering rate was almost constant in progress by checking the crater shape in the course of the measurement. Therefore the slope in the Li intensity profile was unlikely to be increased by the sputtering rate variation. Preferential etching of C in Ar–O2, as described in Section 3.1, might occur to become lower emission intensities of co-existing elements in the carbon matrix, especially at the initial stage of sputtering. This phenomenon seemed rather intrinsic for Ar–O2, independently of glow discharge conditions. We regard further detailed study as necessary to understand the reason for the unexpected slop of Li intensity when Ar–O2 sputtering is applied for carbon electrode samples.
3.3. Quantification ability of lithium with oxygen and hydrogen addition
Quantitative ability for Ar–H2 and Ar–O2 plasmas was evaluated with the use of carbon electrode samples varied with LiF or Li3PO4 concentration. Fig. 8 depicts Li intensities obtained from GD-OES versus Li contents. The inset was on an expanded scale to facilitate examination of a series of Li3PO4 with lower concentration range than the series of LiF. The Li content for the series of Li3PO4 samples was determined using ICP-OES to confirm the correlation between GD-OES and ICP-OES, whereas that for LiF was the amount added in the preparation. A linear relation between Li intensity and Li content was obtained for all of pure Ar, Ar–H2 and Ar–O2. The intensity of Li for a series of Li3PO4 samples seemed to be larger than that expanded from the calibration curves for LiF, which might be responsible for sample characteristic dependence. Sputtering of the carbon-based samples is likely to proceed reactively with oxygen of a constituent of Li3PO4, even for pure Ar. Fig. 9 presents crater shapes for 0–0.4 wt% Li3PO4 including carbon electrodes. The sputtering rate increased concomitantly with increasing Li3PO4 amount in carbon matrix samples. The crater shape was also changed to concave, whereas it was mostly unchanged over the whole concentration range (0–2 wt%) in the LiF samples. It was reported previously that the effect of hydrogen addition is similar when hydrogen is induced in gaseous form and when it is sputtered from the sample.13,25 The same phenomenon would occur if oxygen was added to the discharge gas of argon.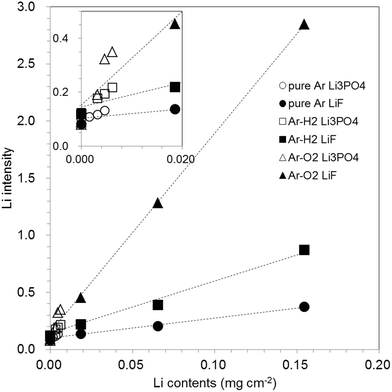 | ||
| Fig. 8 Relation between GD-OES Li intensity and Li contents in graphite samples with pure Ar, 1.00% v/v H2 in Ar (Ar–H2), and 0.50% v/v O2 in Ar (Ar–O2). | ||
Even including the error found between Li3PO4 and LiF on the correlation curves, the correlation coefficient r2 for Ar–H2 and Ar–O2 (0.98 and 0.995, respectively, in the Li concentration range of 0.0–1.4 wt%) was equivalent to that of pure Ar (0.98), which suggests that both Ar–H2 and Ar–O2 are acceptable for quantitative analysis of carbon-based materials. Moreover, the correlation curve slopes were 2.5 and 10 times larger than those of pure Ar, respectively, for Ar–H2 and Ar–O2, from the benefit of the faster sputtering rate, which promises advantages for sensitivity in quantitative analysis.
Table 1 presents a summary of the characteristics in GD-OES analysis of graphite electrode samples with pure Ar, Ar–H2 and Ar–O2. The Ar–H2 discharge shows benefits for quantifying lithium in graphite electrode samples with shorter measurement time and higher sensitivity than that of conventional pure Ar discharge. The Ar–O2 enabled ten-times higher sensitivity and good correlation in quantification within a shorter measurement time, although it possibly brought about a different depth profile for the samples.
| Sputtering rate | Relative sensitivity of Li | Correlation coefficient r2 of Li | Depth profile of Li | Surface analysis by SEM/XPS | Note | |
|---|---|---|---|---|---|---|
| Pure Ar | 15![[thin space (1/6-em)]](https://www.rsc.org/images/entities/char_2009.gif) 000 s/55 μm 000 s/55 μm |
1.0 | 0.98 | Flat | Redeposition/Ar immersion | |
| Ar–H2 | 3500 s/55 μm | 2.7 | 0.98 | Flat | Smooth/Less Ar immersion | Absorption below 110 nm |
| Ar–O2 | 1500 s/55 μm | 10 | 0.995 | Sloping | Rough and crisp/Rich F | Absorption below 195 nm |
3.4. Depth profiling of degraded LIB electrodes
GD-OES measurements with Ar–H2 and Ar–O2 were practically applied to degraded graphite electrodes in commercially available LIB.20Table 2 summarizes the test conditions and obtained cell capacity. The sample named [New] was as-prepared one before deterioration. The other samples were tested by charge–discharge cycles under the various conditions. The capacity retention means the relative cell capacity after the cycle test with [New]; the smaller value indicates the higher deterioration degree. Fig. 10(a) shows a depth profile of a graphite electrode sample for [New] with use of Ar–H2. The profile was quantified with the calibration curve shown in Fig. 8. The sputtering time of the electrode layer was shortened to about 3500 s for 50–60 μm thickness, compared with more than 10![[thin space (1/6-em)]](https://www.rsc.org/images/entities/char_2009.gif) 000 s in the case of conventional pure Ar. The electrode mainly consisted of C and included a small amount of Li which could be attributed to a SEI component. The Li concentration was almost constant except for the surface region (0–10 μm). The surface concentration of Li could be high because SEI is likely deposited on the electrode surface.26Fig. 10(b) portrays Li profiles for all electrode samples. The Li concentration increased with deterioration degree of the samples. The Li profile became more inhomogeneous with degradation. This suggested that SEI growth varied with depth for the cell degradation.
000 s in the case of conventional pure Ar. The electrode mainly consisted of C and included a small amount of Li which could be attributed to a SEI component. The Li concentration was almost constant except for the surface region (0–10 μm). The surface concentration of Li could be high because SEI is likely deposited on the electrode surface.26Fig. 10(b) portrays Li profiles for all electrode samples. The Li concentration increased with deterioration degree of the samples. The Li profile became more inhomogeneous with degradation. This suggested that SEI growth varied with depth for the cell degradation.
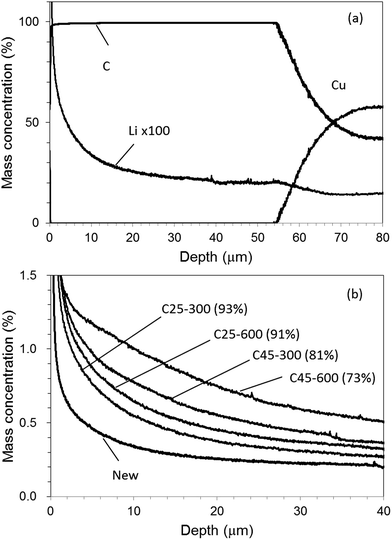 | ||
| Fig. 10 Depth profile for [New] electrode (a) and Li profiles for all electrode samples (b) with 1.00% v/v H2 in argon (Ar–H2). | ||
| Temperature (°C) | Cycle | Capacity (Ah) | Capacity retention (%) | |
|---|---|---|---|---|
| [NEW] | — | — | 5.20 | 100 |
| [C25-300] | 25 | 300 | 4.82 | 93 |
| [C25-600] | 25 | 600 | 4.73 | 91 |
| [C45-300] | 45 | 300 | 4.23 | 81 |
| [C45-600] | 45 | 600 | 3.79 | 73 |
Fig. 11(a) and (b) show a depth profile of a graphite electrode sample for [New] and Li profiles for all electrode samples in the case of Ar–O2, respectively. It took only 700 s for sputtering the electrode layer. The Li concentration gradually declined throughout the entire depth even for [New] samples. For the deteriorated samples, the profiles did not monotonously decrease and had a local increase in the outer layer (0–10 μm). Monotonous decrease indicated in Ar–H2 (Fig. 10(b)) seemed more reasonable considering the electrochemical reaction in the cell. The local increase in the outer layer was emphasized for the deteriorated samples (Fig. 11(b)). This could reflect their unstable intensity profiles, which were varied sensitively, probably depending on the sample component and/or condition due to the preferential sputtering. Fig. 12 plots the averaged Li concentrations for all samples obtained with Ar–H2 and Ar–O2 to those determined by ICP-OES. A linear relationship with the correlation coefficient r2 = 0.95 was obtained for Ar–O2. This suggested that quantitative analysis was possible in Ar–O2, whereas the depth profiles might be ambiguous. The Ar–H2 result showed a better linear relationship with the correlation coefficient r2 = 0.995. Therefore we considered that Ar–H2 was prominent in both respects of depth profiling and quantitative analysis for carbon electrodes in LIB.
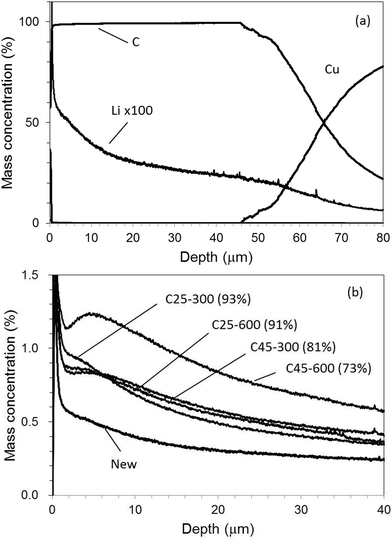 | ||
| Fig. 11 Depth profile for [New] electrode (a) and Li profiles for all electrode samples (b) with 0.50% v/v O2 in Ar (Ar–O2). | ||
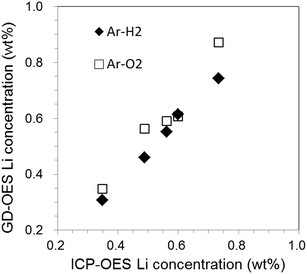 | ||
| Fig. 12 Relationship of Li concentrations obtained by GD-OES with Ar–H2 and Ar–O2 to those determined by ICP-OES. | ||
4. Conclusion
Rf-GD-OES with small addition of oxygen (0.50% v/v O2 in Ar) and hydrogen (1.00% v/v H2 in Ar) was applied and characterized for a graphite electrode in LIB. For oxygen addition, the sputtering rate was enhanced drastically: ten-fold compared to conventional pure argon discharge. This outcome is attributed to chemical etching effects of oxygen in argon plasma. The depth profile of lithium dispersed in a graphite electrode sample differed from that with pure Ar. Surface analysis results obtained using SEM and XPS suggest that the etching reaction progresses inhomogeneously to the inner layer. For adding hydrogen to argon plasma, shorter measurement time and higher sensitivity were brought about compared to those for pure argon, which indicated benefits for both depth profiling and for quantifying Li for graphite electrode samples. Molecular spectra with a CCD spectrometer showed strong C–H and C–C bands, suggesting that the formation of volatile material fragments of CH and CC increased sputtering rate. Surface analysis results indicate that redeposition and Ar+ ion implantation were suppressed, which can also enhance the sputtering rate and reliability of depth profiling. For practical applications of LIB graphite electrodes, we recommend Ar–H2 plasma which could give shorter measurement time and more reliable depth-profile.Acknowledgements
We are grateful to Dr Hikari Sakaebe and Dr Hikaru Sano (AIST) for their technical help and comments on LIB. We also thank Professor Kazuaki Wagatsuma (Tohoku University) for his helpful discussion and comments related to GD-OES analysis. We thank Noboru Yamashita (Rigaku), Michael Analytis and Rudiger Meihsner (Spectruma Analytik GmbH) for their technical support related to GD-OES measurements.References
- D. Aurbach, E. Zinigrad, Y. Cohen and H. Teller, Solid State Ionics, 2002, 148, 405 CrossRef CAS.
- D. Aurbach, B. Markovsky, I. Weissman, E. Levi and Y. Ein-Eli, Electrochim. Acta, 1999, 45, 67 CrossRef CAS.
- B. M. Meyer, N. Leifer, S. Sakamoto, S. G. Greenbaum and C. P. Grey, Electrochem. Solid-State Lett., 2005, 8, A145 CrossRef CAS PubMed.
- M. Winchester and R. Payling, Spectrochim. Acta, Part B, 2004, 59, 607 CrossRef PubMed.
- Y. Saito and M. K. Rahman, J. Power Sources, 2007, 174, 877 CrossRef CAS PubMed.
- H. Takahara, M. Shikano and H. Kobayashi, J. Power Sources, 2013, 244, 252 CrossRef CAS PubMed.
- H. Takahara, H. Miyauchi, M. Tabuchi and T. Nakamura, J. Electrochem. Soc., 2013, 160, A272 CrossRef CAS PubMed.
- D. Fang and R. K. Marcus, Glow Discharge Spectroscopies, ed. R. K. Marcus, Plenum Press, New York, 1993, pp. 30–31 Search PubMed.
- M. A. Lieberman and A. J. Lichtenberg, Principle of Plasma Discharge and Materials Proceeding, John Wiley & Sons, Inc., Hoboken, New Jersey, 2005, pp. 571–579 Search PubMed.
- K. Wagatsuma, K. Hirokawa and N. Yamashita, Anal. Chim. Acta, 1996, 324, 147 CrossRef CAS.
- K. Wagatsuma and K. Hirokawa, Spectrochim. Acta, Part B, 1987, 42, 523 CrossRef.
- K. Wagatsuma and K. Hirokawa, Anal. Chem., 1989, 61, 326 CrossRef CAS.
- A. Martine, A. Menendez, R. Pereiro, N. Bordel and A. Sanz-Medel, Anal. Bioanal. Chem., 2007, 388, 1573 CrossRef PubMed.
- E. B. M. Steers, P. Smid, V. Hoffman and Z. Weiss, J. Phys.: Conf. Ser., 2008, 133, 012020 CrossRef.
- A. Bogaerts, Spectrochim. Acta, Part B, 2009, 64, 1266 CrossRef PubMed.
- B. Fernandez, N. Bordel, R. Pereiro and A. Sanz-Medel, J. Anal. At. Spectrom., 2003, 18, 156 RSC.
- A. Bogaerts, J. Anal. At. Spectrom., 2008, 23, 1476 RSC.
- V. D. Hodoroaba, E. B. M. Streers, V. Hoffmann, W. E. S. Unger, W. Paatsch and K. Wetzig, J. Anal. At. Spectrom., 2003, 18, 521 RSC.
- C. C. Li and Y. W. Wang, J. Electrochem. Soc., 2011, 158, A1361 CrossRef CAS PubMed.
- Y. Kobayashi, T. Kobayashi, K. Shono, Y. Ohno, Y. Mita and H. Miyashiro, J. Electrochem. Soc., 2013, 160, A1181 CrossRef CAS PubMed.
- A. M. Andersson, D. P. Abraham, R. Haasch, S. MacLaren, J. Liu and K. Amine, J. Electrochem. Soc., 2002, 149, A1358 CrossRef CAS PubMed.
- A. Bengtson, J. Anal. At. Spectrom., 2003, 18, 1066 RSC.
- R. W. B. Pearse and A. G. Gaydon, The Identification of Molecular Spectra, Chapman and Hall, London, 1976 Search PubMed.
- G. Herzberg, Molecular Spectra and Molecular Structure I: Spectra of Diatomic Molecules, Krieger, Malabar, Florida, 2nd edn, 1989 Search PubMed.
- A. Bengston and S. Hanstrom, Steel Met. Ind., 1998, 47 Search PubMed.
- M. Winter, K.-C. Moeller and J. O. Besenhard, Lithium Batteries Science and Technology, ed. G. Nazri and G. Pistoia, Springer, New York 2009, pp. 171–179 Search PubMed.
| This journal is © The Royal Society of Chemistry 2014 |

