Paper-based microfluidics with an erodible polymeric bridge giving controlled release and timed flow shutoff†
Sana
Jahanshahi-Anbuhi
a,
Aleah
Henry
a,
Vincent
Leung
a,
Clémence
Sicard
b,
Kevin
Pennings
a,
Robert
Pelton
a,
John D.
Brennan
*b and
Carlos D. M.
Filipe
*a
aDepartment of Chemical Engineering, McMaster University, 1280 Main Street West, Hamilton, ON L8S 4M1, Canada. E-mail: filipec@mcmaster.ca; Fax: +1 905 521 1350; Tel: +1 905 525 9140 (ext. 27278)
bDepartment of Chemistry & Chemical Biology, McMaster University, 1280 Main Street West, Hamilton, ON L8S 4M1, Canada. E-mail: brennanj@mcmaster.ca; Tel: +1 905 525 9140 (ext. 20682)
First published on 4th October 2013
Abstract
Water soluble pullulan films were formatted into paper-based microfluidic devices, serving as a controlled time shutoff valve. The utility of the valve was demonstrated by a one-step, fully automatic implementation of a complex pesticide assay requiring timed, sequential exposure of an immobilized enzyme layer to separate liquid streams. Pullulan film dissolution and the capillary wicking of aqueous solutions through the device were measured and modeled providing valve design criteria. The films dissolve mainly by surface erosion, meaning the film thickness mainly controls the shutoff time. This method can also provide time-dependent sequential release of reagents without compromising the simplicity and low cost of paper-based devices.
Introduction
The recent literature describes many paper-based microfluidic devices for point-of-care diagnostics,1,2 food safety3,4 and water quality monitoring.5,6 The most compelling examples function without instrumental or electronic support – ideal for emergency and resource limited situations.7 Like the classic glucose sensor8 and some current home pregnancy test kits, many tests involve simple lateral-flow assays that include sequential reactions. However, potentially interesting paper-based assays, such as ELISA assays,9 involve more complex sequences that are not easily implemented as one-step dip and read operations on paper. For example, we recently described a sensitive pesticide sensor that functions by exposing an immobilized enzyme, acetylcholinesterase (AChE), to the test solution for a fixed time. In a second step, the immobilized enzyme is treated with indophenyl acetate solution, a color producing substrate for the enzyme.3 Pesticides present in the test sample bind to and deactivate AChE, preventing color generation.The first prototype of our pesticide sensor was clumsy, labour intensive and required some user skill. The paper sensor strip was first exposed to the test liquid for a fixed time, after which it was dried. In the second step, lateral flow was used to carry the substrate3 to the enzyme layer. In this assay, enzyme deactivation by pesticides in the test liquid and the subsequent generation of color (or lack of it) are time dependent, requiring careful control. On the other hand, the ideal implementation of the pesticide sensor would simply involve dipping one end of a paper strip in the test liquid. After a fixed time the user would then read the color output either qualitatively or possibly more accurately with a scanner or cell phone camera.
Two innovations were required to achieve a more useful format for our pesticide sensor. First we needed a way to sequentially bring two separate liquid streams to the enzyme test zone on the paper sensor. For this, two separate channels were employed – a fast channel that brings test liquid to the enzyme zone first, followed by a slow channel that carried the color producing substrate to the enzyme after a set incubation time.
The second innovation required, and the subject of this paper, was a shutoff valve that stopped the fast channel flow after a fixed time, giving the enzyme zone a chance to dry and accept substrate solution from the slow channel. The fast channel design was described previously and consists of a paper channel sandwiched between hydrophilic films.10 The shutoff valve was a flap valve that needed to be manually actuated. However, this required that a user intervene in the assay at an appropriate time, making the assay less user-friendly and more prone to human error.
Several valve types have been proposed for paper-based microfluidics. Chen et al.11 described a non-return valve (fluidic diode valve), created by strategically patterning hydrophilic regions with and without surfactants, and separating these regions with hydrophobic areas. Fluid flow occurs only from the region containing surfactant (the anode) to the region not containing surfactant. The effect of the surfactant on the surface tension is the driving force directing the flow. This design is capable of forming complex circuits within paper, but it does not function as a shutoff valve. Li et al.12 described a magnetic timing valve using a resistor and an electromagnet that triggers a cantilever valve. However, the incorporation of a resistor and an electromagnet increases the complexity of the device. A number of authors have described timed-opening valves based on filling the paper pores with hydrophobic material13,14,17 such as paraffin wax or with a water-soluble barrier15,16 such as sucrose or trehalose, to provide additional resistance to flow. These temporary barriers delay fluid movement through the channel and allow the user to control the flow rate of the fluid. The flow rate is determined mainly by the barrier thickness, and increasing this factor leads to a reduction in flow rate. While this method of flow control works well for delaying flow, it is insufficient for cases in which different fluids must be delivered to the same space sequentially, as the first sample will not dry and consequently blocks the next fluid from entering the space. Yager and coworkers16 recently reported a barrier composed of sucrose which delays the flow through a paper channel. The timing of the delay is tuneable based on the amount of sucrose that is added. This flow control method allows for sequential reactions, however, the essential flow shut-off system is only provided by a limited sample supply (via source pads). While this is a viable method of metering, it requires more materials to construct each sensor and also increases the possibility of user error, such as an incompletely wetted source pad. A fluid disconnect is yet another type of valve based on the shape of the paper channels. The paper is shaped to have pathways/legs that are sequentially removed from the fluid to stop flow in that channel. These channels allow for multi-step processes, but require specific loading capabilities and cannot be used without a full well of sample.17,18 Although automated sequential delivery has been demonstrated in non-paper-based microfluidic devices,19 we have found very few examples of flow shutoff valves in paper-based devices that do not require electrical power or human intervention.20,21
The essence of our shutoff valve is a pullulan film that dissolves as water flows past it. Pullulan is also the supporting film material used for commercial breath freshening strips; the good film forming properties and rapid dissolution characteristics required for breath strips are also ideal for microfluidic shutoff valves. Pullulan is produced from the fungus Aureobasidium pullulans, and is a non-ionic polysaccharide comprised of three linked maltose residues.22 The molecular weight of pullulan can be as high as 106–107 Da.23 Pullulan is non-hygroscopic, thermally stable and biodegradable.22 In addition, pullulan has good oxygen barrier properties, providing a good encapsulation environment for oxygen sensitive reagents.
The following sections present experiments and models leading to design rules for the pullulan shutoff valves. Finally, we successfully demonstrate the use of the valve to fully automate a previously reported paper-based organophosphate pesticide sensor.3,10
Experimental section
Materials
Pullulan (MW ~100![[thin space (1/6-em)]](https://www.rsc.org/images/entities/char_2009.gif) 000) was obtained from Sigma-Aldrich (Oakville, ON, Canada), citric acid was obtained from Caledon Laboratories Ltd. (Georgetown, ON, Canada), methoxy PEG 350 was obtained from Union Carbide Chemicals and Plastics Company (Danbury, CT, USA), ethyl alcohol (95%) was obtained from Commercial Alcohols (Brampton, ON, Canada), Brilliant Blue dye, Allura Red, Tartrazine and Methyl Orange were obtained from Sigma-Aldrich (Oakville, ON, Canada). Whatman #1 filter paper was used for all assays. Distilled deionized water with a resistance of 18.2 mΩ cm and <5 ppm total organic content was used in all assays. PET films (polyester film, 0.004′′ thick, clear, part # 8567k44) were purchased from McMaster-CARR (Hamilton, ON, Canada). Clear Tape (premium packaging tape, 48 mm × 50 m, #99842) was purchased from GRAND & TOY. The wax printer used was a Xerox Phaser 8560. Acetylcholinesterase (AChE, from Electrophorus electricus, EC 3.1.1.7), indoxyl acetate (IDA), malathion, tris(hydroxymethyl)aminomethane, methanol (LC/MS grade), and Dowex 50WX8 cation exchange resin were obtained from Sigma-Aldrich. Sodium silicate solution was purchased from Fisher Scientific. Poly(vinylamine) (45 kDa) was obtained as a gift from BASF.
000) was obtained from Sigma-Aldrich (Oakville, ON, Canada), citric acid was obtained from Caledon Laboratories Ltd. (Georgetown, ON, Canada), methoxy PEG 350 was obtained from Union Carbide Chemicals and Plastics Company (Danbury, CT, USA), ethyl alcohol (95%) was obtained from Commercial Alcohols (Brampton, ON, Canada), Brilliant Blue dye, Allura Red, Tartrazine and Methyl Orange were obtained from Sigma-Aldrich (Oakville, ON, Canada). Whatman #1 filter paper was used for all assays. Distilled deionized water with a resistance of 18.2 mΩ cm and <5 ppm total organic content was used in all assays. PET films (polyester film, 0.004′′ thick, clear, part # 8567k44) were purchased from McMaster-CARR (Hamilton, ON, Canada). Clear Tape (premium packaging tape, 48 mm × 50 m, #99842) was purchased from GRAND & TOY. The wax printer used was a Xerox Phaser 8560. Acetylcholinesterase (AChE, from Electrophorus electricus, EC 3.1.1.7), indoxyl acetate (IDA), malathion, tris(hydroxymethyl)aminomethane, methanol (LC/MS grade), and Dowex 50WX8 cation exchange resin were obtained from Sigma-Aldrich. Sodium silicate solution was purchased from Fisher Scientific. Poly(vinylamine) (45 kDa) was obtained as a gift from BASF.
Solution preparation
500 mg of pullulan was dissolved in 10 mL of distilled water using a magnetic stirrer. Once fully dissolved, 120 mg of citric acid, 0.328 mL of methoxy PEG 350, and 0.15 mL of ethyl alcohol were added to the solution.24 The solution was mixed until all components were dissolved. Films were created through a casting method. The solution was poured into a 3.5 cm diameter Falcon petri dish, and allowed to air dry for 24–48 hours. Different amounts of the pullulan solution, ranging from 1 mL to 7 mL, were cast into petri dishes to create different thicknesses in the resultant films.Shutoff system assembly
Fig. 1 depicts the steps for assembling a shutoff system. A 2 mm × 10 mm gap was cut in a 7.5 mm channel, ensuring that the gap width exceeded that of the channel. Following this, a strip of hydrophilic flexible film (can be: a PET transparency slide, or the non-sticky side of normal clear tape, etc.) was cut to the channel width or slightly wider. This was taped to one side of the channel so that the hydrophobic area and gap were completely covered by the flexible film. The entire device was then flipped over, and glue was applied on the section of the gap between the edge of the device and the hydrophobic channel as shown in Fig. 1. The pullulan film was then cut to an appropriate size, slightly larger than the gap,‡ and placed over the gap. It was then pressed down to secure it to the paper channel.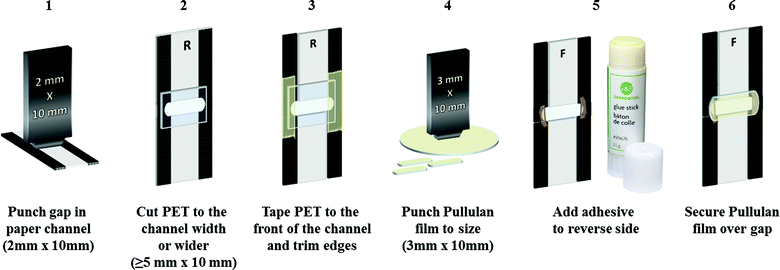 | ||
| Fig. 1 Schematic of the flow shutoff system assembly. Letters “F” and “R” refer to front and rear side of the device, respectively. | ||
For ease of cutting, two similarly shaped hole-punchers were made. The smaller hole-punch (~2 mm × 10 mm) was used for cutting the gap in the paper channel, and the larger hole-punch (~3 mm × 10 mm) was used to punch the pullulan films. The main advantage of the hole-punch is its ability to create reproducible and uniform samples. The construction process for the pullulan bridge device demonstrated here is performed at the lab scale. However, the process can be scaled up to produce greater quantities of the device (see the ESI† for a proposed scale-up process).
Dynamic viscosity measurement
The dynamic viscosity of the pullulan solutions was measured using a Fisherbrand uncalibrated glass Ubbelohde tube (#50). The experiments were conducted at 23 °C. 10 mL of water was added to the Ubbelohde tube and the time taken for the water to pass through the tube was recorded. This was used to determine the viscometer constant. Different concentrations of pullulan solutions: 41.6 g L−1, 20.8 g L−1, 8.3 g L−1, and 4.2 g L−1, were added to the Ubbelohde tube and the times for the solutions to pass through the tube were recorded and the viscosities were calculated.Pesticide sensor construction
The sensing device was prepared as previously reported,3 with the flow shutoff system described in this paper constructed in place of the flap valve originally used, following the process illustrated in Fig. 1. Briefly, the sensors consisted of two channels of 0.7 × 0.5 cm linked by the flow shutoff system (using a 0.15 mm thick pullulan film). The channel on the right (fast flow) was covered on both sides of the filter paper with polyester film in order to increase the flow speed. The channel on the left (slow flow) was constructed with a sensing zone and a substrate zone. The sensing zone was prepared by manually depositing PVAm (0.25% wt% in ddH2O)/silica sol precursor (prepared as previously described3,25)/acetylcholinesterase (500 U ml−1 in 100 mM Tris buffer pH 8)/silica sol precursor, while the substrate zone was prepared by manually depositing silica sol precursor/indoxyl acetate (3 mM in 100 mM Tris buffer pH 8 with 3% v/v methanol)/silica sol precursor.Pesticide sensor testing
The assembled pesticide sensors were tested by exposing the bottom 5 mm of each channel to the sample solution (0–100 μM malathion in 100 mM Tris buffer pH 8). Similarly to the uni-directional design sensor previously described,3 the sample solution reaches the sensing zone first (in approximately two minutes) allowing incubation of the enzyme. Previously at that point users had to open the flap valve, whereas now the soluble pullulan film automatically dissolves and cuts off the flow to the sensing zone. The sample solution flow in the left channel continues, allowing the substrate to flow to the sensing zone. Once the sensing zone is fully wetted the sensor is removed from the solution and allowed to air dry. The test strips were then imaged using a handheld scanner (Flip Pal 100C mobile scanner). The color intensity of the sensing zone was quantified using ImageJ software. Images were inverted so that in the 256 bit color scale white corresponds to a color intensity of 0 and black corresponds to 256.Results and discussion
Flow system
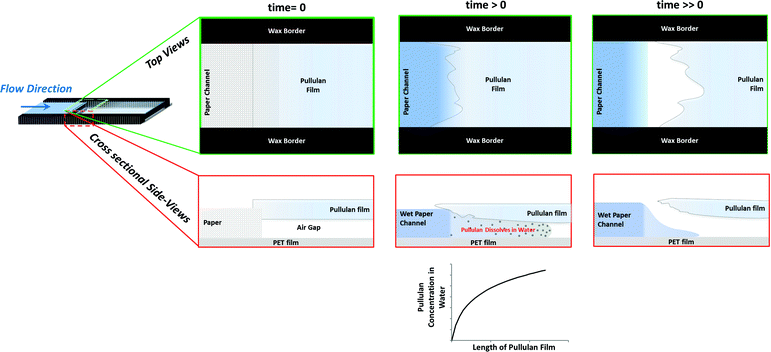
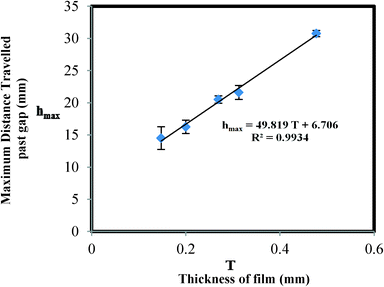
Pullulan films can be used in paper-based microfluidic devices as a flow shutoff system as shown in Fig. 2. The pullulan film acts as a dissolvable bridge, which is able to control the amount of liquid flowing past the gap. Before dipping the device in water, there is an air gap between the pullulan and PET films (see panel for time = 0). As the device is dipped in water, the capillary formed between these two films becomes filled with water, which initiates dissolution of the pullulan film. According to the Noyes–Whitney equation,26 the rate of dissolution is highest when the bulk solute (pullulan in this case) concentration is lowest, giving maximum driving force for dissolution. For our device, this happens when the water first meets the pullulan film (see panel for time > 0). The flow in the device stops when the capillary formed between the pullulan and PET films is destroyed due to complete dissolution of the pullulan film in the z-direction in the initial section of the pullulan bridge. Note that not all the pullulan in the bridge needs to be dissolved to stop the flow – just enough dissolution has to occur to destroy the capillary gap in the initial section of the bridge. Sequential dye release from the pullulan bridge, shown in Fig. III in the ESI,† confirms that the bridge dissolves from the bottom upwards.Fig. 3 shows the relationship between the thickness of the pullulan film and the distance of the liquid flow past the gap. In the pullulan shutoff system, due to the dissolution of the pullulan bridge the upper section of the paper channel is disconnected from the water source; and there is a linear relationship between the thickness of the film and the maximum distance travelled by the liquid. These results are in good agreement with the working principle depicted in Fig. 2. In the ESI† we describe how to cast films with well-defined thicknesses.
We also performed experiments (data not shown) to determine the effect of the widths of the paper channel and pullulan bridge on the behaviour of the device. The effect was found to be negligible, in agreement with the working principle depicted in Fig. 2, where flow switch off is solely dependent on the thickness of the pullulan bridge. No attempts were made to accurately control the size of the gap existing between the pullulan and PET films, since it has been shown by us10 and others27 that the rate at which water moves between two fully wettable flexible surfaces does not depend on the distance between the films at time zero. As the water moves due to capillary action, the films are deformed in response to the capillary force, resulting in the formation of a wedge at the front of the water, i.e. the capillary formed is self-controlled through a balance of capillary forces and the forces associated with the mechanical deformation of the films.
Data analysis and parameter extraction
The shutoff system can be divided into three separate sections: the lower section, the bridge section, and the upper section. The lower section starts from the very bottom of the paper strip and ends at the point just before the pullulan film. The bridge section refers to the gap in the channel where a capillary is formed between the PET film and the pullulan film. Finally, the upper section begins at the top edge of the pullulan film and continues to the top of the paper strip.
In the lower section, the water flow in the paper strip is the same as water flow through plain filter paper. This is expected since the lower section is made up of unmodified filter paper. Therefore, the water flow in the lower section follows a modified version of the Lucas–Washburn equation.28
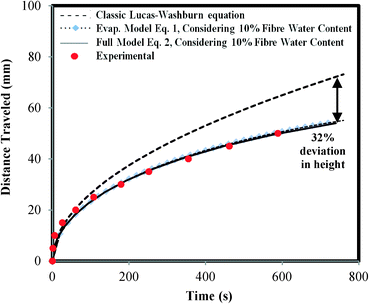
Fig. 4 depicts the experimental data of the water flow on Whatman #1 filter paper strips and shows the comparison between the traditional Lucas–Washburn model and the modified models adapted from N. Fries et al. 200829 and A. Rogacs et al. 2010.30 The two modified models were further altered by taking into account the effect of the water content of the paper fibres.31 Cellulose fibres have a “fibre saturation point” that describes the water content in the pores of the fibre wall. The water in the pores is more difficult to evaporate because of capillary condensation. Due to this, the effect of evaporation cannot be viewed as binary, i.e. the paper is fully dry or the paper is fully wet. Depending on the relative humidity, paper can hold almost 10 w/w% water.32 The models proposed by N. Fries et al. in 200829 assumed the system to be binary, i.e. either wet or dry. This assumption leads to over-prediction of the capillary height rise rate.31 The adjusted model takes into account the water content of the paper fibres and is shown in Fig. 4.
In the full model prediction,29,31 the effects of gravity, evaporation, and water content of the paper fibres have been incorporated into the traditional Lucas–Washburn equation:
 | (1) |
While in the evaporation model,30,31 the gravitational effect is neglected:
 | (2) |
Where:
 | (3) |
From Fig. 4, it can be seen that for paper strips shorter than 10 cm the gravitational effect can be neglected since the deviation of the evaporation model from the full model prediction is less than 0.5%. Thus, the evaporation model was chosen due to its simplicity in comparison to the full model. Furthermore, the evaporation model fits well with the data when the water content of the paper fibre is taken into account.
In the pullulan shutoff system, the water flow in the upper section is much slower than that in the lower section. This is due to the increase in viscosity as the pullulan is dissolved into the solution. Nevertheless, the evaporation model that was applied to the lower section can still be used to describe the flow in the upper section. The main difference between the two sections is the viscosity of the travelling liquid.
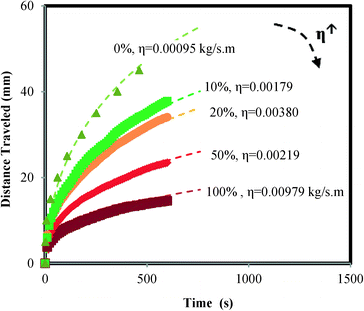
To estimate the pullulan concentration in the water after it passes over the pullulan bridge, a series of pullulan solutions of different concentrations were made. The viscosities of these solutions were measured using an Ubbelohde viscometer. The rate of capillary rise of these solutions on Whatman #1 filter paper was measured. As shown in Fig. 5, an increase in concentration leads to slower capillary rise. This is due to the increase in viscosity as the concentration of pullulan increases. Using the viscosities measured for each of the solutions, the evaporation model is fitted to the data. As shown in Fig. 5, the evaporation model adequately describes the data.
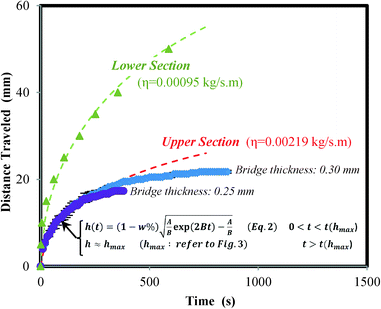
Additionally, the rate of water capillary rise through the pullulan shutoff system (Fig. 6) was compared with the results of Fig. 5. It can be seen that the rate of capillary rise for the 50% diluted pullulan solution (20.8 g L−1 pullulan) fits well with the data from water capillary rise through the upper section of the pullulan shutoff system. Therefore, it may be inferred that the solution in the upper section has a similar viscosity to that of the 50% diluted pullulan solution.
Fig. 6 compares rate of capillary rise of the lower and upper sections of the pullulan shutoff device. It also shows the evaporation model for both sections. In the upper section, it should be noted that the deviation which is observed after a specific height (dependent on pullulan film thickness) is due to the full dissolution of the pullulan bridge (refer to Fig. 3) which severs the upper section from the water source.
Application in a paper based sensor
The pesticide sensor previously reported1,3 is based on the colorimetric detection of acetylcholinesterase (AChE) activity, which is known to be inhibited in the presence of organophosphate pesticides. The sensor exhibits a blue color change in the sensing region in the absence of inhibitors (organophosphate pesticides) in the sample solution, while in the presence of organophosphate pesticides the AChE activity is inhibited, and a dose-dependent decrease in the blue color intensity is observed. The intensity of the color change can be quantitatively analysed, correlating the concentration of pesticide in the sample to the intensity of the color generated.
To detect organophosphate pesticides the sensing (enzyme) zone first needs to be pre-incubated with the sample for at least 2 min prior to the addition of the substrate, as inhibition is time-dependent. The substrate is then introduced to the reaction area after the delay time to elicit a color change. In both of the previous designs the exact moment of when the sensing zone is fully wetted is determined by the user either (a) removing the sensor from the solution in the originally developed bi-directional design (so-called inverted lateral flow),3 or (b) manually switching off the flap valve in the uni-directional design.1 These two previous designs relied on the user's ability to determine the moment when the enzyme zone was fully wetted, which may lead to inconsistent amounts of analyte loaded into the sensing zone and thus irreproducible quantitative results. In order to improve both the reproducibility and ease of use of the sensor, in the present design, the automatic shutoff bridge replaces the manual flap valve as demonstrated in Fig. 7.
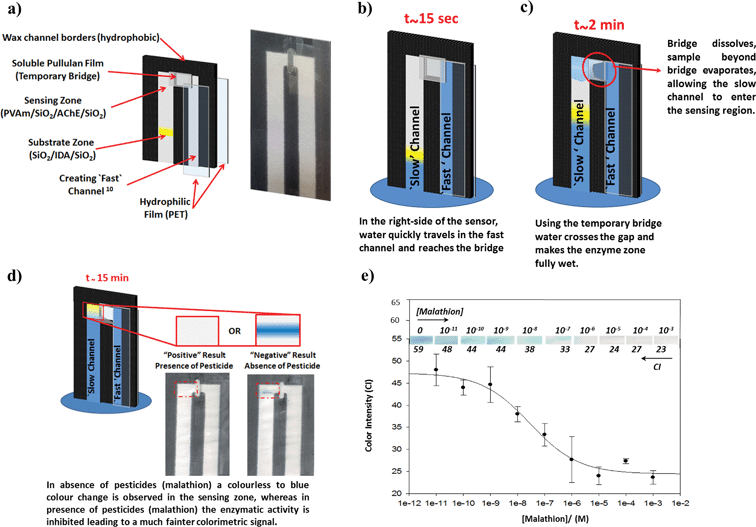 | ||
| Fig. 7 A fully automated bioactive paper sensor for organophosphate pesticide detection. (a) Schematic illustration of the sensor construction (on the left), and an image of the actual device (on the right). The right side of the sensor is covered by PET film to create a ‘fast’ channel.10 An automatic shut-off system (temporary bridge) was created using a soluble pullulan film to control the flow from the covered “fast” channel to the uncovered “slow” channel on the left. A sensing zone (PVAm/SiO2/AChE/SiO2) and a substrate zone (SiO2/IDA/SiO2) were deposited on the uncovered “slow” channel. Following sample introduction, time-sequential schematics are shown as: (b) at around 15 s the sample passes through the “fast” channel and reaches the bridge position; (c) after 2 min the enzyme zone is fully wetted, and due to the dissolution of the soluble pullulan film the bridge automatically disconnects, enabling the sensing zone to dry, and (d) at around 15 min the solution moves through the non-covered “slow” channel and arrives in the pre-wetted enzyme zone and the color change is elicited after 5 min; the intense blue color on the right images was obtained with a Tris buffer solution which did not contain any pesticide, while the left image was obtained for a 10−5 M malathion sample. (e) Plot of dose-dependent inhibition of acetylcholinesterase (AChE) by various concentrations of malathion; three repeats were conducted for each concentration and all points are average of the repeats. | ||
In this new format, the pullulan temporary bridge-system severs the flow stream from the fast channel automatically and provides a consistent incubation time while allowing the sensing (enzyme) zone to be dried before the substrate arrives. This new format results in a simplified assay that detects the presence of pesticides automatically without any further manipulation from the user.
Fig. 7d illustrates both a positive and a negative test result for the pesticide sensor and Fig. 7e shows a semi logarithmic plot of the dose-dependent inhibition by malathion. As previously reported,3,10 an increasing concentration of malathion progressively inhibits the activity of AChE. The IC50 value for malathion (i.e., 50% inhibition) was 29 nM (calculated by fitting the four parameter Hill equation with SigmaPlot 10.0) and the limit of detection (concentration corresponding to 3 standard deviations below the mean signal from the blank) was 6 nM. The obtained results were comparable with the original sensor. The reliable operation of the pesticide sensor indicates that the functionality of the previously reported sensor3 is not affected by the addition of an automatic flow shut-off system or the presence of the pullulan.
Conclusions
Pullulan, a rapidly dissolving polymer, has been used to fabricate an automatic flow shutoff system for paper-based microfluidic analytical devices. Replacing part of the paper channel with an interruptible capillary channel formed by a dissolvable film allows for automatic flow control through paper-based devices. This time dependent flow shutoff technology allows the user to manipulate fluid movement to cater to time sensitive or multi-step reactions and assays. The construction of a modified organophosphate pesticide detector demonstrates that with an automatic flow shut-off system as presented, paper-based microfluidic devices are more useful for multi-process systems and timed reactions due to enhanced flow control, while remaining inexpensive, reliable and equipment-free to operate. In addition to serving as a flow shutoff system and possessing the ability to control fluid flow in the system, pullulan films can also be used for the delivery of reagents; reagents can be added to the pullulan films to provide time dependent reagent release. Not only the release of multiple reagents, but also the sequential release of reagents is possible using pullulan. These results will be reported in a separate manuscript.Acknowledgements
The authors thank the Natural Sciences and Engineering Research Council of Canada for funding this work through a Network Grant-SENTINEL Canadian Network for the Development and Use of Bioactive Paper. The authors also thank the Canada Foundation for Innovation and the Ontario Innovation Trust for support of this work. R. P. holds the Canada Research Chair in Interfacial Technologies. J. D. B. holds the Canada Research Chair in Bioanalytical Chemistry and Biointerfaces.Notes and references
- M. Hitzbleck, L. Avrain, V. Smekens, R. Lovchik, P. Mertens and E. Delamarche, Lab Chip, 2012, 12, 1972–1978 RSC.
- P. Von Lode, Clin. Biochem., 2005, 38, 591–606 CrossRef CAS PubMed.
- S. M. Z. Hossain, R. E. Luckham, M. J. McFadden and J. D. Brennan, Anal. Chem., 2009, 81, 9055–9064 CrossRef CAS PubMed.
- J. Lankelma, Z. Nie, E. Carrilho and G. M. Whitesides, Anal. Chem., 2012, 84, 4147–4152 CrossRef CAS PubMed.
- S. M. Z. Hossain, C. Ozimok, C. Sicard, S. D. Aguirre, M. M. Ali, Y. Li and J. D. Brennan, Anal. Bioanal. Chem., 2012, 403(6), 1567–1576 CrossRef CAS PubMed.
- D. D. Liana, B. Raguse, J. J. Gooding and E. Chow, Sensors, 2012, 12, 11505–11526 CrossRef CAS PubMed.
- G. G. Lewis, M. J. DiTucci and S. T. Phillips, Angew. Chem., Int. Ed., 2012, 51, 12707–12710 CrossRef CAS PubMed.
- J. Comer, Anal. Chem., 1956, 28, 1748–1750 CrossRef CAS.
- A. Apilux, Y. Ukita, M. Chikae, O. Chailapakul and Y. Takamura, Lab Chip, 2013, 13, 126–135 RSC.
- S. Jahanshahi-Anbuhi, P. Chavan, C. Sicard, V. Leung, S. M. Z. Hossain, R. Pelton, J. D. Brennan and C. D. M. Filipe, Lab Chip, 2012, 12(23), 5079–5085 RSC.
- H. Chen, C. Jeremy, C. Anagnostopoulos and M. Faghri, Lab Chip, 2012, 12, 2909–2913 RSC.
- X. Li, P. Zwanenburg and X. Liu, Lab Chip, 2013, 13, 2609–2614 RSC.
- H. Noh and S. T. Phillips, Anal. Chem., 2010, 82, 4181–4187 CrossRef CAS PubMed.
- H. Noh and S. T. Phillips, Anal. Chem., 2010, 82, 8071–8078 CrossRef CAS PubMed.
- E. Fu, B. Lutz, P. Kauffman and P. Yager, Lab Chip, 2010, 10, 918–920 RSC.
- B. Lutz, T. Liang, E. Fu, S. Ramachandran, P. Kauffman and P. Yager, Lab Chip, 2013, 13, 2840–2847 RSC.
- B. Lutz, P. Trinh, C. Ball, E. Fu and P. Yager, Lab Chip, 2011, 11, 4274–4278 RSC.
- E. L. T. Fu, P. Spicar-Mihalic, J. Houghtaling, S. Ramachandran and P. Yager, Anal. Chem., 2012, 84, 4574–4579 CrossRef CAS PubMed.
- P. Novo, F. Volpetti, V. Chu and J. O. P. Conde, Lab Chip, 2013, 13, 641–645 RSC.
- A. W. Martinez, S. T. Phillips, Z. Nie, C. M. Cheng, E. Carrilho, B. J. Wiley and G. M. Whitesides, Lab Chip, 2010, 10, 2499–2504 RSC.
- H. Liu, X. Li and R. M. Crooks, Anal. Chem., 2013, 85, 4263–4267 CrossRef CAS PubMed.
- M. R. Rekha and C. P. Sharma, Trends Biomater. Artif. Organs, 2007, 20, 116–121 Search PubMed.
- T. D. Leathers, Biopolymers Online, 2005, pp. 1–11 Search PubMed.
- R. Mishra and A. Amin, Indian J. Pharm. Educ. Res., 2010, 45(1), 71–77 Search PubMed.
- S. M. Z. Hossain, R. E. Luckham, A.-M. Smith, J. M. Lebert, L. M. Davies, R. H. Pelton, C. D. M. Filipe and J. D. Brennan, Anal. Chem., 2009, 81, 5474–5483 CrossRef CAS PubMed.
- A. Noyes and W. R. Whitney, J. Am. Chem. Soc., 1897, 19(12), 930–934 CrossRef.
- T. Cambau, J. Bico and E. Reyssat, Europhys. Lett., 2011, 96, 24001 CrossRef.
- J. Hyväluoma, P. Raiskinmäki, A. Jäsberg, A. Koponen, M. Kataja and J. Timonen, Phys. Rev. E: Stat., Nonlinear, Soft Matter Phys., 2006, 3(73), 036705-1-8 Search PubMed.
- N. Fries, K. Odic, M. Conrath and M. Dreyer, J. Colloid Interface Sci., 2008, 321, 118–129 CrossRef CAS PubMed.
- A. Rogacs, J. E. Steinbrenner, J. A. Rowlette, J. M. Weisse, X. L. Zheng and K. E. Goodson, J. Colloid Interface Sci., 2010, 349, 354–360 CrossRef CAS PubMed.
- D. A. Barry, J. Y. Parlange, D. A. Lockington and L. Wissmeier, J. Colloid Interface Sci., 2009, 336, 374–375 CrossRef CAS PubMed.
- S. A. Reardon, M. R. Davis and P. E. Doe, Tappi J., 2000, 83(9), 58–79 CAS.
- American Society of Heating, Ashrae handbook. Heating, ventilating, and air-conditioning applications, in Refrigerating and Air Conditioning Engineers, Atlanta, GA, 2003 Search PubMed.
Footnotes |
| † Electronic supplementary information (ESI) available. See DOI: 10.1039/c3lc50762a |
| ‡ The film needs to be long enough to slightly overlap the channel, and wider than the gap for gluing purposes. |
| This journal is © The Royal Society of Chemistry 2014 |


![[dash dash, graph caption]](https://www.rsc.org/images/entities/char_e091.gif) ), evaporation model considering 10% fibre water content (⋯
), evaporation model considering 10% fibre water content (⋯
![[thick line, graph caption]](https://www.rsc.org/images/entities/char_e117.gif) ).
).
