Gallic acid and gallic acid-loaded coating involved in selective regulation of platelet, endothelial and smooth muscle cell fate
Yonghui
He
ab,
Juan
Wang
abc,
Wei
Yan
ab and
Nan
Huang
*ab
aKey Laboratory of Advanced Technology of Materials of Education Ministry, School of Materials Science and Engineering, Southwest Jiaotong University, Chengdu, 610031, China. E-mail: nhuang@263.net
bThe Institute of Biomaterials and Surface Engineering, School of Materials Science and Engineering Southwest Jiaotong University, Chengdu, 610031, China
cNational Science Foundation Engineering Research Center of Revolutionizing Metallic Biomaterials, North Carolina A & T State University, Greensboro, NC 27411, USA
First published on 6th November 2013
Abstract
The drug-eluting stent (DES) is the most common means for the treatment of severe coronary heart disease in the clinic. However the DES has some drawbacks, these are long-term endothelial dysfunction, non selective cytotoxicity and late stent thrombosis. Hence, it is significantly important to find a drug or molecule with selective cytotoxicity for the DES. In this work, the effect of gradient concentration of gallic acid on endothelial and smooth muscle cells was investigated through alone-culture and co-culture methods. It was demonstrated that gallic acid promoted the growth of human umbilical vein endothelial cells (HUVECs) and suppressed the proliferation of human umbilical artery smooth muscle cells (HUASMCs) at the concentration of ∼5 μg ml−1. Then, gallic acid was mixed into poly(1,3-trimethylene carbonate) to prepare GA-loaded PTMC film via solvent evaporation. And material characteristics and biological evaluations are carried out by different means. These results showed that the GA-loaded PTMC film inhibited the adhesion and activation of platelets, indicating a good anticoagulant performance. Also, this film with a certain GA loading (∼1 wt%) provided significant enhancement for the adhesion and proliferation of HUVECs and inhibition of the growth of HUASMCs. These data suggested the large potential of GA for drug-eluting stent and other vascular devices.
1. Introduction
Atherosclerosis is recognized as a major health threat worldwide, because of its high fatality.1,2 Although the pathobiology of atherosclerosis is a complex multifactorial process, the selective regulation of platelet, endothelial and smooth muscle cell fate are considered to be the most important function of an ideal vascular stents or graft for atherosclerosis treatment.3 The drug-eluting stent (DES) is the most common means for the treatment of severe atherosclerosis in the clinic which greatly reduces the restenosis to a rate of less than 10%.4,5 However the DES has some drawbacks, these are long-term endothelial dysfunction, non-selective cytotoxicity and late stent thrombosis.6,7 Currently the drug-eluting coatings of Cypher and Taxus are mainly available in the clinic which is principally focused on inhibiting vascular smooth muscle cell (VSMC) proliferation.8,9 However the growth of endothelial cells (EC) is also suppressed by these drugs at the same time, resulting in a delayed regeneration of endothelium as well as the above problems.10,11 Hence, it is significantly important to find a drug or molecule with selective cytotoxicity between VSMC and EC, which strongly inhibits the growth of VSMC, while promotes the growth of EC or has lesser cytotoxicity for EC compared with VSMC at least,12 and balances anticoagulation function.Gallic acid (3,4,5-triphydroxyl-benzoic acid, GA) is particularly abundant in processed beverages such as red wines and green teas.13 It is a polyphenyl natural product which can be obtained under acid hydrolysis of hydrolysable tannins. Previous studies have shown that GA has some therapeutic properties including antitumoral,14 anti-bacterial,15 anti-viral16 and anti-inflammatory17 activity. As an important anticarcinogen,18 GA has the potential to be used for a drug-eluting stent. The antitumor activity of GA seems to be related to the induction of apoptosis by different mechanisms depending on the cell type.19 Particularly, GA has shown selective cytotoxicity against a variety of tumor cells with a higher activity than that shown against non-tumoral cell lines.14,20 In addition, GA exhibits low toxicity in vivo.19,21 Moreover, Qiu et al.22 showed that GA induced vascular smooth muscle cell death via hydroxyl radical production and other reporters have also reported that GA exhibits low cytotoxicity against normal mouse brain endothelial cells and human umbilical vein endothelial cells.14,23,24 In this study, it is investigated that the modulating effect of the different concentrations of GA on the human umbilical vein endothelial cells (HUVEC) and human umbilical artery smooth muscle cells (HUASMC). We found a definitely concentration at which GA strongly inhibited the growth of HUASMC but had no cytotoxicity for HUVEC. Therefore, GA is chosen as the drug for drug-eluting stent in this paper.
For drug-eluting stents, it is important to have a suitable drug carrier vehicle (usually a polymer), which controls drug elution. The biodegradable polymers such as poly(lactic acid) (PLA) and poly(lactic-co-glycolic acid) (PLGA) which are fully metabolized to water and carbon dioxide, leaving in situ bare-metal stent after all the drug has been released, have been widely used as drug carrier for drug-eluting stents.8,25,26 However, it is well known that these polymers degrade throughout the bulk and induce internal autocatalysis which cause fast release of acidic degradation products during the degradation process, and finally cause unfavorable effects.27–29 As a surface-eroding biodegradable polymer, poly(1,3-trimethylene carbonate) (PTMC) is one of the synthetic biodegradable polymer which is approved by FDA of the United States.30 PTMC shows good blood, cell and tissue compatibility31,32 and non-acidic degradation products,33 which can be used for drug delivery system34,35 and tissue engineering.36 Hence, PTMC is selected as the stent coating polymer here.
In this study, we investigated the modulating effect of GA on HUVEC and HUASMC through alone-culture and co-culture methods. And, the certain concentration selectively inhibiting the two kinds of cells was found. Then, a GA-loaded PTMC film on 316L stainless steel is prepared by solvent evaporation. The material characteristics and biological properties in vitro are systematically evaluated. A certain GA loading of the film exhibiting selective effects and anticoagulation function was also found. These works have great significance for the development of drug-eluting stent and other vascular devices.
2. Experimental section
2.1 Materials
Gallic acid (GA) with a purity of above 97% was acquired from Jinshan Regents Company, Chengdu, China. Poly(1,3-trimethylene carbonate) (PTMC) with an average molecular weight of ∼500![[thin space (1/6-em)]](https://www.rsc.org/images/entities/char_2009.gif) 000 g mol−1 was purchased from Jinan Daigang Biomaterial Co., Ltd, China. 316L stainless steel (SS) was obtained from New Material Co., Ltd (Xi'an, China). Other reagents were all analytical grade in the experimental part.
000 g mol−1 was purchased from Jinan Daigang Biomaterial Co., Ltd, China. 316L stainless steel (SS) was obtained from New Material Co., Ltd (Xi'an, China). Other reagents were all analytical grade in the experimental part.
2.2 The modulating effect of GA on HUVEC and HUASMC
HUVECs and HUASMCs were obtained from human umbilical cords which were kindly provided by Women and Children Healthcare Centre of Chengdu. HUVECs were isolated from umbilical cord using enzymatic digestion and cultured in a humidified incubator 5% CO2 at 37 °C using Dulbecco's modified eagle medium/Ham F12 medium (DMEM/F12) supplemented with 15% fetal bovine serum (FBS, DMEM/F12 and FBS were obtained from HyClone company) and 20 μg ml−1 endothelial cell growth supplement (ECGS, Millipore, Inc.). HUASMCs were obtained by culturing small pieces of umbilical artery in DMEM/F12 with 10% FBS under standard cell culture conditions as mentioned above.Sterile GA solutions with different concentrations were prepared with normal saline. HUVECs and HUASMCs were respectively seeded in 48-well plates at a density of 5 × 10⁴ cells per ml and 3 × 10⁴ cells per ml for 6 h until cells adhered. Then, the culture medium was replaced by 900 μl of fresh culture medium and 100 μl of GA solution resulting in a gradient concentration at 0.5, 5, 50, 100 μg ml−1 of GA and the control sample was added by equal normal saline. After 1, 3 and 5 days incubation, cell viability were evaluated. In addition, the culture medium of the time point of 5 days was replaced by new GA culture medium at the third day.
![[thin space (1/6-em)]](https://www.rsc.org/images/entities/char_2009.gif) :
:![[thin space (1/6-em)]](https://www.rsc.org/images/entities/char_2009.gif) 1 mixture) at 37 °C for 10 min, and then immediately inspected in a fluorescence microscope (DMRX, Leica, Germany).
1 mixture) at 37 °C for 10 min, and then immediately inspected in a fluorescence microscope (DMRX, Leica, Germany).
2.3 Preparation of GA-loaded PTMC film on 316L SS
PTMC and GA were dissolved in dichloromethane at a concentration of 1 wt% and 1 ml of ethanol, respectively. Then, the GA solution was dripped into the PTMC solution during the stirring process. The mirror polished disks (Φ = 10 mm) were immersed in the above mixed solution at 20 °C. The films were fabricated on the 316L SS samples via solvent evaporation. After that, the samples were maintained in a vacuum for 24 h at room temperature to remove all residual solvent. The samples were named PTMC-GA1%, PTMC-GA5% and PTMC-GA10%, corresponding to PTMC with 1, 5, 10 wt% GA, respectively.2.4 Material characteristics
In consideration of the biological activity and modulating effects on HUVEC and HUASMC of GA, a GA-loaded PTMC film was prepared via solvent evaporation and its material characteristics were investigated by FTIR, SEM and contact angles. The chemical structures were characterized by FTIR analysis, the wettability and surface energy were measured by contact angle assay, and the surface morphology was described by SEM.2.5 In vitro hemocompatibility
Human whole blood was obtained from Blood Center of Chengdu, China via legal way. The experiments were carried out within 8 h after the blood donation. The anticoagulant of the blood was tri-sodium citrate in a 9![[thin space (1/6-em)]](https://www.rsc.org/images/entities/char_2009.gif) :
:![[thin space (1/6-em)]](https://www.rsc.org/images/entities/char_2009.gif) 1 volumetric ratio. The amounts of the samples used for statistical count were not less than four.
1 volumetric ratio. The amounts of the samples used for statistical count were not less than four.
After being fixed, other samples were stained by Rhodamine–phalloidin (60 μl per sample, lucifuge for 10 min). Then, the samples were washed by normal saline three times. After that, samples were visualized by a fluorescent microscopy (Zeiss, Germany).
2.6 In vitro cytocompatibility
The effects of the GA-loaded PTMC films on HUVECs and HUASMCs were evaluated in this part. The culture of cells was mentioned previously.2.7 Statistical analysis
All the quantitative results were expressed as mean ± standard deviation (SD). The statistical significance of differences between groups was determined using one-way ANOVA followed by post-hoc analysis. Significance was established by a value of p < 0.05, *p < 0.5, **p < 0.01.3. Results and discussion
3.1 The modulating effect of GA on HUVEC and HUASMC
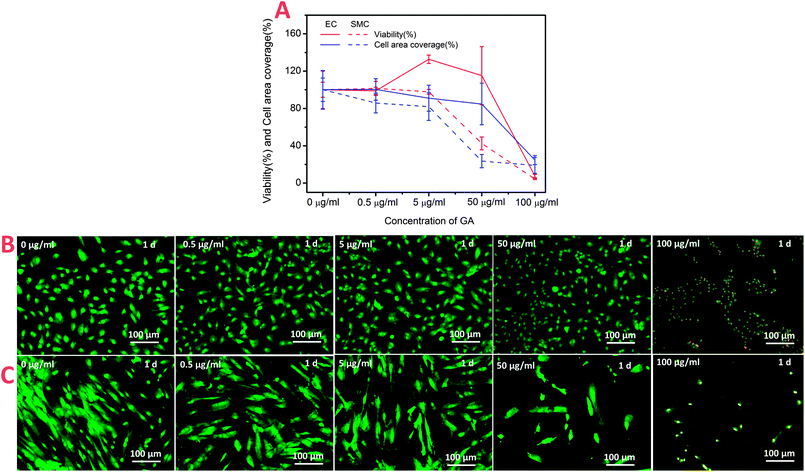
It is significantly important to understand what the effects of the drug/molecule on EC and SMC as it is applied for a drug-eluting stent. The effect of GA with different concentrations on these cells was investigated by cell culture experiments. Fig. 1A showed cell viability, area coverage and morphology as a function of GA concentrations after 1 day. The results indicated that the modulating function of GA on HUVEC and HUASMC performed a strong dose-dependent, but HUVEC and HUASMC showed different sensitivities with the increasing of GA concentration. As shown in Fig. 1A, among the concentrations of 5–50 μg ml−1, the cell viability (the red lines) of EC (the red solid line) was much stronger than that of SMC (the red dotted line). The relative viability of HUVEC at the concentration of 5 and 50 μg ml−1 were 132% and 115%, respectively, while that of HUASMC were 97% and 42%, respectively, defining the control sample (0 μg ml−1) as 100%. And the cell area coverage (the two blue lines) also indicated the similar results. In addition, there were more directly evidence from the AO/PI staining images. GA treatment at a especial concentration of ∼50 μg ml−1 had no cytotoxicity to HUVEC with a good growth morphology and high viability, while strongly inhibited the growth of HUASMC and caused death (Fig. 1B and C). It is more interesting that the results of co-culture also showed the different sensitivities of GA to HUVEC and HUASMC (Fig. 2). As seen in Fig. 2A, the ratio of HUVEC and HUASMC in cell number and cell area coverage in co-culture condition had a significant rise from 2.0 and 0.98 of the control to 3.4 and 1.86 of the sample with concentration of 5 μg ml−1, respectively. At co-culture condition, the cells performed good growth morphologies at the concentration of ≦ 5 μg ml−1 indicating a high viability (Fig. 2B). These data indicated that the effects of GA on HUVEC and HUASMC performed dose-dependent, GA performances different sensitivities to HUVEC and HUASMC. GA at the concentration of 5 μg ml−1 showed a selective effect which promotes the growth of HUVEC, while inhibits the growth of HUASMC. In other words, GA with a drug controlled release concentration of 5 μg ml−1 may be a valuable candidate for the drug-eluting stent. | ||
| Fig. 2 (A) The ratio of HUVEC and HUASMC in cell numbers and cell area coverage in co-culture condition after 1 day. (B) Fluorescence micrographs of HUVEC (Green) and HUASMC (Orange). | ||
3.2 Material characteristics
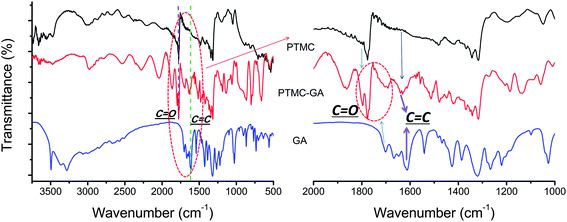
FTIR was performed to understand the changes of the chemical structure of substrates. As shown in Fig. 3, the FTIR spectra at the characteristic region 1776 cm−1 and 1701 cm−1 are C![[double bond, length as m-dash]](https://www.rsc.org/images/entities/char_e001.gif) O stretching vibration peak from PTMC and GA, respectively, while the C
O stretching vibration peak from PTMC and GA, respectively, while the C![[double bond, length as m-dash]](https://www.rsc.org/images/entities/char_e001.gif) O stretching vibration peak of PTMC–GA changed and became complex. These changes of C
O stretching vibration peak of PTMC–GA changed and became complex. These changes of C![[double bond, length as m-dash]](https://www.rsc.org/images/entities/char_e001.gif) O stretching vibration peak of PTMC–GA may be the spectra combination of PTMC and GA. The essential feature of GA is C
O stretching vibration peak of PTMC–GA may be the spectra combination of PTMC and GA. The essential feature of GA is C![[double bond, length as m-dash]](https://www.rsc.org/images/entities/char_e001.gif) C stretching vibration which is observed at 1541 cm−1 and 1612 cm−1. After GA drug was loaded into PTMC polymer, some differences in the chemical structure were observed. New peaks of C
C stretching vibration which is observed at 1541 cm−1 and 1612 cm−1. After GA drug was loaded into PTMC polymer, some differences in the chemical structure were observed. New peaks of C![[double bond, length as m-dash]](https://www.rsc.org/images/entities/char_e001.gif) C at 1612 cm−1 (the peak was absent in PTMC) arise on the PTMC–GA. The changes of peaks in the spectra directly and strongly confirmed the successfully loading of GA. Moreover, there are acicular crystals of GA on the surface of GA-loaded PTMC films (Fig. 4). These results indicate that GA blended in the polymer possesses chemical stability.
C at 1612 cm−1 (the peak was absent in PTMC) arise on the PTMC–GA. The changes of peaks in the spectra directly and strongly confirmed the successfully loading of GA. Moreover, there are acicular crystals of GA on the surface of GA-loaded PTMC films (Fig. 4). These results indicate that GA blended in the polymer possesses chemical stability.
The surface morphologies of PTMC, PTMC-GA1%, PTMC-GA5%, PTMC-GA10% is displayed in Fig. 4. Great changes on the surface of GA-loaded PTMC films took place with the increasing of the amount of GA loading. Accordingly, the roughness of films was increased. It was already a porous surface of PTMC-GA10%. However, the surface of films was still uniform.
Surface hydrophilicity of material is one of important standards in evaluating the surface property of biomaterials which is a key factor to influence the biocompatibility.38 The water contact angle decreased from 76.1°(PTMC) to 51.8° (PTMC-GA10%) and the polar surface energy increased from 4.3 to 22.1 mN m−1 with the increasing of GA loading (Fig. 5). In order to evaluate surface properties of samples at simulated body condition, culture media (with 5% fetal bovine serum) contact angle was measured. The culture media contact angle of samples had consistent trend compared with water contact angle. One consequence is that the surface hydrophilicity decreased and the polar surface energy increased by loading GA, respectively. It is attributed to the increasing of surface roughness and the high water solubility of GA.
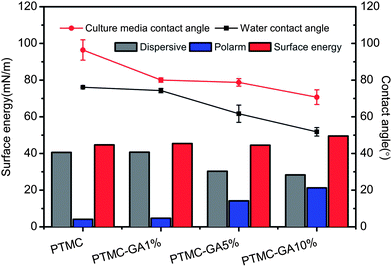 | ||
| Fig. 5 Water contact angle, culture media contact angle and surface energy of PTMC, PTMC-GA1%, PTMC-GA5% and PTMC-GA10% samples. | ||
3.3 In vitro hemocompatibility
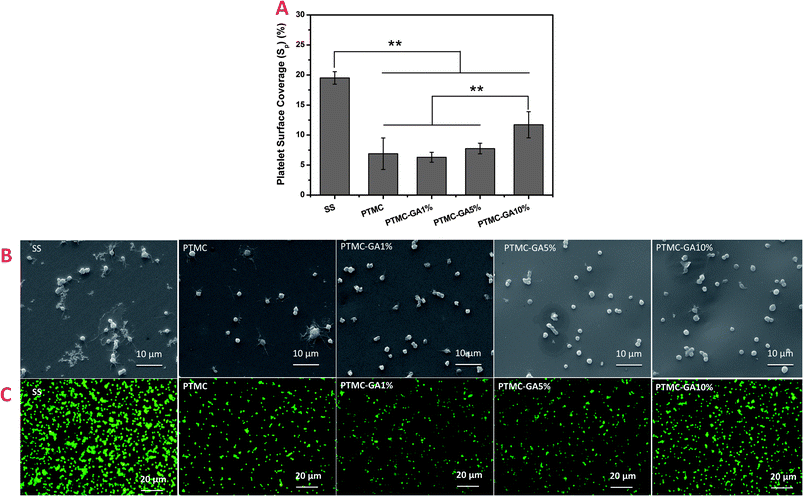
Platelets play an important biologic role in the vascular system in vivo, hence, the investigation of adherent behavior of platelet is a conventional approach to evaluate the in vitro hemocompatibilty of materials. The SEM results of platelet morphologies adhered on the surface of samples were shown in Fig. 6B. Most of adherent platelets on the 316L SS surface were highly activated with aggregations and pseudopodia, even some fully spreading. However, there are only a few platelets with pseudopodia and without aggregations on the surface of PTMC. In contrast to 316L SS and PTMC, most of platelets adhered on the surface of PTMC–GA samples (including PTMC-GA1%, 5% and 10%) remained a spherical state without pseudopodium. Therefore, these results indicated that the loading of GA in PTMC could significantly inhibit the activation of platelet. The platelets adhered on the surfaces were marked by Rhodamine staining to show a visual understanding of amount of platelet (Fig. 6B). The amount of platelet on PTMC and PTMC–GA samples were significantly less than that on 316L SS, while that of PTMC-GA10% sample was a little more than that on PTMC, PTMC-GA1% and PTMC-GA5% samples. It could be because platelets were easy to adhere on the PTMC-GA10% surface with relatively high roughness and wettability as described in 3.2. Also, the platelet coverage rates on the surfaces were systematically calculated in Fig. 6c, which presented a similar with the results of Rhodamine staining images. The platelet coverage rates on the SS, PTMC-GA1%, 5% and 10% samples were 19.5%, 6.9%, 6.3%, 7.8% and 11.7%, respectively. From these results, a small number of platelets adhered on the surface of sample contributed to the properties of PTMC. The above results suggested that the loading of GA on the PTMC could significantly inhibit the activation of platelets and the counts of adhered platelet on samples decreased due to the properties of PTMC, while the changes of surface properties of samples with the increasing of GA loading result in a increasing of adhered platelets.APTT, PT and TT tests are commonly used to evaluate anticoagulation properties of biomaterials in vitro: APTT is used to detect the intrinsic coagulation defined as the influence on the coagulation factors from the blood; PT is used to detect the extrinsic coagulation defined as the influence on the tissue factor from outside the blood; and TT is used to detect the last step of coagulation, the thrombin-mediated fibrin formation. As shown in Fig. 7A, compared to healthy blood plasma, the APTT of PTMC and PTMC-GA samples were shortened by about 4–5 s, and there was no obvious difference between them. For PT and TT tests, the clotting times were prolonged with the increasing of GA loading, while there was no obvious difference between PTMC and original plasma. The prolonging of PT and TT inhibited the activation of coagulation factors. In addition, in order to determine which one is the primary cause (PTMC or GA) for prolonging the APTT, an additional APTT test of different concentrations of GA was carried out. GA solution with 0, 5, 50 and 100 μg ml−1 of the concentration were prepared by normal saline solution. 100 μl of each GA solution were mixed with 300 μl of PPP for testing clotting time, respectively. And, normal saline with equal volume were mixed with PPP as a control. There was a significant prolongation in APTT with the increasing of GA concentration (Fig. 7B). The results showed that APTT of PTMC shortened by 4–5 s, while PT and TT of PTMC was similar to the original plasma. However, GA at 50, and 100 μg ml−1 of the concentration could obviously prolonged APTT and PT, TT.
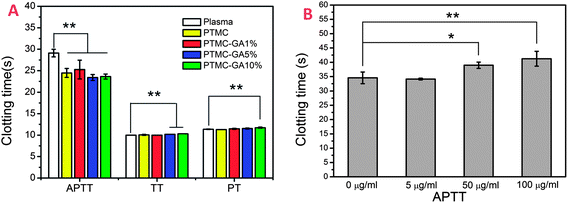 | ||
| Fig. 7 (A) Clotting times of Plasma, PTMC, PTMC–GA samples. (B) APTT time of GA solution with the different concentrations. | ||
3.4 In vitro cytocompatibility
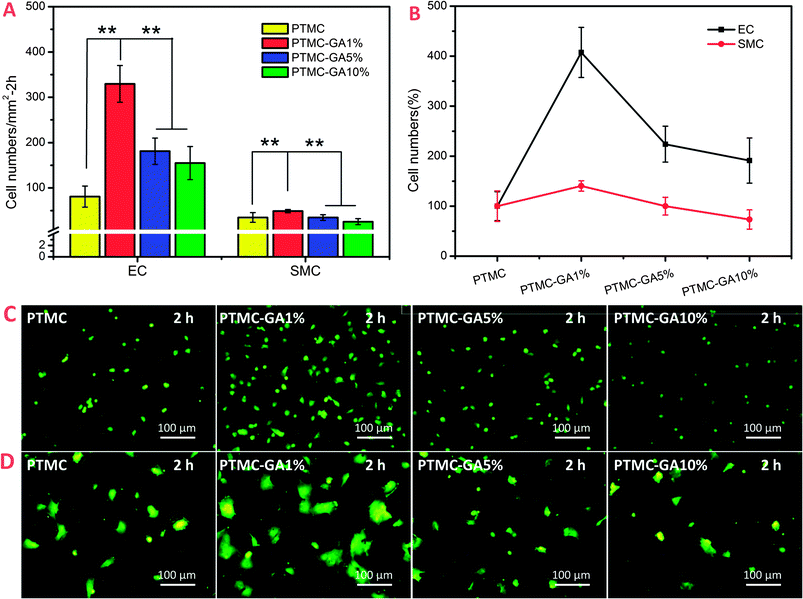
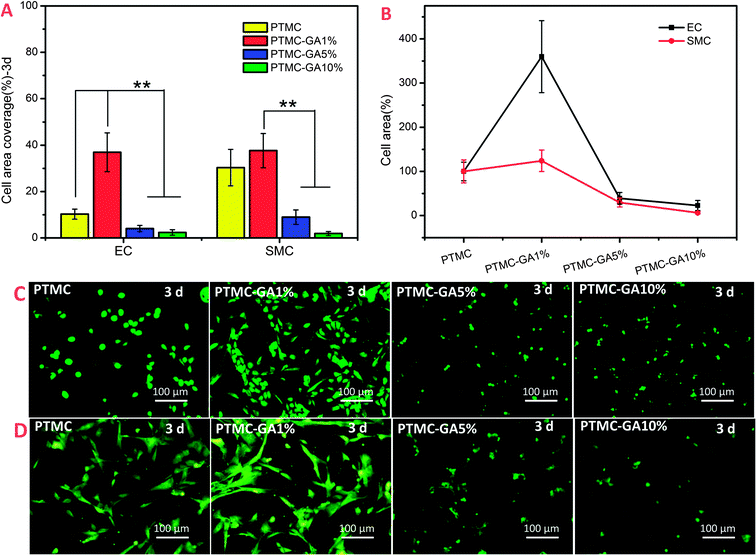
As mentioned above, GA performed different sensitivities to HUVEC and HUASMC at a certain concentration range (∼5 μg ml−1). Here, the adherent and growth behavior of HUVEC and HUASMC on different GA loading PTMC films were investigated to confirm whether it had the same effect compared to pure GA drug solution. Adhesion and morphology of HUVEC and HUASMC on different surfaces after 2 h were shown in Fig. 8. The number of cells (both HUVEC and HUASMC) on PTMC-GA1% surface rapidly increases and decreases on the surface of PTMC-GA5% and PTMC-GA10% (Fig. 8A). While, the effect of promoting cell adhesion of PTMC-GA1% on HUVEC was much stronger than that on HUASMC. The relative cell number of HUVEC and HUASMC were 407% and 140%, respectively, defining the PTMC sample as 100% (Fig. 8B). These results can be also indicated by images of Rhodamine staining, but the cell morphologies (both HUVEC and HUASMC) on PTMC-GA5% and PTMC-GA10% surfaces were abnormal which may be suppressed by a high concentration GA (Fig. 8C and D).The cell area coverage of different samples was used to evaluate the proliferation of cells. The cell area coverage and morphology of cells on different samples incubated for 3 days were shown in Fig. 9. The PTMC-GA1% significantly promoted the growth of HUVEC, while there was no obvious effect for HUASMC (Fig. 9A). With the increasing of GA loading (PTMC-GA5% and PTMC-GA10%), the samples had a strong inhibition of the proliferation of HUVEC and HUASMC with significantly decreasing in cell area coverage and death status (Fig. 9C and D). Here, the effect of promoting cell proliferation of PTMC-GA1% on HUVEC was stronger than that on HUASMC with relative cell area coverage of 359% of HUVEC and 124% of HUASMC, respectively (Fig. 9B).
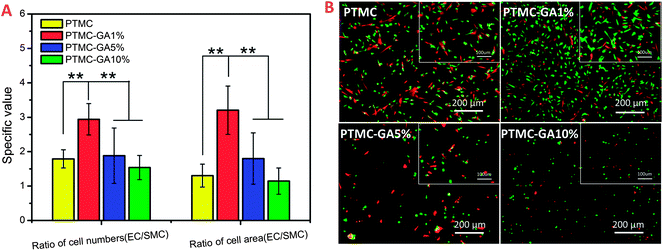
As shown in Fig. 10, the ratio of HUVEC and HUASMC in cell numbers and cell area coverage on different samples in co-culture condition had a significant rise for the PTMC-GA1% which was coincident with the results in alone-culture condition (Fig. 10A). The ratio of cell numbers and cell area coverage on PTMC were 1.7 and 1.3 and increased to 2.9 and 3.2 on the surface of PTMC-GA1%, respectively. What's more, the morphologies of cells on PTMC-GA% were spindle shape indicating high activity (Fig. 10B). Cells on the PTMC-GA5% and PTMC-GA10% were almost dead due to the high loading of GA (Fig. 10B). Hence, the effect of promoting cell proliferation of PTMC-GA1% on HUVEC was also stronger than that on HUASMC in co-culture condition.
From the above alone-culture and co-culture date, GA-loaded PTMC film with a certain GA loading (∼1 wt%) performed selective effect on HUVEC and HUASMC which was coincident with pure GA at the concentration of 5 μg ml−1. While PTMC films with high GA loading (≧5 wt%) induced cell apoptosis.
4. Conclusion
Gallic acid may be a potential candidate for atherosclerosis treatment due to some desirable properties for the regulation of platelet, endothelial and smooth cell fate. In this work, the effect of different concentration of gallic acid on endothelial and smooth cell is investigated through alone-culture and co-culture. It was found that gallic acid promotes the growth of endothelial cell and inhibits the proliferation of smooth muscle cell at the concentration of ∼5 μg ml−1. It was also proved that the GA-loaded PTMC film with a certain GA loading (∼1 wt%) also performs significantly enhancement for the adhesion and proliferation of HUVEC and inhibition for the growth of HUASMC. The anticoagulant behavior was also improved after GA being loaded, which inhibited the adhesion and activation of platelet and prolonged PT and TT time. Moreover, GA with high concentration (≧50 μg ml−1) prolonged APTT time. These data suggest the large potential of GA for drug-eluting stents and other vascular devices. However, these data are the results of in vitro experiments. In vivo experiments should be carried out in the next.Acknowledgements
This work is supported by National Natural Science Foundation of China (Project 81271701) and Key Basic Research Program (2011CB606204).References
- D. Lloyd-Jones, R. J. Adams, T. M. Brown, M. Carnethon, S. Dai, G. De Simone, T. B. Ferguson, E. Ford, K. Furie, C. Gillespie, A. Go, K. Greenlund, N. Haase, S. Hailpern, P. M. Ho, V. Howard, B. Kissela, S. Kittner, D. Lackland, L. Lisabeth, A. Marelli, M. M. McDermott, J. Meigs, D. Mozaffarian, M. Mussolino, G. Nichol, V. L. Roger, W. Rosamond, R. Sacco, P. Sorlie, R. Stafford, T. Thom, S. Wasserthiel-Smoller, N. D. Wong, J. Wylie-Rosett and A. H. A. S. C. Stroke, Circulation, 2010, 121, E46–E215 CrossRef PubMed.
- P. A. Heidenreich, J. G. Trogdon, O. A. Khavjou, J. Butler, K. Dracup, M. D. Ezekowitz, E. A. Finkelstein, Y. L. Hong, S. C. Johnston, A. Khera, D. M. Lloyd-Jones, S. A. Nelson, G. Nichol, D. Orenstein, P. W. F. Wilson, Y. J. Woo, A. H. A. A. Coordina, S. Council, C. C. R. Inter, C. C. Cardiology, C. E. Prevention, C. A. Thrombosi, C. C. C. C. C. C. Nursing, C. K. C. Dis, C. C. S. Anesthe and I. C. Quality, Circulation, 2011, 123, 933–944 CrossRef PubMed.
- P. Qi, M. F. Maitz and N. Huang, Surf. Coat. Technol., 2013, 233, 80–90 CrossRef CAS PubMed.
- A. V. Finn, G. Nakazawa, M. Joner, F. D. Kolodgie, E. K. Mont, H. K. Gold and R. Virmani, Arterioscler., Thromb., Vasc. Biol., 2007, 27, 1500–1510 CrossRef CAS PubMed.
- C. Loubeyre, M. C. Morice, T. Lefevre, J. F. Piechaud, Y. Louvard and P. Dumas, J. Am. Coll. Cardiol., 2002, 39, 15–21 CrossRef.
- M. Joner, A. V. Finn, A. Farb, E. K. Mont, F. D. Kolodgie, E. Ladich, R. Kutys, K. Skorija, H. K. Gold and R. Virmani, J. Am. Coll. Cardiol., 2006, 48, 193–202 CrossRef PubMed.
- D. E. Cutlip, D. S. Baim, K. K. L. Ho, J. J. Popma, A. J. Lansky, D. J. Cohen, J. P. Carrozza, M. S. Chauhan, O. Rodriguez and R. E. Kuntz, Circulation, 2001, 103, 1967–1971 CrossRef CAS.
- N. Kukreja, Y. Onuma, J. Daemen and P. W. Serruys, Pharmacol. Res., 2008, 57, 171–180 CrossRef CAS PubMed.
- D. M. Martin and F. J. Boyle, Med. Eng. Phys., 2011, 33, 148–163 CrossRef PubMed.
- M. C. Chen, Y. Chang, C. T. Liu, W. Y. Lai, S. F. Peng, Y. W. Hung, H. W. Tsai and H. W. Sung, Biomaterials, 2009, 30, 79–88 CrossRef CAS PubMed.
- A. V. Finn, M. Joner, G. Nakazawa, F. Kolodgie, J. Newell, M. C. John, H. K. Gold and R. Virmani, Circulation, 2007, 115, 2435–2441 CrossRef PubMed.
- Y. Wei, Y. Ji, L.-L. Xiao, Q.-k. Lin, J.-p. Xu, K.-f. Ren and J. Ji, Biomaterials, 2013, 34, 2588–2599 CrossRef CAS PubMed.
- C.-T. Ho, Q. Chen, H. Shi, K.-Q. Zhang and R. T. Rosen, Prev. Med., 1992, 21, 520–525 CrossRef CAS.
- M. Inoue, R. Suzuki, N. Sakaguchi, Z. Li, T. Takeda, Y. Ogihara, B. Y. Jiang and Y. J. Chen, Biol. Pharmacol. Bull., 1995, 18, 1526–1530 CAS.
- K. Nakamura, Y. Yamada, H. Ikai, T. Kanno, K. Sasaki and Y. Niwano, J. Agric. Food Chem., 2012, 60, 10048–10054 CrossRef CAS PubMed.
- J. M. Kratz, C. R. Andrighetti-Frohner, P. C. Leal, R. J. Nunes, R. A. Yunes, E. Trybala, T. Bergstorm, C. R. Barardi and C. M. Simoes, Biol. Pharm. Bull., 2008, 31, 903–907 CAS.
- S.-H. Kim, C.-D. Jun, K. Suk, B.-J. Choi, H. Lim, S. Park, S. H. Lee, H.-Y. Shin, D.-K. Kim and T.-Y. Shin, Toxicol. Sci., 2006, 91, 123–131 CrossRef CAS PubMed.
- V. Stangl, H. Dreger, K. Stangl and M. Lorenz, Cardiovasc. Res., 2007, 73, 348–358 CrossRef CAS PubMed.
- C. Locatelli, F. B. Filippin-Monteiro and T. B. Creczynski-Pasa, Eur. J. Med. Chem., 2013, 60, 233–239 CrossRef CAS PubMed.
- K. Yoshioka, T. Kataoka, T. Hayashi, M. Hasegawa, Y. Ishi and H. Hibasami, Oncol. Rep., 2000, 7, 1221–1223 CAS.
- C. A. van der Heijden, P. J. C. M. Janssen and J. J. T. W. A. Strik, Food Chem. Toxicol., 1986, 24, 1067–1070 CrossRef CAS.
- X. B. Qiu, G. Takemura, M. Koshiji, Y. Hayakawa, M. Kanoh, R. Maruyama, Y. Ohno, S. Minatoguchi, S. Akao, K. Fukuda, T. Fujiwara and H. Fujiwara, Heart Vessels, 2000, 15, 90–99 CrossRef CAS.
- Y. Lu, F. Jiang, H. Jiang, K. Wu, X. Zheng, Y. Cai, M. Katakowski, M. Chopp and S.-S. T. To, Eur. J. Pharmacol., 2010, 641, 102–107 CrossRef CAS PubMed.
- R. F. Luo, L. L. Tang, S. Zhong, Z. L. Yang, J. Wang, Y. J. Weng, Q. F. Tu, C. X. Jiang and N. Huang, ACS Appl. Mater. Interfaces, 2013, 5, 1704–1714 CAS.
- F. Rossi, T. Casalini, E. Raffa, M. Masi and G. Perale, Mol. Pharm., 2012, 9, 1898–1910 CrossRef CAS PubMed.
- G. Mani, M. D. Feldman, D. Patel and C. M. Agrawal, Biomaterials, 2007, 28, 1689–1710 CrossRef CAS PubMed.
- T. Zou, S. X. Cheng, X. Z. Zhang and R. X. Zhuo, J. Biomed. Mater. Res., Part B, 2007, 82, 400–407 CrossRef PubMed.
- D. Hofmann, M. Entrialgo-Castaño, K. Kratz and A. Lendlein, Adv. Mater., 2009, 21, 3237–3245 CrossRef CAS PubMed.
- M. S. Taylor, A. U. Daniels, K. P. Andriano and J. Heller, J. Appl. Biomater., 1994, 5, 151–157 CrossRef CAS PubMed.
- S. L. Ishaug-Riley, L. E. Okun, G. Prado, M. A. Applegate and A. Ratcliffe, Biomaterials, 1999, 20, 2245–2256 CrossRef CAS.
- J. Wang, Y. He, M. F. Maitz, B. Collins, K. Xiong, L. Guo, Y. Yun, G. Wan and N. Huang, Acta Biomater., 2013, 9, 8678–8689 CrossRef CAS PubMed.
- A. C. Leeuwen, T. G. Kooten, D. W. Grijpma and R. R. M. Bos, J. Mater. Sci.: Mater. Med., 2012, 23, 1951–1959 CrossRef CAS PubMed.
- Z. Zhang, R. Kuijer, S. K. Bulstra, D. W. Grijpma and J. Feijen, Biomaterials, 2006, 27, 1741–1748 CrossRef CAS PubMed.
- O. S. Kluin, H. C. van der Mei, H. J. Busscher and D. Neut, Biomaterials, 2009, 30, 4738–4742 CrossRef CAS PubMed.
- R. Hou, L. Wu, J. Wang and N. Huang, Appl. Surf. Sci., 2010, 256, 5000–5005 CrossRef CAS PubMed.
- Y. Song, J. W. H. Wennink, M. M. J. Kamphuis, L. M. T. Sterk, I. Vermes, A. A. Poot, J. Feijen and D. W. Grijpma, Tissue Eng., Part A, 2011, 17, 381–387 CrossRef CAS PubMed.
- Z. Yang, Q. Tu, M. F. Maitz, S. Zhou, J. Wang and N. Huang, Biomaterials, 2012, 33, 7959–7971 CrossRef CAS PubMed.
- A. Michiardi, C. Aparicio, B. D. Ratner, J. A. Planell and J. Gil, Biomaterials, 2007, 28, 586–594 CrossRef CAS PubMed.
| This journal is © The Royal Society of Chemistry 2014 |

