Silver nanocrystals with special shapes: controlled synthesis and their surface-enhanced Raman scattering properties
Mingli
Yan
*ab,
Yanci
Xiang
b,
Lili
Liu
b,
Liyuan
Chai
a,
Xibin
Li
a and
Tao
Feng
*ab
aSchool of Resources Safety and Engineering, Central South University, Changsha, 410083, PR China. E-mail: ymljack@126.com; tfeng@hnust.edu.cn; Fax: +86-731-58290500; Tel: +86-731-58290500
bSchool of Biology, Hunan University of Science and Technology, Xiangtan 411201, PR China
First published on 5th November 2013
Abstract
Silver (Ag) nanoparticles with dendritic, urchin-like, flower-like and sphere-like shapes were controllably synthesized in aqueous hydrogen fluoride (HF) solution at room temperature. The shape of the Ag nanoparticles can be tuned from dendritic to urchin-like, flower-like and sphere-like by increasing the concentration of polyvinyl pyrrolidone (PVP, MW = 55![[thin space (1/6-em)]](https://www.rsc.org/images/entities/char_2009.gif) 000) from 2 to 11 mM. As-synthesized Ag nanostructures were characterized by transmission electron microscopy (TEM), high-resolution transmission electron microscopy (HRTEM), field emission scanning electron microscopy (FESEM), energy-dispersive X-ray (EDX), and X-ray diffraction (XRD). The morphology-dependent surface-enhanced Raman scattering (SERS) of the as-synthesized Ag nanostructures was investigated. The results indicated that flower-like Ag nanostructure had higher SERS activity than other Ag nanostructures for 4-mercaptobenzoic acid (4-MBA) probe molecules. Moreover, the resultant substrate can be applied in the label-free detection of DNA with a sensitivity limit as low as 50 nM.
000) from 2 to 11 mM. As-synthesized Ag nanostructures were characterized by transmission electron microscopy (TEM), high-resolution transmission electron microscopy (HRTEM), field emission scanning electron microscopy (FESEM), energy-dispersive X-ray (EDX), and X-ray diffraction (XRD). The morphology-dependent surface-enhanced Raman scattering (SERS) of the as-synthesized Ag nanostructures was investigated. The results indicated that flower-like Ag nanostructure had higher SERS activity than other Ag nanostructures for 4-mercaptobenzoic acid (4-MBA) probe molecules. Moreover, the resultant substrate can be applied in the label-free detection of DNA with a sensitivity limit as low as 50 nM.
1. Introduction
Rational design and fabrication of noble metal nanostructures with a tunable dimension and structural complexity is a promising strategy to tailor their physical and/or chemical properties for various applications in fields such as biological labeling and imaging,1,2 catalysis,3,4 information technology,5,6 sensing,7,8 and surface-enhanced Raman scattering (SERS).9,10 For example, tetrahexahedral Pt nanocrystals enclosed by 24 high-index faces exhibit considerably enhanced catalytic activity, compared with Pt nanospheres and carbon-supported Pt catalyst.11 Experimental observations and theoretical calculations also indicate that anisotropic noble metal nanostructures exhibit shape-dependent optical properties.12–16 A typical example is that triangular Ag nanoplates show three surface plasmon resonance (SPR) bands corresponding to dipole and quadrupole plasmon resonance, and but only one SPR band is observed for spherical Ag nanoparticles.12,13 High SERS intensity enhancement can be observed for the noble metal nanostructures with complex shapes.17,18 Importantly, shape control shows a greater versatility for tuning the properties of the noble metal nanostructures than that can be achieved otherwise. Despite the importance in theoretical studies and practical applications, the development of an effective approach for systematic manipulation of the shape of metal nanostructures remains of interest and a challenge.SERS has attracted extensive attention because of its extremely high surface sensitivity since Fleischmann and his co-workers reported for the first time a surface Raman spectrum from pyridine adsorbed on an electrochemically roughened silver electrode in 1974.19 It is well-known that SERS enhancement generally consists of chemical enhancement (∼102) and electromagnetic (EM) enhancement (104–1012).20,21 When a laser is applied to the surface of metal nanoparticles, their surface plasmon excitation generates a gigantic EM field at the surface of the particles, which largely enhances the Raman signals of the surface-adsorbed molecules.22 In experiments, the material and its morphology have been found to be the most crucial factors for highly sensitive SERS-active substrates.16,23,24 Nanostructures of Cu, Ag, Au, Pt and Pd were discovered to provide good enhancements for SERS experiments.25–32 The examples also included nanostructures of nanopores, nanogaps, nanoflowers, nanoparticle aggregates, nanowires, and nanorods. In the vicinity of these unique nanostructures, SERS “hot spots” were created from gaps, pores, tips and edges of the nanoparticles when appropriate excitation wavelengths were used. Since the amounts of “hot spots” affect the SERS performance proportionally, all SERS-active substrates are designed to have high local electrical field enhancement and high amounts of hot spots.33,34 Many of them are created by a semiconductor manufacturing process, such as electron beam lithography.35,36 The advantages of the process are that uniform product morphology and reproducible fabrications can be achieved. However these techniques are associated with limitations regarding throughput, cost, and processable materials. Moreover, it is still difficult to fabricate well-controlled small gaps or complex geometries on the scale of a few nanometers to create efficient and abundant “hot spots”.
The electroless deposition process is a simple and inexpensive method often used for depositing a uniformly dense noble metal membrane on an arbitrary geometry metal substrates such as Sn, Zn, Cu, Si and Ge.37,38 On the other hand, electroless deposition of noble metals on Si substrate provides a convenient and cheap route for fabricating SERS substrate, which needs no post-treatments such as collection and redispersion of noble metal nanoparticles. Up to now, there are only few reports on the preparation of noble metal nanostructures with various morphologies on Si substrate using the electroless deposition technique.39–42 In this study, based on electroless deposition process, we successfully prepared three-dimensional Ag nanostructures, such as simple dendrites that have a fractal structure consisting of several generations of branches with lengths up to a few micrometers, and flowers that consists of many nanosheets. In these syntheses, only commercial Si wafer was used as reducing agent to react with AgNO3 in hydrogen fluoride (HF) aqueous solution at room temperature. The resulting Ag nanostructures can server as a good SERS substrates because the hierarchical structure could supply more “hot spots” when used as SERS substrates, and exhibit a strong SERS enhancement effect, which enables the detection of 4-mercaptobenzoic acid (4-MBA) at a low concentration of 1.0 × 10⁻⁸ M. The resultant substrates were further investigated as a sensor for the sensitive detection of label-free DNA.
2. Experimental
The typical preparation of Ag nanostructures was carried out as follows. AgNO3 was dissolved in aqueous HF solution (4.8 M) at room temperature to form a homogeneous solution. The concentration of AgNO3 was controlled in the range of 0.1–0.5 mM. The commercial Si wafer (about 1.0 × 1.0 cm2) was washed with water and acetone, and then etched with 5.0% HF aqueous solution for 3 min at room temperature to obtain fresh Si surface. The Si wafer was immediately placed into the above solution (20 ml) containing HF and AgNO3, which was kept still for 10 min under atmosphere ambient. After reaction, the sample together with the Si wafer was removed from the reaction solution, rinsed with de-ionized water 3–5 times to remove contamination from the sample surface, and then dried under ambient conditions. In addition, the products were also synthesized in the presence of polyvinyl pyrrolidone (PVP) in order to investigate the effect of PVP on the morphology of Ag nanoparticles.The morphology and structure of the products were characterized with field emission scanning electron microscopy (SEM, Philips XL 30 FEG), transmission electron microscopy (TEM; Philips, CM20 working at 200 kV working at 200 kV), and high-resolution transmission electron microscopy (HRTEM; CM200 FEG operated at 200 kV) and X-ray diffraction (XRD, Philips PW 1830 with Cu Ka radiation and a normal 2 h scan, 40 kV, 30 mA). For TEM and HRTEM characterization, Ag nanoparticles were firstly collected from Si substrate, followed by redispersion in ethanol and deposition on copper grids coated by a carbon membrane. Ultraviolet-visible (UV-vis) spectra were recorded on an Aglient 8453 UV-vis Diode Array spectrophotometer. For UV-vis scan measurement, Ag nanoparticles were also collected and re-dispersed in ethanol. Raman measurements were conducted with a Renishaw 2000 laser Raman microscope equipped with a 633 nm laser of 2 μm spot size in diameter for excitation. All the spectra were acquired for 10 s with the laser power measured at the sample being 2.5 mW. 4-Mercaptobenzoic acid (4-MBA) was used as reporter probe as SERS measurement. Loading probe molecules onto Ag nanoparticles was accomplished by dropping 40 μL sample solutions onto the as-prepared substrate (0.5 cm × 0.5 cm) and dried naturally. The experimental procedure for the immobilization of DNA was as follows: the as prepared substrates were first immersed in DNA solutions of different concentrations for 12 h at room temperature. Phosphate buffered saline (PBS) solution was then added in batches to reach a final concentration of 0.1 mM within 4 h, and the resulting solutions were shaken for 2 h. Finally, the substrates were taken out and washed carefully with de-ionized water, followed by drying in a N2 flow.
3. Results and discussions
Metal deposition on Si substrate from aqueous HF solution can be initiated by electrochemical reduction of metal ions, a process which is driven by the difference between the electron quasi Fermi energy in Si and the redox energy level of the metallic ions in solution. The detailed information of the mechanism of the electroless metal deposition on Si substrate has been reported previously.38,43 For Ag, the standard reduction potential of the Ag+/Ag pair (0.80 V versus the standard hydrogen electrode or SHE) is higher than that of Si4+/Si (−1.2 V versus SHE), so the reaction occurred as follows:| 4Ag+ (aq) + Si0 (s) + 6F− (aq) → 4Ag(s) + SiF62− (aq) |
The morphology and structure of the Ag nanoparticles were characterized using SEM and TEM. Fig. 1a shows a large number of Ag dendrites with an almost uniform distribution. The Ag dendrites are very reproducible and possess remarkable hierarchical structure sprawling to several generations with apparent self-similarity. As shown in Fig. 1b, an Ag dendrite consists of a long main trunk with short side branches decorated fully by small rods. The diameter of the trunk is in the range of 100–200 nm and the length of the trunk is up to tens of micrometers. The length of the branch can reach 5 μm. The angle between the trunk and each of the branches is almost the same at ∼60°, which indicates that the Ag dendrites grow along a preferential direction. The HRTEM image of the side branches of the trunk is shown in Fig. 1c. The lattice spacing of 0.24 nm corresponds to the interplanar distance of the (111) planes of cubic Ag. It also can be seen that the branches have same growth direction. This implies that the dendritic branches grow along a preferential direction. In the preparation of dendritic Ag nanostructure, different concentrations of AgNO3 solutions were used to investigate the concentration effects on the morphology of the final products. It was found that the AgNO3 concentration has little influence on the size and shape of dendritic Ag nanostructure.
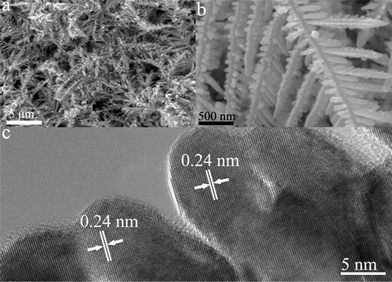 | ||
| Fig. 1 (a–b) SEM images and (c) HRTEM image of Ag dendrites synthesized with 0.5 mM AgNO3 by 10 min reaction. | ||
PVP have been widely used as functional capping ligand or structure-directing agent in the synthesis of nanoparticles of various sizes and shapes.44 Here, we also used PVP to modify the morphology of Ag nanoparticles. Fig. 2a and b show the typical SEM images of Ag nanoparticles prepared with 0.5 mM AgNO3 in the presence of PVP (7 mM) for 10 min reaction. The SEM image obtained at low-magnification shows flower-like nanostructure with sizes of 0.5–1.3 μm have formed on a large scale (Fig. 2a). The magnified image shows that the as-synthesized Ag architecture consists of many nanosheets (shown in Fig. 2b). The building blocks of the flower-like nanostructure, i.e., nanosheets, have a thickness about 20 nm. A TEM investigation was carried out in order to study the crystal structure of the Ag flowers. The high-magnification TEM image taken at the edge of a flower is shown in Fig. 2c. It can be seen that the flower consists of a lot of nanosheets. The results are consistent with those observed under SEM investigation. The HRTEM image of a nanosheet at the edge of the flower shows the continuous lattice fringes in the visible range, indicating its single crystalline nature (shown in Fig. 2d). The lattice spacing of 0.24 nm corresponds to the interplanar distance of the (111) planes of cubic Ag.
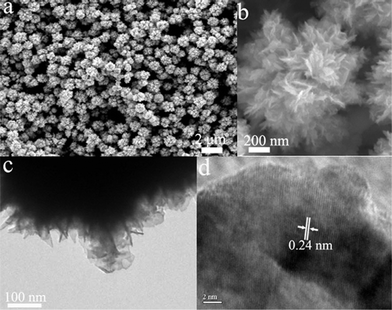 | ||
| Fig. 2 SEM and HRTEM images of flower-like Ag nanoparticles synthesized with 0.5 mM AgNO3 in the presence of PVP (7 mM). | ||
To understand the formation process of the flower-like Ag nanoparticles, the Ag nanoparticles obtained at different reaction times were characterized with SEM. Fig. 3 shows the SEM images of Ag nanoparticles prepared with 0.2 mM AgNO3 in the presence of PVP (7 mM) for various time intervals of 1, 3, 5 and 7 min. As shown in Fig. 3a, after 1 min reaction small irregular nanoparticles were obtained. Careful observation reveals that some shafts grown on the surfaces of the irregular Ag nanoparticles. When the reaction time was 3 min, urchin-like nanoparticles were formed (Fig. 3b). After 5 min reaction, the flower-like morphology gradually developed, and by 7 min reaction a well-defined flower-like morphology was achieved (Fig. 3c and d).
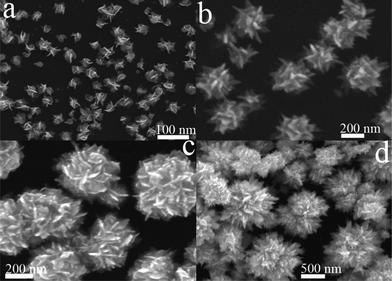 | ||
| Fig. 3 SEM images of Ag nanoparticles prepared with 0.2 mM AgNO3 in the presence of PVP (7 mM) for: (a) 1, (b) 3, (c) 5, and (d) 7 min reaction. | ||
PVP concentration plays an important role in regulating the morphological structures of the resulting Ag flowers. To reveal the relationship between the morphology and the PVP concentration, we carried out the following experiment by changing the PVP concentration from 2 to 11 mM. Changing the PVP concentration produced a large change on the Ag morphology. Fig. 4 shows the SEM images of the products prepared in the presence of PVP with different concentrations. At relatively low concentration of PVP (2 mM), the sample still possesses dendritic morphology (Fig. 4a and b). However, careful observation indicates that the side branches of the dendritic nanostructure are composed of nanoleaves rather than nanorods. Moreover, some flower-like nanostructures were formed on the branches. As the concentration of PVP was increased to 4 mM, urchin-like nanoparticles together with some dendrites were obtained (Fig. 4c). Fig. 4d shows the high magnification SEM image of the urchin-like Ag nanoparticles. It can be seen that the urchin-like nanostructure consists of many shafts with different length and width. The diameter of the urchin-like Ag nanoparticles is in the range of 0.5–1.0 μm. When the concentration of PVP was 7 mM, well-defined flower-like nanoparticles were obtained (Fig. 4e). When the concentration of PVP was further increased to 9 mM, the products also take on flower-like morphology (Fig. 4f and g). However, as-synthesized flower-like nanoparticles are composed of small and dense nanosheets. Further increasing the concentration of PVP (11 mM) resulted in the formation of sphere-like nanoparticles with wide size distribution (30–200 nm). These results indicate that PVP has a great effect on the morphology of the final products, and uniform flower-like microstructures with thin petal were obtained when PVP concentration was about 7 mM.
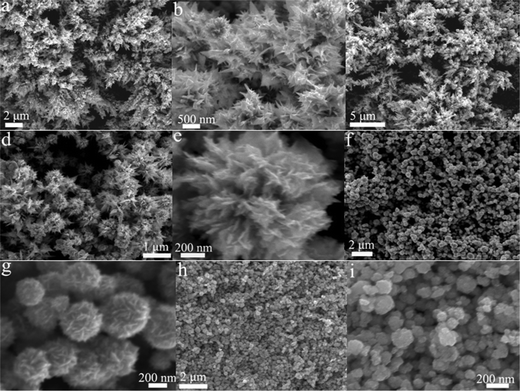 | ||
| Fig. 4 SEM images of Ag nanoparticles synthesized with 0.5 mM AgNO3 in the presence of PVP with different concentrations: (a and b) 2 mM, (c and d) 4 mM, (e) 7 mM, (f and g) 9 mM and (h and i) 11 mM. | ||
A mechanism based on slow, continuous nucleation and fast autocatalytic growth has previously been used to explain the growth of metallic nanoparticles, especially Pd and Pt dendrites.39,45,46 A related mechanism is proposed to explain the formation of the Ag dendrites and flowers in the present work. In this proposed process, Ag ions were slowly reduced forming Ag nanoclusters (seeds) on the Si substrate. Subsequently, the nanoclusters and the Si surface surrounding the nanoclusters acted as the local cathodes and anodes in an electrochemical redox reaction process.38,43 Then the Ag ions were reduced and deposited on the surface of the nanoclusters. Once the nanoclusters reached a certain size (about 500 atoms), the reduction of Ag ions and oxidation of Si were accelerated concurrently through an autocatalytic reduction process, which facilitated an anisotropic formation of dendritic shafts on the surface of nanoclusters and grew eventually into the dendrites.47 In the presence of PVP, PVP will selectively bind to {111} and {100} facets of Ag nanoparticles and affect the growth rates of different facets,48,49 which may results in the growth of the flower-like Ag nanoparticles with thin petal. This mode of formation might explain the growth mechanism of dendritic and flower-like Ag nanostructures. However, the detailed formation mechanism of Ag nanostructures in this synthesis is not very clear at the present time and needs further investigation.
The phase and purity of the as-prepared dendritic and flower-like Ag nanostructures were further determined from the XRD patterns (Fig. 5A). Each pattern exhibits three diffraction peaks in the range of 27° < 2θ < 67° that can be indexed to diffraction from the (111), (200) and (220) of the faced-centered cubic (fcc) crystalline structure of metallic Ag (JCPDS: 04-0783). No characteristic peaks of other compounds are observed, indicating the products produced thus are pure Ag. Moreover, the sharp diffraction peaks reveal that the as-prepared samples have a good crystallinity. After comparison we can find that the diffraction peaks of dendritic Ag nanoparticles are stronger than those of flower-like Ag nanoparticles. This may due to the relatively higher crystallinity of dendritic Ag nanoparticles. The chemical compositions of Ag nanoparticles were determined by energy dispersive X-ray (EDX) analysis of the samples deposited on the TEM grid. The EDX spectrum (Fig. 5B) shows the presence of the Ag element, in which the peaks of the corresponding Ag element were distinct (other peaks originated from the copper and carbon from the TEM grid).
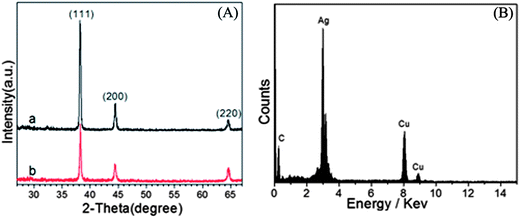 | ||
| Fig. 5 (A) XRD patterns of dendritic (a) and flower-like (b) Ag nanoparticles. (B) EDX spectrum of Ag dendrites. | ||
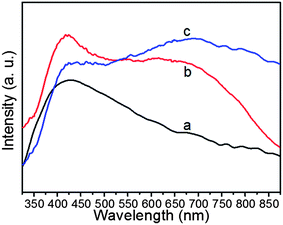
The optical properties of Ag nanoparticles are dependent on particle size and shape, and thus the changes in shape of the Ag nanoparticles should be reflected by their UV-vis extinction spectrum. Fig. 6 shows the UV-vis spectra of sphere-like, dendritic and flower-like Ag nanoparticles. The sphere-like Ag nanoparticles exhibit only one absorption band at about 410 nm, which is attributed to the surface plasmon resonance (SPR) of irregular Ag nanoparticles.50 The dendritic and flower-like Ag nanoparticles exhibit two absorbance bands: one is near 410 nm and the other broad absorbance band red-shifts with transformation of morphology from dendritic to flower-like, at 665 and 700 nm, respectively. The absorbance band at 410 nm is also attributed to the SPR band of monodisperse Ag nanoparticles, while the broad and strong absorption in a wide range of 500–850 nm due to the Mie plasmon resonance excitation from the silver nanoparticles.51 With transformation of morphology of the Ag nanostructures from dendritic to flower-like, the SPR absorption peaks become broader and stronger, and their maxima red-shift from 665 to 700 nm. These changes may be attributed to the strong dipole–dipole coupling between neighboring Ag nanosheets.52 Such dramatic change in SPR wavelength offers an excellent platform for the optical properties based biological, medical and SERS applications of these Ag nanostructures.
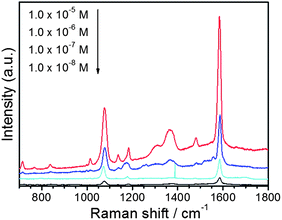
It has shown that SERS activity is strongly dependent on the size and shape of noble metal nanoparticles. Therefore, it would be interesting to examine the SERS activity of the as-synthesized dendritic, flower-like and sphere-like Ag nanoparticles. In the present study, we selected 4-MBA as the target molecule. 4-MBA, an organic molecule with a thiol group on one end and a carboxylic acid on the other end, usually has strong chemical interactions with metal surfaces. Fig. 7 shows the typical SERS spectra of 4-MBA adsorbed on Ag nanoparticles of different morphologies. The Raman spectrum of 4-MBA is dominated by the ν8a (∼1590 cm−1) and ν12 (∼1080 cm−1) aromatic ring vibrations; other weak bands at ∼1150 and ∼1180 cm−1 are attributed to the C–H deformation modes.33 As can be seen, the flower-like Ag nanostructure exhibits the highest SERS activity. The improved enhancement in SERS intensity may be attributed to the special structure of the flower-like Ag nanostructure. It can be seen from Fig. 2 that the flower-like Ag nanostructure consists of many nanosheets. Numerous gaps of small dimensions may be formed among the nanosheets. According to theoretical and experimental studies, the largest SERS enhancement usually occurs at the gaps between two metal nanoparticles, tips and edges of the particles.53,54 Recently, Ag and Au nanostructures of different morphologies was prepared and used as SERS substrates.30,55 It was found that the single Ag or Au nanostructure of different shapes exhibited different SERS signal intensity. The morphology dependence of SERS intensity was attributed to the different intraparticle gaps in these structures. In the present case, we suppose that the increased number of gaps in a single particle may also contribute to the improved SERS enhancement of the flower-like Ag nanostructure. Nevertheless, further experiments and theoretical calculations based on this subject are needed. Fig. 8 shows the SERS spectra of 4-MBA with various concentrations from1.0 × 10−8 to 1.0 × 10⁻⁵ M on flower-like Ag nanostructure. The Raman peaks remained clearly observable even if the concentration of melamine solution decreased to 1.0 × 10⁻⁸ M.
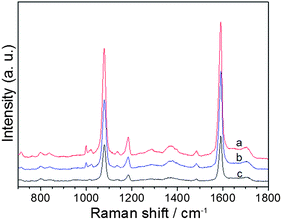 | ||
| Fig. 7 Typical SERS spectra of 1.0 × 10⁻⁵ M 4-MBA on (a) flower-like, (b) dendritic, and (c) sphere-like Ag nanoparticles. | ||
The SERS enhancement factor (EF) for 4-MBA adsorbed on flower-like, dendritic and sphere-like Ag nanoparticles was calculated according to the equation: EF = (ISERS/IRaman)(NRaman/NSERS), where ISERS and IRaman denote the integrated intensities for the 1590 cm−1 band of 4-MBA molecules under SERS and normal Raman conditions, respectively, whereas NSERS and NRaman represent the corresponding number of 4-MBA molecules excited by the laser beam. The normal Raman spectrum was collected from 4-MBA put on SiO2/Si substrate without Ag nanoparticles. This estimation is based on the assumption that molecules were uniformly dispersed in the region wet by the solution. Due to the number of adsorbed 4-MBA molecules is poorly defined and measured, quantification of the EF is not trivial and subject to assumption. Following the procedure and assumption described in other reports,54,55 the EF of the flower-like, dendritic and sphere-like Ag nanoparticles were evaluated to be on the order of 106.
As discussed above, the flower-like Ag nanoparticles are excellent candidates for SERS-based ultrasensitive molecular sensing. To demonstrate that they may find further applications in biosensors, we have examined one kind of single strand DNA (5′-TGAGTGGACGTCAACGAGCAA-SH-3′) as the target molecule. Recently, label-free DNA detection has attracted intense interest due to its simple and cheap manipulation. Significantly, our SERS substrate based on flower-like Ag nanoparticles is highly efficient for the detection of label-free DNA. Fig. 9 shows the SERS spectra of DNA with various concentrations from1.0 × 10−6 to 5.0 × 10⁻⁹ M. The most intense feature in the Raman spectrum appears at about 733 cm−1, and is assigned to the adenine breathing mode.56 It was found that the intensity of Raman signal at 733 cm−1 decreased strongly with decreasing concentration of DNA. Moreover, the DNA featured peak at 733 cm−1 persisted in the SERS spectra even if the concentration of DNA solution decreased to 5.0 × 10⁻⁹ M (Fig. 9d). These results indicate that the flower-like Ag nanoparticles used as a SERS-based ultrasensitive sensor are suitable for sensitive label-free DNA detection.
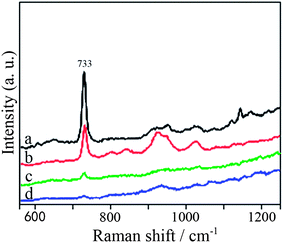 | ||
| Fig. 9 SERS spectra of melamine of various concentrations (a) 1.0 × 10⁻⁶ M, (b) 1.0 × 10⁻⁷ M, (c) 5.0 × 10⁻⁸ M, (d) 5.0 × 10⁻⁹ M on flower-like Ag nanostructure. | ||
4. Conclusions
Ag nanoparticles with various morphologies were successfully synthesized by electroless deposition method on silicon substrate in aqueous HF solution at room temperature. The morphology of the Ag nanoparticles can be tuned by using PVP or different PVP concentration. This simple method can be extended to preparing other noble metal nanoparticles with various morphologies. Raman analyses showed that the dendritic and flower-like Ag nanostructures are good SERS-active substrates. The flower-like Ag nanoparticles are made of staggered nanosheets, and have more gaps, tips and edges than the dendritic nanoparticles. Therefore flower-like Ag nanostructure had a higher SERS activity than dendritic particle for 4-MBA probe molecules. The substrate based on flower-like Ag nanostructure was also found application in label-free DNA detection, and different concentrations of DNA as target molecules were examined. These results indicate that the obtained Ag nanostructure together Si substrate can be used as a promising sensor for the detection of trace amount of chemical and biochemical analytes.Acknowledgements
This work was supported by the Postdoctoral Science Foundation of Central South University (no. 20121017), the Scientific Research Fund of Hunan Provincial Science and Technology Department (Grant no. 2013RS4032), the environmental protection science and technology project of Hunan Province (no. 2012-347).References
- J. Zheng and R. M. Dickson, J. Am. Chem. Soc., 2002, 124, 13982 CrossRef CAS PubMed.
- X. Liu, F. Wang, A. Niazov-Elkan, W. Guo and I. Willner, Nano Lett., 2013, 13, 309 CrossRef CAS PubMed.
- D. S. Wang and Y. D. Li, Prog. Chem., 2013, 25, 1 CAS.
- D. S. Wang and Y. D. Li, Adv. Mater., 2011, 23, 1044 CrossRef CAS PubMed.
- S. H. Sun, C. B. Murray, D. Weller, L. Folks and A. Moser, Science, 2000, 287, 1989 CrossRef CAS PubMed.
- L. A. Peyser, A. E. Vinson, A. P. Bartko and R. M. Dickson, Science, 2001, 291, 103 CrossRef CAS PubMed.
- F. Favier, E. C. Walter, M. P. Zach, T. Benter and R. M. Penner, Science, 2001, 293, 2227 CrossRef CAS PubMed.
- A. Tao, F. Kim, C. Hess, J. Goldberger, R. G. He, Y. G. Sun, Y. N. Xia and P. D. Yang, Nano Lett., 2003, 3, 1229 CrossRef CAS.
- S. M. Nie and S. R. Emory, Science, 1997, 275, 1102 CrossRef CAS PubMed.
- R. H. Que, M. W. Shao, S. J. Zhuo, C. Y. Wen, S. D. Wang and S. T. Lee, Adv. Mater., 2011, 21, 3337 CAS.
- N. Tian, Z. Y. Zhou, S. G. Sun, Y. Ding and Z. L. Wang, Science, 2007, 316, 732 CrossRef CAS PubMed.
- R. C. Jin, Y. W. Cao, C. A. Mirkin, K. L. Kelly, G. C. Schatz and J. G. Zheng, Science, 2001, 294, 1901 CrossRef CAS PubMed.
- N. C. Bigall, T. Härtling, M. Klose, P. Simon, L. M. Eng and A. Eychmüller, Nano Lett., 2008, 8, 4588 CrossRef CAS PubMed.
- K. L. Kelly, E. Coronado, L. L. Zhao and G. C. Schatz, J. Phys. Chem. B, 2003, 107, 668 CrossRef CAS.
- K. S. Lee and M. A. El-Sayed, J. Phys. Chem. B, 2005, 109, 20331 CrossRef CAS PubMed.
- M. Mulvihill, A. Tao, K. Benjauthrit, J. Arnold and P. D. Yang, Angew. Chem., Int. Ed., 2008, 47, 6456 CrossRef CAS PubMed.
- L. H. Lu, I. Randjelovic, R. Capek, N. Gaponik, J. H. Yang, H. J. Zhang and A. Eychmuller, Chem. Mater., 2005, 17, 5731 CrossRef CAS.
- L. H. Lu, A. Eychmuller, A. Kobayashi, Y. Hirano, K. Yoshida, Y. Kikkawa, K. Tawa and Y. Ozaki, Langmuir, 2006, 22, 2605 CrossRef CAS PubMed.
- M. Fleischmann, P. J. Hendra and A. McQuillan, J. Chem. Phys. Lett., 1974, 26, 163 CrossRef CAS.
- K. Kneipp, H. Kneipp, I. Itzkan, R. R. Dasari and M. S. Feld, Chem. Rev., 1999, 99, 2957 CrossRef CAS PubMed.
- Z. Q. Tian, B. Ren and D. Y. Wu, J. Phys. Chem. B, 2002, 106, 9463 CrossRef CAS.
- J. F. Li, Y. F. Huang, Y. Ding, Z. L. Yang, S. B. Li, X. S. Zhou, F. R. Fan, W. Zhang, Z. Y. Zhou, D. Y. Wu, B. Ren, Z. L. Wang and Z. Q. Tian, Nature, 2010, 464, 392 CrossRef CAS PubMed.
- S. J. Lee, A. R. Morrill and M. Moskovits, J. Am. Chem. Soc., 2006, 128, 2200 CrossRef CAS PubMed.
- Z. Q. Tian, Z. L. Yang, B. Ren, J. F. Li, Y. Zhang, X. F. Lin, J. W. Hu and D. Y. Wu, Faraday Discuss., 2006, 132, 159 RSC.
- L. Y. Chen, J. S. Yu, T. Fujita and M. W. Chen, Adv. Funct. Mater., 2009, 19, 1 Search PubMed.
- D. K. Lim, K. S. Jeon, H. M. Kim, J. M. Nam and Y. D. Suh, Nat. Mater., 2010, 9, 60 CrossRef CAS PubMed.
- H. Y. Liang, Z. P. Li, W. Z. Wang, Y. S. Wu and H. X. Xu, Adv. Mater., 2009, 21, 4614 CrossRef CAS.
- L. M. Chen and Y. N. Liu, ACS Appl. Mater. Interfaces, 2011, 3, 3091 CAS.
- L. M. Chen and Y. N. Liu, J. Raman Spectrosc., 2012, 43, 986 CrossRef CAS.
- J. X. Fang, S. Y. Du, S. Lebedkin, Z. Y. Li, R. Kruk, M. Kappes and H. Hahn, Nano Lett., 2010, 10, 5006 CrossRef CAS PubMed.
- J. Kumar and K. G. Thomas, J. Phys. Chem. Lett., 2011, 2, 610 CrossRef CAS.
- M. E. Abdelsalam, S. Mahajan, P. N. Bartlett, J. J. Baumberg and A. E. Russell, J. Am. Chem. Soc., 2007, 129, 7399 CrossRef CAS PubMed.
- S. Li, P. Xu, Z. Ren, B. Zhang, Y. Du, X. Han, N. H. Mack and H. L. Wang, ACS Appl. Mater. Interfaces, 2013, 5, 49 CAS.
- D. K. Lim, K. S. Jeon, J. H. Hwang, H. Kim, S. Kwon, Y. D. Suh and J. M. Nam, Nat. Nanotechnol., 2011, 6, 452 CrossRef CAS PubMed.
- F. S. Ou, M. Hu, I. Naumov, A. Kim, W. Wu, A. M. Bratkovsky, X. M. Li, R. S. Williams and Z. Y. Li, Nano Lett., 2011, 11, 2538 CrossRef CAS PubMed.
- X. Zhang, M. Theuring, Q. Song, W. D. Mao, M. Begliarbekov and S. Strauf, Nano Lett., 2011, 11, 2715 CrossRef CAS PubMed.
- L. A. Porter Jr, H. C. Choi, J. M. Schmeltzer, A. E. Ribbe, L. C. C. Elliott and J. M. Buriak, Nano Lett., 2002, 2, 1369 CrossRef.
- H. Q. Peng, Y. J. Yan, S. P. Gao and J. Zhu, Adv. Funct. Mater., 2003, 13, 127 CrossRef.
- L. M. Chen and Y. N. Liu, CrystEngComm, 2011, 13, 6481 RSC.
- L. M. Chen and Y. N. Liu, RSC Adv., 2013, 3, 4391 RSC.
- W. C. Ye, J. X. Liu, Q. Z. Liu, F. Zhou and W. M. Liu, Electrochim. Acta, 2010, 55, 8649 CrossRef CAS.
- W. C. Ye, C. M. Shen, J. F. Tian, C. M. Wang, C. Hui and H. J. Gao, Solid State Sci., 2009, 11, 1088 CrossRef CAS.
- G. V. Kuznetsov, V. A. Skryshevsky, T. A. Vdovenkova, A. I. Tsyganova, P. Gorostiza and F. Sanzb, J. Electrochem. Soc., 2001, 148, 528 CrossRef.
- J. W. Wang, X. Wang, Q. Peng and Y. D. Li, Inorg. Chem., 2004, 43, 7552 CrossRef CAS PubMed.
- Y. J. Xiong, I. Washio, J. Y. Chen, H. G. Cai, Z. Y. Li and Y. N. Xia, Langmuir, 2006, 22, 8563 CrossRef CAS PubMed.
- L. Wang and Y. Yamauchi, Chem. Mater., 2009, 21, 3562 CrossRef CAS.
- J. Y. Chen, T. Herricks, M. Geissler and Y. N. Xia, J. Am. Chem. Soc., 2004, 126, 10854 CrossRef CAS PubMed.
- Y. J. Xiong and Y. N. Xia, Adv. Mater., 2007, 19, 3177 CrossRef.
- Y. J. Xiong, B. Wiley, J. Y. Chen, Z. Y. Li, Y. D. Yin and Y. N. Xia, Angew. Chem., Int. Ed., 2005, 44, 7913 CrossRef CAS PubMed.
- U. Kreibig and M. Vollmer, Optical Properties of Metal Cluster, Springer, Berlin, 1995 Search PubMed.
- C. F. Bohren and D. R. Huffman, Absorption and Scattering of Light by Small Particles, John Wiley & Sons, Chichester, U.K., 1983 Search PubMed.
- W. Wang and S. A. Asher, J. Am. Chem. Soc., 2001, 123, 12528 CrossRef CAS PubMed.
- Y. Wang, H. Chen, S. Dong and E. Wang, J. Raman Spectrosc., 2007, 38, 515 CrossRef CAS.
- V. A. Markel, V. M. Shalaev, P. Zhang, W. Huynh, L. Tay, T. Haslett and M. Moskovits, Phys. Rev. B: Condens. Matter Mater. Phys., 1999, 59, 10903 CrossRef CAS.
- M. J. Mulvihill, X. Y. Ling, J. Henzie and P. D. Yang, J. Am. Chem. Soc., 2010, 132, 268 CrossRef CAS PubMed.
- A. Barhoumi and N. J. Halas, J. Am. Chem. Soc., 2010, 132, 12792 CrossRef CAS PubMed.
| This journal is © The Royal Society of Chemistry 2014 |

