Enhancement of anti-leukemic potential of 2-hydroxyphenyl-azo-2′-naphthol (HPAN) on MOLT-4 cells through conjugation with Cu(II)†
Tathagata Deb‡
a,
Priya Kalyan Gopal§
b,
Durba Ganguly§a,
Piyal Dasa,
Mausumi Paulc,
Manju Bikash Saha¶
a,
Santanu Paul*b and
Saurabh Das*a
aDepartment of Chemistry (Inorganic Section), Jadavpur University, Kolkata 700 032, India. E-mail: dasrsv@yahoo.in; Fax: +91 33 24146223; Tel: +91 8902087756
bLaboratory of Experimental Immunology, Department of Microbiology and Botany, Gurudas College, Kolkata 700 054, India. E-mail: spaul_1971@yahoo.com; Fax: +91 33 23546623; Tel: +91 9874192648
cDepartment of Chemistry, Indian Institute of Chemical Biology, Kolkata 700 032, India
First published on 28th March 2014
Abstract
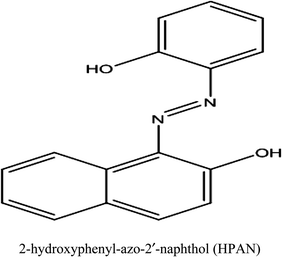
A Cu(II) complex of 2-hydroxyphenyl-azo-2′-naphthol (HPAN) having the formula CuII(HPAN)2 was characterized by different techniques. When HPAN and CuII(HPAN)2 were incubated for 24 hours with human T-acute lymphoblastic leukemia (MOLT-4) cells, almost no activity was observed for HPAN while the complex was active. When incubated for 48 hours, HPAN showed cell death of ∼35% at a concentration of 40 μM while CuII(HPAN)2 was only slightly better than when incubated for 24 hours. Therefore, irrespective of incubation time, the anti-proliferative activity due to CuII(HPAN)2 was similar. However, increase in incubation time did show increased activity for HPAN. Anti-leukemic potential was confirmed by microscopic analysis of cell viability by trypan blue stain and MTT assay. The BrdU assay further confirmed proliferative effects of aqueous Cu(II)/HPAN and anti-proliferative effects of Cu(II)(HPAN)2. Propidium iodide staining of Cu(II)(HPAN)2-treated MOLT-4 cells confirmed apoptosis. Since amines formed as a consequence of reduction of the azo bond are reported to be cytotoxic, we performed an enzyme assay to understand the relative reduction of the azo bond in both compounds. Results suggest reduction of the azo bond was slightly higher for HPAN. DNA binding of CuII(HPAN)2 using fluorescence spectroscopy was compared with that of HPAN to determine the propensity of biological activity. The results being similar, binding of the compounds with DNA and the ease of reduction of the azo bond were not able to explain why CuII(HPAN)2 was better in preventing cell proliferation. The high anti-proliferative activity of CuII(HPAN)2 was attributed to increased cellular uptake. We designed experiments to support this hypothesis using independent approaches. In one, Cu(II) was identified in cell lysates using ferrocyanide, while, in another, CuII(HPAN)2 was detected using flow cytometry. We chose Cu(II) as the metal ion for this work because of its recognized involvement in cancer. Being essential for angiogenesis, it is found in increased levels in cancer cells. Interaction of Cu(II)(aq) with MOLT-4 cells confirmed this as a part of this study also. Hence, our objective was to see if molecules like HPAN that bind Cu(II) could lead to its role reversal, i.e. from supporting the growth of cancer cells to be able to destroy them as CuII(HPAN)2.
1. Introduction
Acute lymphoblastic leukemia (ALL) is a malignant disorder occurring from clonal expansion of malignant lymphoid progenitor cells of either T- or B-cell origin. ALL is the most common type of childhood cancer, a heterogeneous disease in which many genetic lesions result in the development of multiple biologic subtypes.1–3 An appreciable cure rate of 80% has been observed for patients suffering with childhood ALL monitored over a span of five years.4,5 A high relapse rate was observed 5 years post-therapy leading to the death of patients.6 Since ALL is mainly an adolescent disease, a post-treatment survival span of five years is really insignificant compared to the normal life span of an individual and has little relevance in clinical outcome. The current therapeutic regimens prove insufficient to combat ALL and there is an increased need to incorporate specific, tailor-made effective new agents that is an open area for researchers. An important trend in ALL drug development is to search for molecules that are fast acting, effective at low concentrations, target-specific and display fewest side effects.Metal-based anticancer compounds have played an important role in antiblastic chemotherapy.7,8 Based on the hypothesis that metal ions naturally occurring in biological systems would be less toxic to healthy cells, research and development related to design of metal-based anticancer agents has seen an upsurge in recent years.9–11 This could overcome shortcomings of established drugs like cisplatin and help to improve the activity spectrum. Copper complexes have been particularly important in this regard.7,9,12,13 Copper is a biologically essential metal whose suboptimal levels during embryonic development negatively affect the brain, the heart, tissues such as the lung, skin and hair, and essential components of the skeletal, immune and blood systems.14–17 Importantly, copper is also an essential element required for angiogenesis12 and is found in increased levels in different forms of cancer.18,19 It was reported earlier that compounds with Cu binding ability, i.e. Cu-conjugates, have appreciable cellular uptake and show enhanced anticancer properties.20 Although conjugation with Cu improves cytotoxicity-inducing properties, the nature of the ligand dominates in most cases.21 Azo compounds with extensive industrial applications22–25 have also recently been reported as having biological activity in the form of anti-neoplastics, anti-diabetics, antiseptics, anti-inflammatories and agents for chemotherapy.26,27 Azo compounds are involved in processes like inhibition of DNA/RNA, protein synthesis to carcinogenesis; even in nitrogen fixation.28–32 In a recent study, we showed 2-hydroxyphenyl-azo-2′-naphthol (HPAN) was more cytotoxic on A549 lung carcinoma cells than normal peripheral blood mononuclear (PBM) cells, which encouraged us to explore the anti-leukemic potential of HPAN.33
Since literature reports suggested Cu(II) was responsible for crossing cellular barriers,34 findings with HPAN encouraged us to hypothesize conjugating HPAN with Cu(II) to form a Cu(II)-azo chelate that could enhance the cytotoxicity of HPAN on leukemic cells. The study is unique in the sense that it reports anti-leukemic activity associated with HPAN and shows that this activity is enhanced through conjugation with Cu(II), having minimal cytotoxic effect on normal cells. Studies with Cu(II)(aq) on the same cells, however, showed proliferation.
2. Experimental
2.1 Reagents
2-Aminophenol and 2-naphthol were used to prepare HPAN by diazotization followed by coupling at ∼0 °C to 5 °C.35 Copper nitrate (Cu(NO3)2·3H2O; E. Merck, India) was used as a source of Cu(II). Stock solutions of HPAN and the complex were prepared in DMSO (∼10−4 M). NADPH, required for enzyme assay, and calf thymus DNA were purchased from Sisco Research Laboratories, India. The DNA was dissolved in phosphate buffer prepared in triple distilled water and absorbance was recorded at 260 and 280 nm. The ratio of absorbance, A260/A280, was found to be 1.8 < A260/A280 > 1.9 indicating it was sufficiently free of protein. Concentration of DNA was determined in terms of nucleotide, taking the molar extinction coefficient at 260 nm as 6600 M−1 cm−1. To check the quality of DNA, the characteristic CD band at 260 nm was recorded. Solutions used to study DNA interaction contained 120 mM NaCl, 10 mM phosphate buffer (pH ∼ 7.4) and 100 μM HPAN or the complex. Sodium nitrate of analytical grade was used to maintain ionic strength during physicochemical experiments. Solutions were prepared in triple distilled water. A pH meter (Elico LI 613, India) was used.Cytochrome c reductase isolated from porcine heart was purchased from Sigma-Aldrich, USA. It was dissolved in triple distilled water. Enzyme activity of the stock solution was 1000 U L−1. 0.0045 g of NADPH (SRL, India) was dissolved in 1 ml triple distilled water.
2.2 Instruments used
Elemental analysis was carried out on a 2400 Series II CHN analyzer, Perkin Elmer. UV-Vis spectroscopy was performed on a JASCO V-630 spectrophotometer. FTIR spectra were recorded on a Perkin Elmer RX-I spectrophotometer using KBr pellets. Fluorescence experiments were performed on an LS-55 luminescence spectrophotometer. TG-DTA was done on a Mettler Toledo TGA/SDTA 851 thermal analyzer. Mass spectra were recorded on a Micromass Q-Tof micro™, Waters Corporation. Magnetic susceptibility measurements were carried out using a Sherwood Scientific magnetic susceptibility balance with Hg[Co(SCN)4] as calibrant. EPR spectra were recorded on a JEOL JES-FA 200 ESR spectrophotometer.2.3 Determination of the stoichiometry of the complex
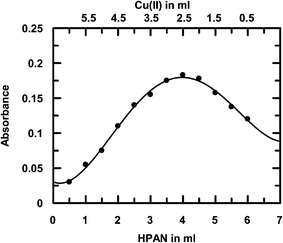
Complex formation of Cu(II) with HPAN was followed by UV-Vis spectroscopy. Stoichiometry was determined by mole ratio and Job's method of continuous variation. Cu(II) from a stock solution (∼10−4 M) was added to a solution of HPAN (∼10−4 M) at neutral pH (∼6.8–7.4) that resulted in a new peak at 520 nm. This was considered for evaluation of stoichiometry.2.4 Preparation of the complex
An aqueous solution of Cu(NO3)2·3H2O (0.95 g in 100 ml water) was added to a solution of HPAN (2.1 g of HPAN in 100 ml methanol). The mixture was refluxed for 3.5 hours. A deep reddish brown color developed. 10% sodium acetate solution was added with constant stirring when a greenish black compound was formed. The precipitate was allowed to settle and later isolated after repeated washing with ∼1% ammonium chloride and hot water. The solid complex was dried and kept in a desiccator for further analysis. Yield: 75%. Anal. calc. (%) for C32H26N4O6Cu: C, 61.39; H, 4.15; N, 8.95. Found: C, 61.58; H, 4.19; N, 8.89. Cu(II) present in the complex was estimated using a standard procedure.36 Cu(II)(HPAN)2: IR (KBr, cm−1): 3422 (weak) ν(O–H), 1618, 1560, 1546 ν(–N![[double bond, length as m-dash]](https://www.rsc.org/images/entities/char_e001.gif) N–), 1340 ν(C–H), 1400 ν(C–N aromatic), 1450 ν(C–C aromatic), 748, 466, 438 ν(Cu–O). UV-Vis (λmax (nm), εmax (dm3 mol−1 cm−1), water): 521, 7.82 × 10³. ESI-MS: m/z: 623.14 [L + H]+ having 63Cu and m/z: 625.36 [L + H]+ having 65Cu. Magnetic moment (BM, 298 K): 1.41. EPR (g, field (mT), 298 K): 2.019, 334. Molar conductance (Ω−1 cm2 mol−1): 290.
N–), 1340 ν(C–H), 1400 ν(C–N aromatic), 1450 ν(C–C aromatic), 748, 466, 438 ν(Cu–O). UV-Vis (λmax (nm), εmax (dm3 mol−1 cm−1), water): 521, 7.82 × 10³. ESI-MS: m/z: 623.14 [L + H]+ having 63Cu and m/z: 625.36 [L + H]+ having 65Cu. Magnetic moment (BM, 298 K): 1.41. EPR (g, field (mT), 298 K): 2.019, 334. Molar conductance (Ω−1 cm2 mol−1): 290.
2.5 Characterization of the complex
In the IR spectrum of the complex (Fig. 1S†) the band for –OH stretching was flattened suggesting OH groups on HPAN were involved in binding Cu(II). However, peaks for the azo bond did not change much indicating it was not involved in coordinating the metal ion.35,37 The TGA plot (Fig. 2S†) showed its first endotherm at 205 °C to 245 °C corresponding to loss of two water molecules. Experimental loss of 3.4% was in accordance with theoretical prediction of 3.5%. The molar conductance value indicated the complex was an electrolyte having three ions in solution, which also served as evidence for 1![[thin space (1/6-em)]](https://www.rsc.org/images/entities/char_2009.gif) :
:![[thin space (1/6-em)]](https://www.rsc.org/images/entities/char_2009.gif) 2 (metal
2 (metal![[thin space (1/6-em)]](https://www.rsc.org/images/entities/char_2009.gif) :
:![[thin space (1/6-em)]](https://www.rsc.org/images/entities/char_2009.gif) ligand) stoichiometry. Room temperature magnetic moment (1.41 BM) was lower than the spin-only value for Cu(II) indicating weak anti-ferromagnetic coupling. Room temperature EPR spectrum of the powdered complex (Fig. 3S†) revealed the resonance field was at 334 mT and g value was 2.019 as expected for an unpaired electron on Cu(II). Mass spectrum of the complex (Fig. 4S†) suggested it to be [Cu(LH)2(H2O)2] (m/z = 623.14) indicating a close correlation with data obtained from TGA. The peak at m/z = 607.17 was due to [Cu(LH)2(H2O)], following loss of a molecule of water.
ligand) stoichiometry. Room temperature magnetic moment (1.41 BM) was lower than the spin-only value for Cu(II) indicating weak anti-ferromagnetic coupling. Room temperature EPR spectrum of the powdered complex (Fig. 3S†) revealed the resonance field was at 334 mT and g value was 2.019 as expected for an unpaired electron on Cu(II). Mass spectrum of the complex (Fig. 4S†) suggested it to be [Cu(LH)2(H2O)2] (m/z = 623.14) indicating a close correlation with data obtained from TGA. The peak at m/z = 607.17 was due to [Cu(LH)2(H2O)], following loss of a molecule of water.
A suitable single crystal of the complex was however not obtained, as a result of which a structure from X-ray single crystal data could not be given. However, powder diffraction data of the sample was collected at room temperature (298 K) recently and effort is being made to obtain a structure.
2.6 Studies on MOLT-4 cells
| % cell death = 100 − [{(O.D.Sample − O.D.100% Lysis)/(O.D.0% Lysis − O.D.100% Lysis)} × 100] | (1) |
| 2Cu(II)(HPAN)2 + Fe(CN)64− ⇌ Cu2[Fe(CN)6]− + 4HPAN | (2) |
For comparison, a standard curve was prepared prior to experiments with cell extracts. This was done by taking Cu(II) in the same concentration range as used for the complex in experiments with MOLT-4 cells. Six different concentrations of Cu(II) were mixed with excess potassium ferrocyanide and λmax for the Cu(II)–ferrocyanide complex was obtained at 478 nm. The molar absorptivity (ε) at 478 nm was also determined.
2.7 Enzyme assay for reduction of the azo bond in the compounds
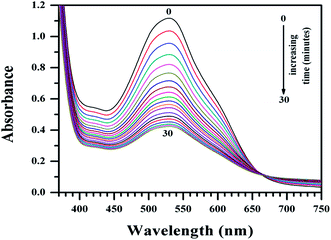
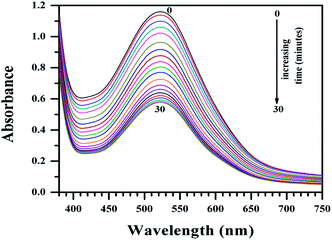
The assay used was based on methods previously reported in the literature41–45 that used cytochrome c reductase as a model azo-reductase since it catalyzes the reduction of azo dyes to primary amines.44,45 NADPH was the reducing substrate while HPAN and Cu(II)(HPAN)2 were electron acceptors. 582 μl phosphate buffer, 240 μl of 0.5 M NaCl, 100 μl of compound solutions (10−3 M) and 70 μl NADPH were mixed in a quartz cuvette (1.7 ml). To initiate the reaction, 8 μl of cytochrome c reductase solution was added to the above mixture in the cuvette. The final assay solution (1.0 ml) was 3 U L−1 in cytochrome c reductase, 100 μM with regard to azo compounds and 444 μM in NADPH. The cuvette was inverted to mix and monitored by UV-Vis spectroscopy against a buffer-DMSO blank. Disappearance of azo group absorbance at 529 nm for HPAN and 522 nm for Cu(II)(HPAN)2 was followed for 30 minutes. The spectrum of the solution was scanned every minute. The experiment was repeated with different concentrations of the compounds of 80 μM, 60 μM and 40 μM respectively, keeping all other experimental conditions identical.2.8 Binding of Cu(II)(HPAN)2 with calf thymus DNA followed by fluorescence
Interaction of HPAN with ct DNA was reported earlier.33 Hence, only the interaction of the complex with ct DNA is reported here. The solid complex dissolved in 10% methanol showed an absorption peak at 522 nm. Hence, solutions of the complex were excited at 520 nm using a fluorescence spectrophotometer. Emission was recorded at 617 nm. A fluorescence quartz cuvette (1 cm × 1 cm) was used for experiments performed at 298 K. Keeping the concentration of Cu(II)(HPAN)2 constant at 100 μM, ct DNA was gradually increased. Binding constant and site size of interaction for Cu(II)(HPAN)2 interacting with ct DNA were evaluated using different equations. For analysis, the following equilibrium was considered:33,46–48
 | (3) |
L represents Cu(II)(HPAN)2, DNA represents ct DNA and Kd indicates the dissociation constant for the interaction considering the equilibrium in eqn (3).33,46–48 Eqn (4) was used to plot reciprocal of the change in fluorescence against reciprocal of (CD − CL), CD being the concentration of ct DNA in solution and CL the initial concentration of Cu(II)(HPAN)2. Eqn (4) provides ΔFmax and Kapp (1/Kd) as the inverse of the intercept and slope respectively.
 | (4) |
ΔF is the change in fluorescence of Cu(II)(HPAN)2 at 617 nm while ΔFmax indicates the maximum change in fluorescence at that wavelength. ΔF/ΔFmax was plotted against CD according to eqn (5) and (6) and Kd was obtained using non-linear square fit analysis.33,46–48
 | (5) |
 | (6) |
The data obtained from fluorescence titration of Cu(II)(HPAN)2 with ct DNA were also analyzed according to Scatchard and eqn (7), from which intrinsic binding constant (K′) and site size (n) were determined.49
 | (7) |
3. Results and discussion
3.1 Physicochemical studies on the formation of Cu(II)–HPAN
![[thin space (1/6-em)]](https://www.rsc.org/images/entities/char_2009.gif) :
:![[thin space (1/6-em)]](https://www.rsc.org/images/entities/char_2009.gif) 2 stoichiometry.
2 stoichiometry.
![[thin space (1/6-em)]](https://www.rsc.org/images/entities/char_2009.gif) :
:![[thin space (1/6-em)]](https://www.rsc.org/images/entities/char_2009.gif) 2 and a pH-metric titration was performed. All mixtures were initially maintained at pH ∼ 1.2 and titrated with 0.01 M NaOH. Fig. 6S† shows the absorption spectra of HPAN in the presence of Cu(II) at different pH. At pH 1.21, HPAN shows two peaks or shoulders at 523 nm and 553 nm respectively. As pH increased to 2.08 and 3.24, the shoulder at 553 nm disappeared while that at 523 nm became prominent showing a constant absorbance in the pH range 5.0–8.0. Further increase in pH caused an increase in absorbance at 523 nm. This gradual change in absorbance was plotted against pH at 520 nm (Fig. 2) and fitted to eqn (8).
2 and a pH-metric titration was performed. All mixtures were initially maintained at pH ∼ 1.2 and titrated with 0.01 M NaOH. Fig. 6S† shows the absorption spectra of HPAN in the presence of Cu(II) at different pH. At pH 1.21, HPAN shows two peaks or shoulders at 523 nm and 553 nm respectively. As pH increased to 2.08 and 3.24, the shoulder at 553 nm disappeared while that at 523 nm became prominent showing a constant absorbance in the pH range 5.0–8.0. Further increase in pH caused an increase in absorbance at 523 nm. This gradual change in absorbance was plotted against pH at 520 nm (Fig. 2) and fitted to eqn (8).| Aobs = A1/(1 + 10pH−pK1 + 10pH−pK2) + A2/(1 + 10pK1−pH + 10pH−pK2) + A3/(1 + 10pK1−pH + 10pK2−pH) | (8) |
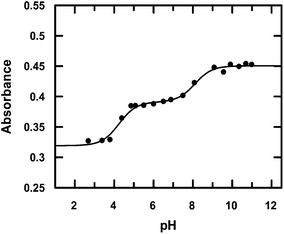 | ||
| Fig. 2 pH-metric titration of HPAN in the presence of Cu(II) shown by a variation of absorbance at 520 nm; [HPAN] = 12 μM, [Cu+2] = 6 μM, [NaNO3] = 0.05 M, temperature = 298 K. The solid line represents the fitted data according to eqn (8). | ||
Considering HPAN as LH2, A1, A2 and A3 refer to absorbance of LH2, LH− and L2− respectively in the presence of Cu(II). Fitting the experimental data, pK1 was obtained as 4.3 ± 0.2 while pK2 was 8.1 ± 0.4. Formation constants β* and β were evaluated with the help of pK1 determined in this study and pK1 of free HPAN determined earlier35 using eqn (9)–(13) (ref. 50).
| Cu2+ + 2H2L ⇌ [Cu(HL)2] + 2H+ | (9) |
 | (10) |
| Cu2+ + 2HL− ⇌ [Cu(HL)2] | (11) |
 | (12) |
 | (13) |
The effective stability constant (β) for CuII(HPAN)2, i.e. [Cu(HL)2], was 1.58 × 10¹⁴ (log β = 14.2). Since pK for the dissociation of the second proton of HPAN in the presence of Cu(II) was 8.1, at physiological pH (∼6.8 to 8.0), [Cu(HL)2] dissociates to form [CuL2]2− and the complex exists in both forms shown below:
| [Cu(HL)2] ⇌ [CuL2]2− + 2H+ | (14) |
3.2 Anti-leukemic effect of Cu(II)(HPAN)2
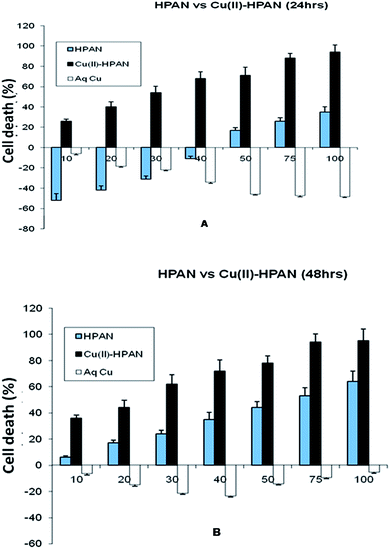
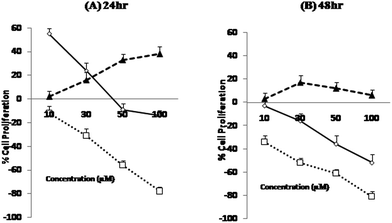
HPAN and Cu(II)(HPAN)2 were each incubated with MOLT-4 cells for both 24 hours and 48 hours. The results obtained showed a dependence on the concentration of the compounds and also on the time of incubation. Fig. 3(A) and (B) depict percentage cell death when treated with the compounds and free aqueous Cu(II). The figures demonstrate different inhibition patterns. While cells treated with free aqueous Cu(II) showed viability at all concentrations (high or low) and at both incubation times, those treated with HPAN showed a biphasic effect. At low concentration (incubation time 24 hours) cells treated with HPAN continued to proliferate. However, with an increase in concentration of HPAN beyond 40 μM, cell death was observed. On the other hand, cells treated with Cu(II)(HPAN)2 and incubated for 24 hours showed gradual increase in cell death from very low concentrations to high concentrations of 100 μM. An incubation time of 48 hours for both compounds having similar concentrations revealed cell death induced due to Cu(II)(HPAN)2 was ∼3- to 4-fold greater than HPAN for concentration <40 μM while it was 1.5- to 2-fold greater for concentration in the range of 40 to 100 μM. These observations were an indication that while sufficient time was required for HPAN to interact with MOLT-4 cells to be able to induce cell death, the same was very fast in the case of Cu(II)(HPAN)2. In fact, at low concentration and an incubation time of 24 hours, cells treated with HPAN continued to proliferate, but with Cu(II)(HPAN)2, cell death induced in the case of an incubation time of 24 hours was almost same as that for 48 hours at all concentrations suggesting that interaction of Cu(II)(HPAN)2 with MOLT-4 cells was much faster than that of HPAN. Thus, increasing the incubation time to 48 hours did not have much of an impact on percentage cell viability in the case of Cu(II)(HPAN)2 compared to data obtained for cells incubated for 24 hours.In order to be sure that free Cu2+(aq) was not responsible for the observed cytotoxicity leading to cell death, a study was carried out where MOLT-4 cells were treated with Cu2+(aq) and incubated for both 24 hours and 48 hours. In each case, Cu2+(aq) assisted proliferation. For an incubation time of 24 hours, there was a gradual increase in cell viability as the concentration of Cu2+(aq) increased from low (10 μM) to high (100 μM) values. However, for an incubation time of 48 hours, there was a gradual increase in viability for increase in concentration from 10 μM to 50 μM, but beyond 50 μM cell viability decreased considerably. In fact, for all concentrations of free Cu2+(aq), cell viability observed for 24 hour incubation was higher than for 48 hour incubation. This could be because high concentrations of Cu2+(aq) or low concentrations of it but incubated for longer time induced cell death, examples of which are known.9,51 The study with Cu2+(aq) clearly demonstrates that it was not responsible for the cell death observed in the case of Cu(II)(HPAN)2. Hence cell death was due to Cu(II) bound to HPAN. The study with Cu2+(aq) also demonstrated it was essential for growth of cancer cells, a fact stated earlier.12,13
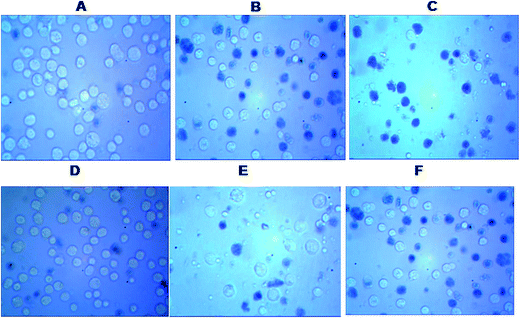
MTT analysis revealed IC50 for HPAN was 65 μM for an incubation time of 48 hours while for Cu(II)(HPAN)2 it was only 27 μM for an incubation time of 24 hours. At higher concentrations of Cu(II)(HPAN)2 a static level was reached when incubated for 24 hours and no significant changes were seen upon increasing the incubation time to 48 hours. Therefore, linking Cu(II) to HPAN not only accelerates induction of cell death in MOLT-4 cells but also decreases IC50 considerably (∼2.5 times). The pictures shown in Fig. 4 demonstrate a higher cytotoxicity of Cu(II)(HPAN)2 than HPAN. Fig. 4(A) and (D) were controls showing live cells with no uptake of the trypan blue dye. With an increase in concentration, cells show appreciable uptake of trypan blue indicating a successful induction of cytotoxicity by Cu(II)(HPAN)2. Since a lot of cancer cells show an increased presence of Cu(II) (ref. 18–21) required for cell proliferation and growth, a molecule like HPAN if introduced in these cells could interact with Cu(II) to reverse these processes to a clear advantage.
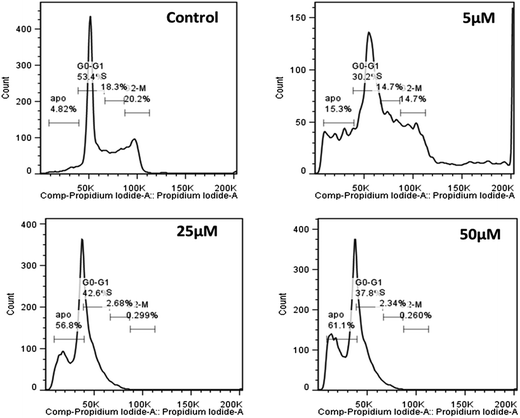
Moreover, since induction of cell death was reasonably fast for Cu(II)(HPAN)2, the real challenge would now be to see the ability of HPAN to engage Cu(II) in cancer cells. Utilizing the findings of this study, particularly those for Cu(II)(HPAN)2, a restriction on the growth of cancer cells containing free Cu(II) could be supposed. As supporting information, we found in a separate study that Cu(II)(HPAN)2 had almost negligible effect on normal PBM cells. To be sure of the proliferative effects shown by Cu2+(aq) and HPAN and the anti-proliferative effects due to Cu(II)(HPAN)2 that we observed through trypan blue exclusion assay and MTT assay, we further conducted a BrdU incorporation assay. From the plot (Fig. 5), it is evident that the BrdU assay data and data obtained with the help of the previously described experiment (MTT assay) are concomitant, hence confirming the cell proliferative effects of both Cu2+ and HPAN. To know whether induction of cell death was due to apoptosis, propidium iodide staining of Cu(II)(HPAN)2-treated MOLT-4 cells was also done. Apoptosis was confirmed for Cu(II)(HPAN)2 that appeared to be more potent. The propidium iodide flow cytometric assay is widely used for evaluation of apoptosis based on the principle that apoptotic cells are characterized by DNA fragmentation and consequently there is a loss of nuclear DNA content.39,40 From the flow cytometric analysis (Fig. 6), it is apparent that the percentage of cells in the sub-G0/G1 region increased in a dose-dependent fashion at 24 hours incubation time point. As can be seen from these plots, maximum cell death was observed at 50 μM (∼61.1%). Data taken together indicate that Cu(II)(HPAN)2 efficiently induces apoptosis at the 24 hour time point on MOLT-4 cells. Details of the mechanism for induction of apoptotic activity in MOLT-4 cells by Cu(II)(HPAN)2 and uptake of HPAN by Cu(II)-enriched cancer cells will be investigated later.
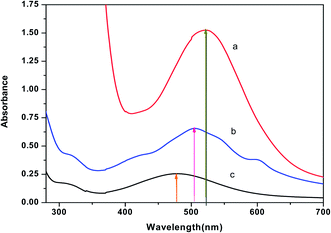
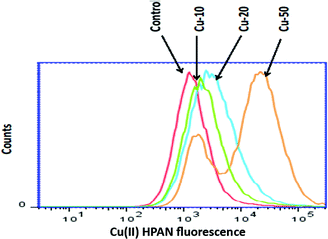
In order to find out the reasons for the fast and effective induction of cytotoxicity by Cu(II)(HPAN)2 in MOLT-4 cells, experiments were designed to see if an efficient cellular uptake of Cu(II)(HPAN)2 by MOLT-4 cells was responsible and made a difference. Cellular uptake was checked with the help of two independent approaches. In one, the presence of Cu(II) was detected by allowing cell lysates containing Cu(II)(HPAN)2 to interact with potassium ferrocyanide; in the other, the presence of Cu(II)(HPAN)2 in cell lysates was detected by flow cytometry.
The molar absorptivity (ε) for spectrum b of Fig. 7 was also in good agreement with that for the spectrum of Cu(II)(HPAN)2 (a of Fig. 7) and Cu(II)–ferrocyanide (c of Fig. 7); the value of ε for Cu(II)(HPAN)2 was much higher than that for Cu(II)–ferrocyanide. Hence the experimental spectrum of the lysate containing both species should have an intensity between those of the spectra of the two pure compounds, which was actually obtained.
3.3 Assay of azo-reductase activity for HPAN and Cu(II)(HPAN)2
Mammalian azo-reductase activity has been studied for a long time and several reports show reductive cleavage of azo compounds yields amines as end products.41–45 In some of these pioneering works, investigators showed the reductive fission of the azo group and identified NADPH as the electron donor.43–45 In order to explain the higher activity of Cu(II)(HPAN)2 over HPAN on MOLT-4 cells (mentioned in Section 3.2), an enzyme assay was performed where the tendency of the azo bond to undergo reduction to amines was monitored (Fig. 9 and 10).52The study showed that reductive fission of the azo bond in the enzyme-catalyzed pathway was only slightly higher for HPAN than Cu(II)(HPAN)2. Fig. 11 demonstrates the percentage of each azo compound remaining after the assay when monitored for the same time. In this regard, it would not be out of place to mention that in an earlier study we showed a complex of Co(II) with HPAN was far less cytotoxic than HPAN on A549-lung carcinoma and PBM cells.33 We attributed the reduction in cytotoxicity to less generation of azo cleaved products (aromatic amines).33 However, in that report we did not include any enzyme assay. Therefore, while performing studies with HPAN and Cu(II)(HPAN)2 we thought of seeing how the Co(II) complex of HPAN compares with these compounds in the enzyme assay and found there was almost no change in absorbance (Fig. 7S†) under similar experimental conditions.
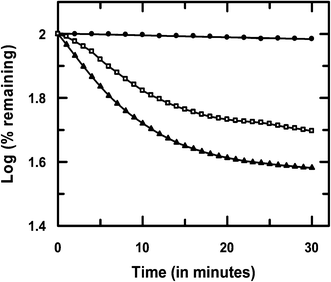 | ||
Fig. 11 Comparison of the rate of reduction of HPAN ( ), Cu(II)(HPAN)2 ( ), Cu(II)(HPAN)2 ( ) and Co(II)–HPAN ( ) and Co(II)–HPAN ( ) of concentration 100 μM in the presence of 3 U L−1 of cytochrome c reductase and 444 μM NADPH. ) of concentration 100 μM in the presence of 3 U L−1 of cytochrome c reductase and 444 μM NADPH. | ||
Unlike Cu(II)(HPAN)2, the presence of Co(II) in the complex was able to prevent the rupture of the azo bond in HPAN that lends support to our hypothesis that generation of azo cleaved products was responsible for cytotoxicity, and a lack of it for the Co(II) complex of HPAN explains why it was less cytotoxic.33
In this study, enzyme-catalyzed reduction of the azo bond was only slightly greater for HPAN compared to Cu(II)(HPAN)2. Hence, one can predict that both HPAN and Cu(II)(HPAN)2 should have similar cytotoxic effects on MOLT-4 cells (Section 3.2) since formation of azo cleaved products (primary amines) was comparable. However, studies on MOLT-4 cells clearly showed Cu(II)(HPAN)2 was significantly better than HPAN in inducing anti-proliferative activity. Hence, it would be appropriate to say that besides the formation of azo cleaved products, the association of Cu(II) with HPAN was probably more important for increasing the chances of cellular uptake that could induce enhanced anti-proliferative activity. This suggestion also explains the observation that Cu(II)(HPAN)2 was much faster in inducing anti-proliferative activity than HPAN.
3.4 Binding of Cu(II)(HPAN)2 with ct DNA by fluorescence spectroscopy
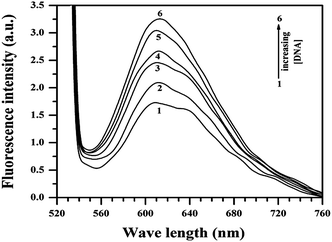
Of many reasons responsible for anti-proliferative activity or cell death, interaction of a molecule with DNA is very important since DNA is the primary cellular target. To find out if interaction of the compounds with DNA was responsible for the observations reported in Section 3.2, a study was performed for Cu(II)(HPAN)2 with calf thymus DNA using fluorescence spectroscopy. Upon excitation at 520 nm, fluorescence emission was recorded at 617 nm with a shoulder at 640 nm. ct DNA was gradually added to a 100 μM solution of Cu(II)(HPAN)2. The emission peak at 617 nm increased while the shoulder at 640 nm ascribed to free Cu(II)(HPAN)2 diminished and eventually disappeared at higher concentrations of ct DNA. This regular increase in fluorescence (Fig. 12) suggests intercalation of the complex between the strands of DNA. The increase in fluorescence (ΔF) at 617 nm followed a regular pattern until saturation was reached. Addition of ct DNA was continued beyond saturation to be sure no further interaction occurred. The titration was repeated five times to ascertain saturation. Binding isotherms were analyzed using eqn (3)–(7).33,46–49Calculations were based on the assumption that fluorescence emission intensity at 617 nm was linearly proportional to the interaction of Cu(II)(HPAN)2 with ct DNA.
Using eqn (4) and Fig. 13 we obtained the apparent binding constant (Kapp) as the inverse of Kd. The intercept was used to calculate ΔFmax in the presence of a large excess of ct DNA. Kapp was also evaluated using non-linear square fit analysis (Fig. 14). The values for Kapp from eqn (4) ((1.48 ± 0.30) × 103) and from eqn (5) and (6) ((1.30 ± 0.25) × 103) were in good agreement with each other. The inset of Fig. 14 shows a plot of ΔF/ΔFmax against ratio of nucleotide (DNA base) concentration to Cu(II)(HPAN)2. Two straight lines were obtained that intersect at a point, providing nb as 12.0.
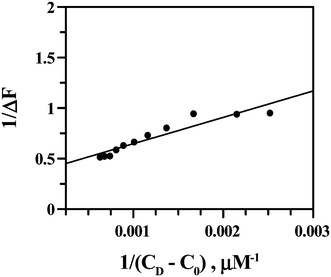 | ||
| Fig. 13 Double reciprocal plot from the fluorimetric titration of Cu(II) complex of HPAN with ct DNA; [Cu(II) complex of HPAN] = 100 μM, [NaCl] = 120 mM; pH = 7.4; T = 298 K. | ||
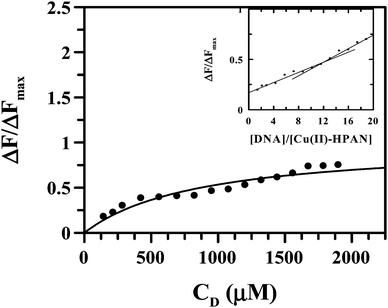 | ||
| Fig. 14 Binding isotherm of the Cu(II) complex of HPAN interacting with ct DNA. The dark line shows the data fitted by a non-linear fit (eqn (4)). [Cu(II)–HPAN] = 100 μM, [NaCl] = 120 mM; pH = 7.4; T = 298 K. Inset: plot of normalized increase of fluorescence emission intensity as a function of mole-ratio of the Cu(II) complex of HPAN to ct DNA. [Cu(II)–HPAN] = 100 μM, [NaCl] = 120 mM; pH = 7.4; T = 298 K. | ||
Multiplying Kapp with nb, the overall binding constant was obtained as (1.67 ± 0.10) × 104 M−1. The fluorescence data were also treated according to Scatchard49 (eqn (6); Fig. 15) yielding an intrinsic binding constant K′ = (4.21 ± 0.70) × 104 M−1 that was slightly higher than the value obtained from double reciprocal plot and non-linear analysis. The site size of interaction (nb) using eqn (7) was 12.7 showing good agreement with that obtained from the inset of Fig. 14. Hence, overall binding constant (K′) and site size of interaction (nb) obtained from the Scatchard plot were in reasonable agreement with that obtained by multiplying Kapp (eqn (4) and (6)) with nb. DNA binding experiments show values obtained for the interaction of Cu(II)(HPAN)2 with ct DNA were similar to those of HPAN determined earlier (K′ = (4.0–9.0) × 104 M−1).33 However, site size of interaction (nb) in the case of Cu(II)(HPAN)2 was four times greater than in the case of HPAN.33
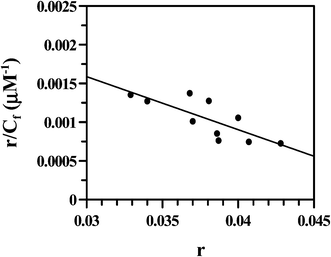 | ||
| Fig. 15 Scatchard plot obtained from the fluorimetric titration of the Cu(II) complex of HPAN with ct DNA; [Cu(II) complex] = 100 μM; [NaCl] = 120 mM; pH = 7.4; T = 298 K. | ||
Hence we find that, with regard to DNA binding, both compounds were almost the same. Even then the ability of Cu(II)(HPAN)2 to induce greater anti-proliferative activity on MOLT-4 cells becomes a little difficult to explain. As mentioned earlier while discussing the enzyme assay, it now seems all the more likely that the reason for the higher activity of Cu(II)(HPAN)2 is related to the association of Cu(II) with HPAN whereby cellular uptake is enhanced which is actually manifested in the difference in action imparted by HPAN and Cu(II)(HPAN)2 on MOLT-4 cells.
4. Conclusions
The study on MOLT-4 cells with HPAN and Cu(II)(HPAN)2 led to some very interesting observations. Low concentrations of HPAN incubated for 24 hours induce a pro-proliferative effect on ALL cells, while higher concentrations, 50 μM and above, induce cytotoxic effects. On the contrary, Cu(II)(HPAN)2 shows notable cytotoxicity even at low concentration, when incubated for 24 hours. Increase in incubation time to 48 hours had no impact on percentage cell death for Cu(II)(HPAN)2-treated cells indicating induction of anti-proliferative activity by the complex was very fast. The study also revealed free Cu2+(aq) was not responsible for anti-proliferative behavior. An attempt was made using an enzyme assay on the reductive fission of the azo bond to understand the reasons for the induction of higher cytotoxicity by Cu(II)(HPAN)2 on MOLT-4 cells. A study of the interaction of the complex with ct DNA was carried out to see its ability to bind DNA. Both enzyme assay and DNA interaction gave results that were almost the same for HPAN and Cu(II)(HPAN)2 making it difficult for us to explain the significant difference in the behavior of the two compounds on MOLT-4 cells with regard to cell death and time for induction of anti-proliferative activity. BrdU incorporation studies on MOLT-4 cells treated with Cu2+(aq), HPAN and Cu(II)(HPAN)2 confirm that Cu2+ and HPAN have different degrees of proliferative effects while Cu(II)(HPAN)2 shows anti-proliferative behavior. Considering all aspects, it was concluded that conjugation of Cu(II) to HPAN was important and played a significant role in cellular uptake that made the crucial difference between the two compounds in their action on MOLT-4 cells. Studies on cellular uptake by two independent methods helped us to conclude that an effective cellular uptake of Cu(II)(HPAN)2 by cells was the key to the complex showing such promising anti-leukemic activity. The findings suggest Cu(II) in the presence of HPAN could bring about a role reversal for itself as regards carcinoma cells, i.e. from assisting the growth of such cells to acting against them when bound to HPAN. Flow cytometric analysis has also confirmed the induction of apoptosis by Cu(II)(HPAN)2. The experiments reported herein indicate that Cu(II)(HPAN)2 holds promise as an effective therapeutic intervention for ALL and allow one to conclude that conjugating HPAN to Cu(II) improved its cytotoxic potential.Abbreviations
| HPAN | 2-Hydroxyphenyl-azo-2′-naphthol |
| Cu(II)–HPAN | Copper complex of 2-hydroxyphenyl-azo-2′-naphthol |
| PBM cells | Peripheral blood mononuclear cells |
| ct DNA | Calf thymus DNA |
| ALL | Acute lymphoblastic leukemia |
| PBS | Phosphate buffer saline |
Acknowledgements
This work was funded by the University Grants Commission, New Delhi in the form of a Major Research Project (39-749/2010(SR)) to SD. Funding from the UGC, New Delhi is gratefully acknowledged. DG is grateful to the UGC, New Delhi for a Project Fellowship. PD wishes to express his gratitude to the UGC, New Delhi for a Research Fellowship. PKG is grateful to the UGC, New Delhi for a Senior Research Fellowship. The authors are thankful to Prof. Dhrubajyoti Chattopadhyay, Director, Centre for Research in Nanoscience & Nanotechnology, University of Calcutta for providing the flow cytometry facility. SD is grateful to Prof. Kalyan K. Mukherjea and his student Shiv Shankar Paul for their help in recording EPR spectra at the departmental facility while TD expresses his gratitude to Ramesh Chandra Santra for his help during EPR experiments. SD is grateful to Prof. Chittaranjan Sinha, Department of Chemistry, Jadavpur University for allowing TD and PD to use the fluorescence spectrophotometer in his laboratory and Prof. Samiran Mitra of the same department for providing the thermo-gravimetric data. TD is grateful to the Principal and TEQUIP – II committee of RCC Institute of Information Technology, Kolkata for providing funds for purchase of chemicals required for the BrdU assay. The authors are grateful to the two reviewers for critically reviewing the manuscript and providing some excellent suggestions.References
- M. E. Figueroa, M. Reimers, R. F. Thompson, K. Ye, Y. Li, R. R. Selzer, J. Fridriksson, E. Paietta, P. Wiernik, R. D. Green, J. M. Greally and A. Melnick, PLoS One, 2008, 3, e1882 Search PubMed.
- E. J. Yeoh, M. E. Ross, S. A. Shurtleff, W. K. Williams, D. Patel, R. Mahfouz, F. G. Behm, S. C. Raimondi, M. V. Relling, A. Patel, C. Cheng, D. Campana, D. Wilkins, X. Zhou, J. Li, H. Liu, C. H. Pui, W. E. Evans, C. Naeve, L. Wong and J. R. Downing, Cancer Cell, 2002, 1, 133–143 CrossRef CAS.
- A. B. Lee-Sherick, R. M. Linger, L. Gore, A. K. Keating and D. K. Graham, Br. J. Haematol., 2010, 151, 295–311 CrossRef CAS PubMed.
- R. Pieters, Ned. Tijdschr. Geneeskd., 2010, 154, A1577 Search PubMed.
- M. S. Brassesco, D. J. Xavier, M. L. Camparoto, A. P. Montaldi, P. R. de Godoy, C. A. Scrideli, L. G. Tone and E. T. Sakamoto-Hojo, J. Biomed. Biotechnol., 2011, 230481, DOI:10.1155/2011/230481.
- G. Tallen, R. Ratei, G. Mann, G. Kaspers, F. Niggli, A. Karachunsky, W. Ebell, G. Escherich, M. Schrappe, T. Klingebiel, R. Fengler, G. Henze and A. V. Stackelberg, J. Clin. Oncol., 2010, 28, 2339–2347 CrossRef CAS PubMed.
- C. Marzano, M. Pellei, F. Tisato and C. Santini, Anti-Cancer Agents Med. Chem., 2009, 9, 185–211 CrossRef CAS.
- E. Gao, C. Liu, M. Zhu, H. Lin, Q. Wu and L. Liu, Anti-Cancer Agents Med. Chem., 2009, 9, 356–368 CrossRef CAS.
- A. A. Kumbhar, A. T. Franks, R. J. Butcher and K. J. Franz, Chem. Commun., 2013, 49, 2460–2462 RSC.
- I. I. Verginadis, S. Karkabounas, Y. Simos, E. Kontargiris, S. K. Hadjikakou, A. Batistatou, A. Evangelou and K. Charalabopoulos, Eur. J. Pharm. Sci., 2009, 42, 253–261 CrossRef PubMed.
- J. Ruiz, C. Vicente, C. de Haro and D. Bautista, Dalton Trans., 2009, 26, 5071–5073 RSC.
- S. Tardito and L. Marchiò, Curr. Med. Chem., 2009, 16, 1325–1348 CrossRef CAS.
- C. Santini, M. Pellei, V. Gandin, M. Porchia, F. Tisato and C. Marzano, Chem. Rev., 2014, 114(1), 815–862 CrossRef CAS PubMed.
- J. Y. Uriu-Adams, R. E. Scherr, L. Lanoue and C. L. Keen, Biofactors, 2010, 26, 136–152 Search PubMed.
- J. R. Prohaska and B. Brokate, J. Nutr., 2002, 132, 3142–3145 CAS.
- L. S. Hurley, C. L. Keen and B. Lönnerdal, Ciba Found. Symp., 1980, 79, 227–245 CAS.
- R. Bonnie Stern, J. Toxicol. Environ. Health, Part A, 2010, 73, 114–127 CrossRef PubMed.
- L. Finney, S. Mandava, L. Ursos, S. W. Zhang, D. Rodi, S. Vogt, D. Legnini, J. Maser, F. Ikpatt, O. I. Olopade and D. Glesne, Proc. Natl. Acad. Sci. U. S. A., 2007, 104, 2247–2252 CrossRef CAS PubMed.
- S. A. Lowndes and A. L. Harris, Journal of Mammary Gland Biology and Neoplasia, 2005, 10, 299–310 CrossRef PubMed.
- S. Zhai, L. Yang, Q. C. Cui, Y. Sun, Q. P. Dou and B. Yan, JBIC, J. Biol. Inorg. Chem., 2010, 15, 259–269 CrossRef CAS PubMed.
- L. Bica, J. Meyerowitz, S. J. Parker, A. Caragounis, T. Du, B. M. Paterson, K. J. Barnham, P. J. Crouch, A. R. White and P. S. Donnelly, BioMetals, 2010, 24, 117–133 CrossRef PubMed.
- T. H. Kim, S. H. Kim, L. V. Tan, Y. J. Seo, S. Y. Park, H. Kim and J. S. Kim, Talanta, 2007, 71, 1294–1297 CrossRef CAS PubMed.
- O. Cakir, E. Coskum, E. Bicer and S. Cakir, Turk. J. Chem., 2001, 25, 33–38 CAS.
- G. A. Ibanez, A. C. Oliveri and G. M. Escandar, Polyhedron, 1998, 17, 4433–4442 CrossRef CAS.
- B. R. Hsieh, R. K. Crandall and B. A. Weinstein, Dyes Pigm., 1991, 17, 141–151 CrossRef CAS.
- J. S. Bae, H. S. Freeman and A. El-Shafei, Dyes Pigm., 2003, 57, 121–129 CrossRef CAS.
- L. S. Kaplow and M. S. Burstone, J. Histochem. Cytochem., 1964, 12, 805–811 CrossRef CAS PubMed.
- A. S. A. Zidan, A. I. El-Said, M. S. El-Meligy, A. A. M. Aly and O. F. Mohammed, J. Therm. Anal. Calorim., 2000, 62, 665–679 CrossRef CAS.
- H. G. Garg and C. Prakash, J. Med. Chem., 1971, 14, 649–650 CrossRef CAS.
- H. G. Garg and C. Prakash, J. Med. Chem., 1972, 15, 435–436 CrossRef CAS.
- J. Barek, A. Berka and J. Zima, Collect. Czech. Chem. Commun., 1985, 50, 1819–1827 CrossRef CAS.
- S. D. Khare, F. Ding, K. N. Gwanmesia and N. V. Dokholyan, PLoS Comput. Biol., 2005, 1, 230–235 CrossRef CAS PubMed.
- T. Deb, D. Choudhury, P. S. Guin, M. B. Saha, G. Chakrabarti and S. Das, Chem.-Biol. Interact., 2011, 189, 206–214 CrossRef CAS PubMed.
- R. H. Steele, J. Sabik, R. R. Benerito and S. W. O'Dea, Arch. Biochem. Biophys., 1988, 267, 125–142 CrossRef CAS.
- T. Deb, S. Khamrai, P. S. Guin, M. B. Saha, P. C. Mandal and S. Das, Int. J. Pure Appl. Chem., 2009, 4, 131–138 Search PubMed.
- A. I. Vogel, A text book of quantitative inorganic analysis, ELBS & Longman, London, 3rd edn, 1961 Search PubMed.
- K. Nakamoto, Infrared and Raman Spectra of Inorganic and Coordination Compounds, Wiley-Interscience, New York, 3rd edn, 1978 Search PubMed.
- S. Pal, M. Chatterjee, D. K. Bhattacharya, S. Bandhyopadhyay and C. Mandal, Glycobiology, 2000, 10, 539–549 CrossRef CAS PubMed.
- C. Riccardi and I. Nicoletti, Nat. Protoc., 2006, 1(3), 1458–1461 CrossRef CAS PubMed.
- P. K. Gopal, M. Paul and S. Paul, Asian Pacific Journal of Cancer Prevention, 2014, 15(1), 93–100 Search PubMed.
- F. Rafii and C. E. Cerniglia, Environ. Health Perspect., 1995, 103, 17–19 CrossRef CAS.
- H. Chen, Curr. Protein Pept. Sci., 2006, 7, 101–111 CrossRef CAS.
- P. H. Hernandez, J. R. Gillette and P. Mazel, Biochem. Pharmacol., 1967, 16, 1859–1875 CrossRef CAS.
- G. C. Mueller and J. A. Miller, J. Biol. Chem., 1950, 185, 145–154 CAS.
- M.-T. Huang, G. T. Miwa and A. Y. H. Lu, J. Biol. Chem., 1979, 254, 3930–3934 CAS.
- P. S. Guin, S. Das and P. C. Mandal, J. Inorg. Biochem., 2009, 103, 1702–1710 CrossRef CAS PubMed.
- P. S. Guin, S. Das and P. C. Mandal, J. Phys. Org. Chem., 2010, 23, 477–482 CrossRef CAS.
- P. Das, P. S. Guin, P. C. Mandal, M. Paul, S. Paul and S. Das, J. Phys. Org. Chem., 2011, 24, 774–785 CAS.
- G. Scatchard, Ann. N. Y. Acad. Sci., 1949, 51, 660–672 CrossRef CAS.
- H. Beraldo, A. Garnier-Suillerot and L. Tosi, Inorg. Chem., 1983, 22, 4117–4124 CrossRef CAS.
- A. Thit, H. Selck and H. F. Bjerregaard, Toxicol. In Vitro, 2013, 27, 1596–1601 CrossRef CAS PubMed.
- D. Ganguly, R. Sarkar, R. C. Santra, T. Deb, T. Sen and S. Das, Complex Metals, 2014, 1, 13–22 Search PubMed.
Footnotes |
| † Electronic supplementary information (ESI) available. See DOI: 10.1039/c3ra44765k |
| ‡ T. D. is presently an Assistant Professor at the Department of Chemistry, RCC Institute of Information Technology, Kolkata – 700 015, India. |
| § These authors contributed equally to the manuscript. |
| ¶ M. B. S. retired as Professor of the Department of Chemistry, Jadavpur University, India in 2009 and was a former Head of the Department. |
| This journal is © The Royal Society of Chemistry 2014 |

