A DFT/TDDFT study of the excited state intramolecular proton transfer based sensing mechanism for the aqueous fluoride chemosensor BTTPB†
Jun-Sheng
Chen
ab,
Pan-Wang
Zhou
a,
Li
Zhao
ab and
Tian-Shu
Chu
*ac
aState Key Laboratory of Molecular Reaction Dynamics, Dalian Institute of Chemical Physics, Chinese Academy of Sciences, Dalian, 116023, People's Republic of China. E-mail: tschu@dicp.ac.cn; tschu008@163.com
bUniversity of the Chinese Academy of Sciences, Beijing, 100049, People's Republic of China
cInstitute for Computational Sciences and Engineering, Laboratory of New Fiber Materials and Modern Textile, The Growing Base for State Key Laboratory, Qingdao University, Qingdao, 266071, People's Republic of China
First published on 7th November 2013
Abstract
The sensing mechanism of the aqueous fluoride chemosensor N-(3-(benzo[d]thiazol-2-yl)-4-(tert-butyldiphenyl silyloxy)phenyl)-benzamide (BTTPB) has been studied in detail by DFT/TDDFT methods. The desilylation reaction which has a moderate transition barrier of 17.6 kcal mol−1 and the excited state intramolecular proton transfer (ESIPT) of the desilylation reaction product (3-BTHPB) work together for the fluorescent sensing mechanism. The constructed potential energy curves among the optimized 3-BTHPB (enol form) and 3-BTHPB-e (keto form) geometries on the S0 and S1 states, indicated that the ESIPT is a low barrier process (0.1 kcal mol−1), and the energies of the optimized geometries showed that the ESIPT process is exothermic. The calculated vertical excitation energies in the ground state and the first singlet excited state reproduced the experimental UV-Vis absorbance and fluorescence emission spectra well.
1. Introduction
Fluoride anion is an essential trace element in the human body and plays an important role in a broad range of biological, medical and environmental processes,1,2 such as dental care, osteoporosis treatment, water supply treatment, and even in chemical warfare agents.3,4 Developing fluoride chemosensors has attracted much interest during recent years, and a number of fluoride chemosensors have been synthesized and reported, with most fluoride chemosensors only working in organic solvent to detect tetra-n-butylammonium (TBA) fluoride4 because of the high hydration enthalpy of the fluoride anion. However, it is significant for human health to implement “accurate, rapid, sensitive, selective” detection of fluoride in aqueous solution and biological samples. For example, the fluoride concentration in urine is a commonly used index in monitoring fluoride exposure or poisoning.5The recent development strategy of aqueous fluoride chemosensors involves the fluoride-triggered Si–O bond cleavage,4–11 the boron–fluoride interaction,12 the fluoride affinity of stibonium cations13 and so on.14,15 In particular, chemosensors based on fluoride-triggered Si–O bond cleavage mechanism usually have high performance, rapid response, excellent selectivity and high sensitivity for F− detection in organic, aqueous or mixed solvents.4,5,9–11,14 And the good performance of this type of chemosensor is ascribed to the combination of the fluoride-triggered Si–O bond cleavage with different mechanisms, such as the intramolecular charge transfer (ICT),9,16–21 the excited state proton transfer (ESPT),22–24 the excimer/monomer formation25 or other mechanisms,19,26–28 which will eventually cause a remarkable change in absorption or emission.
Recently, Yang and co-workers reported N-(3-(benzo[d]thiazol-2-yl)-4-(tert-butyldiphenyl silyloxy)phenyl)-benzamide (BTTPB; see Scheme 1) as a fluorescent chemosensor for fluoride anion in aqueous solvent.11 The sensor BTTPB shows rapid response (200 seconds (ref. 11)), excellent selectivity, high sensitivity, and provides two independent models (power-metric mode and colorimetric mode) of signal recognition in response to fluoride anion.11 According to the experimental results, Yang et al. proposed the sensing mechanism is based on the combination of fluoride-triggered Si–O bond cleavage process and the excited state intramolecular proton transfer (ESIPT) mechanism.11 In order to give a clear and detailed picture of this experimentally proposed sensing mechanism, we conduct a theoretical study by employing the DFT/TDDFT method to investigate both the ground and the excited states of the molecules relevant to the sensing process. We constructed the potential energy (Gibbs free energy) surface (PES) of the desilylation reaction to explore the dynamics feature of the fluoride-triggered Si–O bond cleavage process. We also presented and analyzed the frontier molecular orbitals, electronic transition energies, oscillator strengths for the involved molecular structures and the first excited state potential energy curve of 3-BTHPB to provide direct information of the ESIPT process.
2. Theoretical methods
In this contribution, all calculations presented were accomplished using the DFT/TDDFT method with the hybrid exchange-correlation functional B3LYP29–31 and TZVP basis set32,33 by Gaussian 09 program.34 Considering that the experiments were conducted in aqueous solvent, in all calculations solvent effects were included using the integral equation formalism35,36 (IEF) version of polarizable continuum model37,38 (PCM) with the dielectric constant of water (ε = 78.4). For the ground state (S0) structures, we optimized these structures without constrain. At the optimized structures, vibrational frequencies were analyzed to confirm the structures were at the minima corresponding to the local minimal on the S0 state. PES calculation for the desilylation process was carried out: all stationary points along the reaction coordinate were full optimized and frequency analyses were performed to obtain the thermodynamic corrections and confirm whether the structures were at the minima or transition state. All Gibbs free energies reported (ΔGwater) were relative Gibbs free energies to the corresponding Gibbs free energy of the reagents, with Gibbs free energy correction. Vertical excitation energies (VEE) calculations were performed from the ground optimized structure using TDDFT/B3LYP/TZVP method with IEF-PCM (water, ε = 78.4). For the first excited state, the geometries were optimized from the optimized ground sate structures without constraint and studied with the TDDFT/B3LYP/TZVP method with IEF-PCM (water, ε = 78.4) and vibrational frequency analyses were performed to confirm that these structures corresponded to the local minima on the S1 energy surface.3. Results and discussion
3.1 Optimized structures
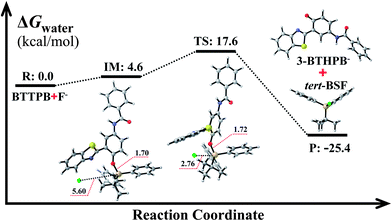
The optimized ground-state structures of the chemosensor BTTPB, the relevant desilylation products 3-BTHPB− and 3-BTHPB (see Fig. 1) were obtained at the DFT/B3LYP/TZVP level with IEF-PCM (water, ε = 78.4), a subsequent vibrational frequency analysis further confirmed these structures were at the minima. In order to capture the dynamics feature of the desilylation reaction, we calculated the profile of Gibbs free energy in solution for the desilylation process (see Fig. 2). The formation of the intermediate, a complex between BTTPB and F−, is endergonic by 4.6 kcal mol−1. In the intermediate complex, the fluoride anion interacts with BTTPB through hydrogen bond interaction,39,40 and it has almost no interaction with silicon atom. A transition state (ΔG = 17.6 kcal mol−1) was located for the Si–O bond cleavage and F–Si bond formation. Relaxation of the transition state toward the intermediate and the products by IRC calculations did not detect any intermediates. Thus, the results indicated that the present desilylation reaction belonged to the SN2 reaction type and had a moderate reaction barrier (ΔG = 17.6 kcal mol−1) for the Si–O bond cleavage and the formation of 3-BTHPB− and tert-BSF. Meanwhile this moderate barrier reaction induces the rapid response speed of the chemosensor BTTPB for fluoride anion.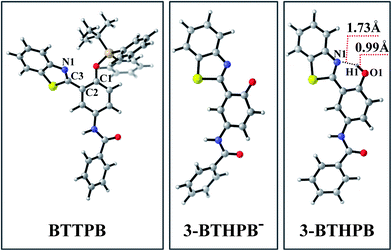 | ||
| Fig. 1 Views of the optimized S0 structures for BTTPB, 3-BTHPB−, and 3-BTHPB at the B3LYP/TZVP calculation level. Gray: C; white: H; red: O; blue: N; yellowish brown: Si; yellow: S. | ||
Due to the experiments were conducted in water, the desilylation product 3-BTHPB− (anion form) would capture one free H+ from the aqueous solvent and form 3-BTHPB. To understand this formation process of 3-BTHPB, we further carried out structural optimization with the fixed O⋯H distance and constructed the ground-state potential energy curve of the desilylation product 3-BTHPB− and H+ as a function of the O⋯H distance varying from 3.5 Å to 0.9 Å (see Fig. S1†). As can be seen, with shortening the O⋯H distance, a keto-tautomer form of 3-BTHPB was first formed at d(O⋯H) = 1.76 Å. But this keto-tautomer form was not very stable, and further shortening of the O⋯H distance resulted in a more stable enol-tautomer form of 3-BTHPB at d(O⋯H) = 0.99 Å. Due to the 3-BTHPB formation process from 3-BTHPB− and H+ is barrierless, it is easy for the desilylation product 3-BTHPB− to capture H+ to form the stable enol-tautomer form of 3-BTHPB. This confirms that 3-BTHPB is the end product of the desilylation reaction.
In order to explain the high selectivity of the chemosensor BTTPB for fluoride anion, we calculated the binding energies between the chemosensor BTTPB and the basic anions. The binding energies for BTTPB with the anions reported in ref. 11 (F−, Cl−, Br−, AcO−, NO3−, H2PO4−, HSO4−) are listed in Table 1. The binding energy between the F− and BTTPB is more than 3 times larger than that between other anions and the chemosensor BTTPB. The large binding energy between fluoride anion and chemosensor BTTPB is the reason for that the chemosensor BTTPB shows an excellent selectivity to fluoride anion.
| Anions | Binding energies/kcal mol−1 |
|---|---|
| F− | 15.2 |
| Cl− | 1.5 |
| Br− | 4.8 |
| AcO− | 5.2 |
| NO3− | 4.4 |
| H2PO4− | 2.8 |
| HSO4− | 1.2 |
3.2 UV-Vis absorption spectra and molecular orbital analysis
The UV-Vis absorption spectra of BTTPB were recorded with different amounts of NaF in ref. 11. Yang et al. found that the absorption intensity of the shoulder peak around 335 nm decreases gradually and accompanies with the formation of a new band at ∼360 nm (see Fig. 3a). Obviously, the shoulder peak around 335 nm corresponds to the absorption of BTTPB. To simulate the experimental spectra, we calculated the VEEs and the corresponding oscillator strengths for BTTPB and 3-BTHPB at the TDDFT/B3LYP/TZVP level, based on the aforementioned optimized geometries. Our theoretical calculations predicted low-lying six absorbing transitions, then, the absorption profiles were calculated using the Gaussian models, and compared with the experimental results (see Fig. 3b). As can be seen, the calculated absorption profiles of BTTPB and 3-BTHPB agree well with the experimental results, which further confirmed that 3-BTHPB was the end product from the desilylation reaction of BTTPB.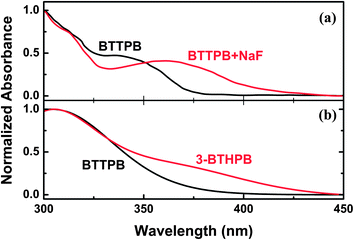 | ||
| Fig. 3 The experimental and calculated UV-Vis absorption spectra. (a) Experimental UV-Vis spectra in water with the addition of NaF (taken from ref. 11). (b) Calculated absorption bands of BTTPB and 3-BTHPB obtained at the TDDFT/B3LYP/TZVP level. | ||
Tables 2, S1 and S2† show the calculated VEEs of BTTPB and 3-BTHPB, together with the experimental results of absorbance titration.11 The first singlet transition (S0 → S1) of both BTTPB and 3-BTHPB corresponds to the orbital transition from the highest occupied molecular orbital (HOMO) to the lowest unoccupied molecular orbital (LUMO). Fig. 4 displayed the frontier molecular orbitals for BTTPB and 3-BTHPB. It is evident that the thiazole moiety contributes little to HOMO, but its contribution to LUMO was relatively and greatly increased. Thus, the S1 state of BTTPB and 3-BTHPB owns an ICT character. It is known that B3LYP functional suffers severe failure when dealing with charge transfer excited states.41,42 Therefore, to validate the ability of the B3LYP functional in describing the present ICT process, we further performed long-range corrected functional calculation with CAM-B3LYP43 and displayed the frontier molecular orbitals for the DFT/CAM-B3LYP optimized structures of BTTPB and 3-BTHPB in Fig. S2.† (The calculated VEEs with CAM-B3LYP functional are listed in Tables S3 and S4†). For the frontier molecular orbitals involved in the first singlet transition (S0 → S1) of both BTTPB and 3-BTHPB, their features obtained from the DFT/CAM-B3LYP calculation (see Fig. S2†) are almost the same as those from the DFT/B3LYP calculation (see Fig. 4). This indicates that the ICT character of the S1 state can be reasonably described by the present TDDFT/B3LYP calculation. The atomic orbitals of the N1 atom of thiazole moiety (labelled in Fig. 1) take more proportion in LUMO than those in HOMO, which indicates that the electron density distribution of the N atom of thiazole moiety increases upon excitation to the S1 state. This may induce the ESIPT process to take place between the hydroxyl group and the N atom of the thiazole moiety in the S1 state of 3-BTHPB.
| Theoretical data | Experimental data | |||||
|---|---|---|---|---|---|---|
| Electronic transitiona | Energy (nm eV−1) | f b | Contrib.c | CId | Absorbance bande (nm) | |
| a Only the selected low-lying excited states are presented. b Oscillator strength. c Only the main configurations are presented; H, HOMO (highest occupied molecular orbital) and L, LUMO (lowest unoccupied molecular orbital). d The CI coefficients are in absolute values. e The experimental absorbance band taken from ref. 11. | ||||||
| BTTPB | S0 → S1 | 328(3.78) | 0.1571 | H → L | 0.88 | ∼335 |
| 3-BTHPB | S0 → S1 | 368(3.37) | 0.3000 | H → L | 0.97 | ∼360 |
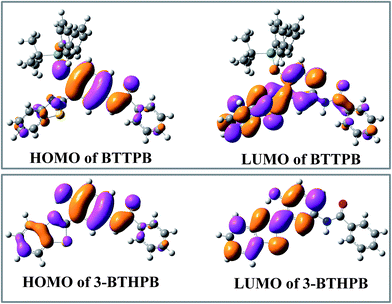 | ||
| Fig. 4 The calculated frontier molecular orbitals HOMO and LUMO for BTTPB and 3-BTHPB at the DFT/B3LYP/TZVP level. | ||
3.3 First excited-state geometries and fluorescence emission spectra
In order to understand the ESIPT process in the sensing mechanism of the chemosensor BTTPB, we optimized the S1 state structures of BTTPB, 3-BTHPB and the ESIPT structure (named as 3-BTHPB-e) of 3-BTHPB (see Fig. 5). The results showed that in the S1 state BTTPB exhibited a similar structure to that in the ground state, except that the dihedral angle C1–C2–C3–N1 changed from −53.9° (in the S0 state) to −18.8° (in the S1 state). Such partial configuration change and the ICT character of the S1 state induce the large Stokes shift (∼83 nm, an experimental value11) of the chemosensor BTTPB in water.11 In the present calculation, the Stokes shift value is 96 nm which agrees with the experimental value, indicating that the present theoretical method is reliable. Moreover, in the S1 state, the energy of the keto form 3-BTHPB-e is lower than that of the enol form 3-BTHPB (ΔE = −6.4 kcal mol−1; ΔG = −6.4 kcal mol−1). The hydrogen bond length d(N⋯H) is shortened from 1.74 Å (in the S0 state of enol form 3-BTHPB) to 1.56 Å (in the S1 state of enol form 3-BTHPB) and the O–H bond length is lengthened from 0.99 Å to 1.04 Å. These can indirectly demonstrate that there is an ESIPT process in the enol form 3-BTHPB which is like previously reported analogous systems.44–47 The proton is transferred from the hydroxyl to the N of the thiazole moiety during the relaxation process of 3-BTHPB to its stable geometry 3-BTHPB-e in the S1 state.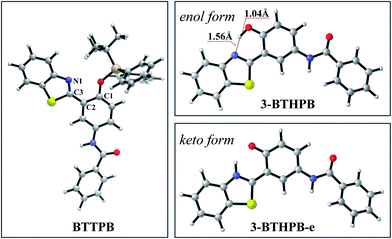 | ||
| Fig. 5 Views of the optimized S1 structures for BTTPB, 3-BTHPB and 3-BTHPB-e at the TDDFT/B3LYP/TZVP level. Gray: C; white: H; red: O; blue: N; yellow: S. | ||
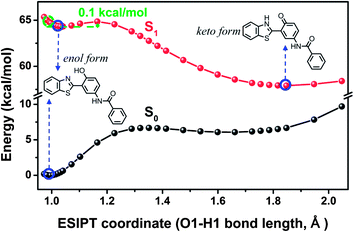
Table 3 lists the calculated S1 → S0 VEEs for BTTPB, 3-BTHPB and 3-BTHPB-e with the experimental results of fluorescence titration. In the experiment the added NaF induced an immediate red shift in the fluorescence maximum from 418 nm to 560 nm.11 The calculated fluorescence emission band of the chemosensor BTTPB is located at 424 nm, which agrees well with the experimental result (418 nm). The calculated fluorescence emission band of 3-BTHPB and 3-BTHPB-e is located at 449 nm and 558 nm, respectively. This large red shift observed in the fluorescence emission between 3-BTHPB (enol form) and 3-BTHPB-e (keto form) is due to the ESIPT process (see Fig. 6) as well as the significant changes of the orbital energies (LUMO: from −2.37 eV to −2.53 eV, HOMO: from −5.69 eV to −5.24 eV, see Fig. S3†). As mentioned above, the fluorescence emission band of the chemosensor BTTPB shifted from 418 nm to 560 nm (ref. 11) with addition of F−, this indicates that the fluorescence emission species is the ESIPT product 3-BTHPB-e.
3.4 The S1 state potential energy curves and the sensing mechanism
To reveal more features of the ESIPT process in the fluoride-sensing mechanism of BTTPB, we optimized all the excited-state geometrical structures with the fixed O1–H1 length, and constructed the potential energy curves on the S1 and S0 states (see Fig. 6) as a function of the O1–H1 bond length from 0.97 to 2.00 Å among the 3-BTHPB (enol form) and 3-BTHPB-e (keto form) geometries, which can provide qualitative energetic pathways for the ESIPT process of 3-BTHPB. As discussed above (Section 3.3), the energy of the keto form 3-BTHPB-e is lower than that of the enol form 3-BTHPB in the S1 state, and this demonstrated that the ESIPT process of 3-BTHPB is exothermic. The S1-state potential energy curve exhibits a barrier of 0.1 kcal mol−1 between the reagent (from the vertical transition at the geometry of the minimum in the ground state) and the product. This proved that transferring the proton H1 from O1 to N1 in 3-BTHPB overcomes a very low barrier (see Fig. 6), thus suggesting that the ESIPT is very likely to be proceeded via a tunnelling process or an inertia limited process or both.48Thus, in the sensing process of the chemosensor BTTPB, first, BTTPB reacted with the added fluoride anion and formed the desilylation product 3-BTHPB− (SN2 reaction type, see Fig. 2). Second, the anion form 3-BTHPB− captured a free H+ from the aqueous solvent and formed the enol form 3-BTHPB (a barrierless reaction, see Fig. S1†). Third, the ESIPT process of 3-BTHPB induced the distinct red shift in its fluorescence emission spectrum as compared with that of BTTPB. Consequently, the detection of fluoride anion by BTTPB can be successfully achieved by monitoring the fluorescence emission spectra or the fluorescence color signal directly with the naked eye.11
4. Conclusion
In summary, we have investigated the sensing mechanism of the fluoride chemosensor BTTPB by DFT and TDDFT calculations. In the sensing process, the fluoride anion first triggered the cleavage of the Si–O bond of the chemosensor BTTPB, and formed the two products of 3-BTHPB− and tert-BSF. The energy profile suggests that this process has a moderate Gibbs free energy barrier of 17.6 kcal mol−1. Next, the anion form 3-BTHPB− captured a free H+ from the aqueous solvent and formed the neutral product 3-BTHPB. While upon photoexcitation, the proton H1 in the enol form 3-BTHPB transferred from the O1 atom to the N1 atom through an ESIPT process, and formed the keto form 3-BTHPB in the S1 state to decay to the S0 state. The exothermic and low barrier (0.1 kcal mol−1) ESIPT process as well as the significant changes of the orbital energies are responsible for the red-shift fluorescence emission spectrum of the end product 3-BTHPB, as compared with that of BTTPB. Further, the present DFT/TDDFT calculation well reproduced the experimental UV-Vis absorbance and fluorescence emission spectra. Hence, the sensing mechanism of the aqueous chemosensor BTTPB for fluoride anion has been theoretically verified to be the combination of the desilylation reaction, the H+ capture process and the ESIPT process. This further confirmed the experimentally proposed sensing mechanism11 for the chemosensor BTTPB.Acknowledgements
This work is supported by National Natural Science Foundation of China (NSFC grant no. 21203187 and 21273234).References
- K. L. Han and G. Z. He, J. Photochem. Photobiol., C, 2007, 8, 55–66 CrossRef CAS PubMed.
- F. B. Yu, P. Li, B. S. Wang and K. L. Han, J. Am. Chem. Soc., 2013, 135, 7674–7680 CrossRef CAS PubMed.
- P. Connett, Fluoride, 2007, 40, 155–158 Search PubMed.
- Y. M. Yang, Q. Zhao, W. Feng and F. Y. Li, Chem. Rev., 2013, 113, 192–270 CrossRef CAS PubMed.
- F. Zheng, F. Zeng, C. Yu, X. Hou and S. Wu, Chem.–Eur. J., 2013, 19, 936–942 CrossRef CAS PubMed.
- T. H. Kim and T. M. Swager, Angew. Chem., Int. Ed., 2003, 42, 4803–4806 CrossRef CAS PubMed.
- A. B. Descalzo, D. Jimenez, J. El Haskouri, D. Beltran, P. Amoros, M. D. Marcos, R. Martinez-Manez and J. Soto, Chem. Commun., 2002, 562–563 RSC.
- H. Lenormand, J. P. Goddard and L. Fensterbank, Org. Lett., 2013, 15, 748–751 CrossRef CAS PubMed.
- Z. W. Luo, B. Yang, C. Zhong, F. Tang, M. Yuan, Y. B. Xue, G. M. Yao, J. W. Zhang and Y. H. Zhang, Dyes Pigm., 2013, 97, 52–57 CrossRef CAS PubMed.
- L. Xiong, J. Feng, R. Hu, S. Q. Wang, S. Y. Li, Y. Li and G. Q. Yang, Anal. Chem., 2013, 85, 4113–4119 CrossRef CAS PubMed.
- R. Hu, J. A. Feng, D. H. Hu, S. Q. Wang, S. Y. Li, Y. Li and G. Q. Yang, Angew. Chem., Int. Ed., 2010, 49, 4915–4918 CrossRef CAS PubMed.
- Y. Kim and F. P. Gabbai, J. Am. Chem. Soc., 2009, 131, 3363–3369 CrossRef CAS PubMed.
- I. S. Ke, M. Myahkostupov, F. N. Castellano and F. P. Gabbai, J. Am. Chem. Soc., 2012, 134, 15309–15311 CrossRef CAS PubMed.
- L. E. Santos-Figueroa, M. E. Moragues, E. Climent, A. Agostini, R. Martinez-Manez and F. Sancenon, Chem. Soc. Rev., 2013, 42, 3489–3613 RSC.
- F. Du, Y. Bao, B. Liu, J. Tian, Q. Li and R. Bai, Chem. Commun., 2013, 49, 4631–4633 RSC.
- M. Dong, Y. Peng, Y. M. Dong, N. Tang and Y. W. Wang, Org. Lett., 2012, 14, 130–133 CrossRef CAS PubMed.
- X. H. Cheng, S. Li, G. H. Xu, C. G. Li, J. G. Qin and Z. Li, ChemPlusChem, 2012, 77, 908–913 CrossRef CAS.
- B. C. Zhu, F. Yuan, R. X. Li, Y. M. Li, Q. Wei, Z. M. Ma, B. Du and X. L. Zhang, Chem. Commun., 2011, 47, 7098–7100 RSC.
- J. J. Du, M. M. Hu, J. L. Fan and X. J. Peng, Chem. Soc. Rev., 2012, 41, 4511–4535 RSC.
- Y. Y. Bao, B. Liu, H. Wang, J. Tian and R. K. Bai, Chem. Commun., 2011, 47, 3957–3959 RSC.
- K. L. Han, J. D. Huang, S. Chai, S. H. Wen and W. Q. Deng, Nat. Prot. Exch., 2013 DOI:10.1038/protex.2013.070.
- X. F. Yang, H. P. Qi, L. P. Wang, Z. Su and G. Wang, Talanta, 2009, 80, 92–97 CrossRef CAS PubMed.
- F. Yu, P. Li, G. Li, G. Zhao, T. Chu and K. Han, J. Am. Chem. Soc., 2011, 133, 11030–11033 CrossRef CAS PubMed.
- G. Y. Li, Y. H. Li, H. Zhang and G. H. Cui, Commun. Comput. Chem., 2013, 1, 88–98 Search PubMed.
- L. Z. Gai, H. C. Chen, B. Zou, H. Lu, G. Q. Lai, Z. F. Li and Z. Shen, Chem. Commun., 2012, 48, 10721–10723 RSC.
- G. J. Zhao and K. L. Han, Biophys. J., 2008, 94, 38–46 CrossRef CAS PubMed.
- J. S. Chen, P. W. Zhou, G. Y. Li, T. S. Chu and G. Z. He, J. Phys. Chem. B, 2013, 117, 5212–5221 CrossRef CAS PubMed.
- C. Y. Lv, L. J. Sun, B. Q. Wang, C. Y. Zhang and J. Zhang, Commun. Comput. Chem., 2013, 1, 282–296 Search PubMed.
- A. D. Becke, J. Chem. Phys., 1993, 98, 5648–5652 CrossRef CAS.
- C. T. Lee, W. T. Yang and R. G. Parr, Phys. Rev. B: Condens. Matter Mater. Phys., 1988, 37, 785–789 CrossRef CAS.
- B. Miehlich, A. Savin, H. Stoll and H. Preuss, Chem. Phys. Lett., 1989, 157, 200–206 CrossRef CAS.
- A. Schafer, H. Horn and R. Ahlrichs, J. Chem. Phys., 1992, 97, 2571–2577 CrossRef.
- A. Schafer, C. Huber and R. Ahlrichs, J. Chem. Phys., 1994, 100, 5829–5835 CrossRef.
- M. J. Frisch, G. W. Trucks, H. B. Schlegel, G. E. Scuseria, M. A. Robb, J. R. Cheeseman, G. Scalmani, V. Barone, B. Mennucci, G. A. Petersson, H. Nakatsuji, M. Caricato, X. Li, H. P. Hratchian, A. F. Izmaylov, J. Bloino, G. Zheng, J. L. Sonnenberg, M. Hada, M. Ehara, K. Toyota, R. Fukuda, J. Hasegawa, M. Ishida, T. Nakajima, Y. Honda, O. Kitao, H. Nakai, T. Vreven, J. A. Montgomery, Jr, J. E. Peralta, F. Ogliaro, M. Bearpark, J. J. Heyd, E. Brothers, K. N. Kudin, V. N. Staroverov, T. Keith, R. Kobayashi, J. Normand, K. Raghavachari, A. Rendell, J. C. Burant, S. S. Iyengar, J. Tomasi, M. Cossi, N. Rega, J. M. Millam, M. Klene, J. E. Knox, J. B. Cross, V. Bakken, C. Adamo, J. Jaramillo, R. Gomperts, R. E. Stratmann, O. Yazyev, A. J. Austin, R. Cammi, C. Pomelli, J. W. Ochterski, R. L. Martin, K. Morokuma, V. G. Zakrzewski, G. A. Voth, P. Salvador, J. J. Dannenberg, S. Dapprich, A. D. Daniels, O. Farkas, J. B. Foresman, J. V. Ortiz, J. Cioslowski and D. J. Fox, Gaussian 09 User’s Reference, Gaussian, Inc., Wallingford CT, 2010 Search PubMed.
- E. Cances, B. Mennucci and J. Tomasi, J. Chem. Phys., 1997, 107, 3032–3041 CrossRef CAS.
- B. Mennucci, E. Cances and J. Tomasi, J. Phys. Chem. B, 1997, 101, 10506–10517 CrossRef CAS.
- S. Miertus, E. Scrocco and J. Tomasi, Chem. Phys., 1981, 55, 117–129 CrossRef CAS.
- R. Cammi and J. Tomasi, J. Comput. Chem., 1995, 16, 1449–1458 CrossRef CAS.
- G. J. Zhao, J. Y. Liu, L. C. Zhou and K. L. Han, J. Phys. Chem. B, 2007, 111, 8940–8945 CrossRef CAS PubMed.
- G. J. Zhao and K. L. Han, Acc. Chem. Res., 2012, 45, 404–413 CrossRef CAS PubMed.
- A. Dreuw and M. Head-Gordon, J. Am. Chem. Soc., 2004, 126, 4007–4016 CrossRef CAS PubMed.
- J. Autschbach, ChemPhysChem, 2009, 10, 1757–1760 CrossRef CAS PubMed.
- T. Yanai, Chem. Phys. Lett., 2004, 393, 51–57 CrossRef CAS PubMed.
- S. Y. Li, Q. Wang, Y. Qian, S. Q. Wang, Y. Li and G. Q. Yang, J. Phys. Chem. A, 2007, 111, 11793–11800 CrossRef CAS PubMed.
- T. Iijima, A. Momotake, Y. Shinohara, T. Sato, Y. Nishimura and T. Arai, J. Phys. Chem. A, 2010, 114, 1603–1609 CrossRef CAS PubMed.
- M. Santra, B. Roy and K. H. Ahn, Org. Lett., 2011, 13, 3422–3425 CrossRef CAS PubMed.
- W. H. Sun, S. Y. Li, R. Hu, Y. Qian, S. Q. Wang and G. Q. Yang, J. Phys. Chem. A, 2009, 113, 5888–5895 CrossRef CAS PubMed.
- C. Schriever, S. Lochbrunner, A. R. Ofial and E. Riedle, Chem. Phys. Lett., 2011, 503, 61–65 CrossRef CAS PubMed.
Footnote |
| † Electronic supplementary information (ESI) available. See DOI: 10.1039/c3ra44900a |
| This journal is © The Royal Society of Chemistry 2014 |


