Graphene-based three-dimensional hierarchical sandwich-type architecture for high performance supercapacitors
Yufei Zhangac,
Mingze Maa,
Jun Yanga,
Wei Huang*ab and
Xiaochen Dong*abd
aJiangsu-Singapore Joint Research Center for Organic/Bio-Electronics & Information Displays and Institute of Advanced Materials (IAM), Nanjing Tech University, 30 South Puzhu Road, Nanjing 211816, China. E-mail: iamwhuang@njut.edu.cn
bKey Laboratory for Organic Electronics & Information Displays (KLOEID), Nanjing Tech University, 30 South Puzhu Road, Nanjing 211816, China. E-mail: iamxcdong@njut.edu.cn
cSchool of Chemistry and Chemical Engineering, Inner Mongolia University, Huhhot 010021, China
dState Key Laboratory of Materials-Oriented Chemical Engineering, Nanjing Tech University, 30 South Puzhu Road, Nanjing 211816, China
First published on 14th January 2014
Abstract
A facile two-step method is developed for large-scale preparation of graphene-based three-dimensional hierarchical sandwich-type architecture (graphene/carbon nanotubes (CNTs)/Mn2O3) for high performance supercapacitor. The synthesis involves a chemical vapor deposition (CVD) method to fabricate sponge-like three-dimensional (3D) graphene/CNTs and an electrodeposition process to deposit Mn2O3 nano-sheets on the surface of 3D graphene/CNTs. With the novel sandwich-type composite as an electrode, the measurements indicate the synergy effects of Mn2O3 and 3D carbonous materials make the electrode present a high specific capacitance. The composite electrode also presents a high reversible capacity, excellent cycle performance and rate capability. It could be concluded that the composite of Mn2O3 with 3D graphene/CNTs displays excellent synergy effects of transition-metal oxide and carbonous materials. This work also inspires in-depth research for the application of 3D graphene-based composites for high performance supercapacitors.
1. Introduction
With the increasing concerns over energy supplies, there has been an urgent demand for cleaner energy storage devices. During the past few years, research into supercapacitors has experienced a massive growth due to their high specific capacitance, pulse power capabilities, and long cycle life.1–5 At present, researchers mainly focus on the highly porous carbon materials because the high surface area of porous carbon electrodes can aggrandize the interaction between the electrolyte ions and the electrode.6,7 In order to develop novel materials capable of accumulating more charge per unit area, several carbon based nanomaterials, such as carbon nanotubes, carbon fibers and graphene have been explored as the electrode materials in supercapacitors.8–11 Among these, graphene, a two-dimensional monolayer of sp2 hybridized carbon atoms, has attracted tremendous interests in recent years due to its extraordinary electrical properties, unusual mechanical strength, and ultra-large specific surface area.12–14 Compared to traditional 3D graphene foam assembled by graphene oxide nano-sheets, the 3D graphene foam, synthesized by CVD with nickel foam as substrate, presents several peculiar advantages.15–17 First, the defect-free and freement of inter-sheet junction-resistance of seamlessly continuous 3D graphene provide the CVD-grown 3D graphene high conductivity. Second, the 3D graphene foam exhibits an extremely high specific surface area due to the overcoming of the strong π–π interaction between graphene sheets. Thus, the porous 3D CVD-grown graphene foam is suitable to make functional composites by surface modification with nano-particles or other functional materials.18 By the combination of graphene and carbon nanotube, it can overcome the shortage of limited effective surface area due to their planar (2D) geometry. Also, the roughness surface of graphene/CNTs is useful for the fabrication of graphene based composite. Various transition-metal oxides have been widely explored for the electrodes of supercapacitors as well.19–22 Among them, manganese oxides (MnO, MnO2, Mn2O3, etc) are generally considered to be one of the most promising transition metal oxides for the next generation of supercapacitors because of its high theoretical capacity, non-toxicity, low cost, great flexibility in structures and morphology and natural abundance.23,24 It is reported that the theoretical electric capacity of manganese oxides can reach 1370 F g−1.25 However, its bad stability and low electrical conductivity led to the difficulties in practical application.26–28 Researches have shown that manganese oxides can obtain better performance by modified with carbonaceous materials which have good cycle stability.29–33With the aim of developing a supercapacitor with high specific capacitance and excellent cycle stability, we synthesized 3D graphene/CNTs by CVD method firstly. Then, Mn2O3 nano-sheets were coated on its surface using electrodeposition to obtain graphene-based 3D hierarchical sandwich-type architecture composites. The electrochemical measurements indicate that the composite electrodes can achieve high specific capacitance and exhibit good cycle stability owing to the synergistic effect of 3D graphene, carbon nanotube and Mn2O3. Hence, the sandwich-type composites provide a direction toward solving the potential problem and are promising for the next generation high-performance electrochemical electrodes.
2. Results and discussion
2.1. Morphology and structure analysis
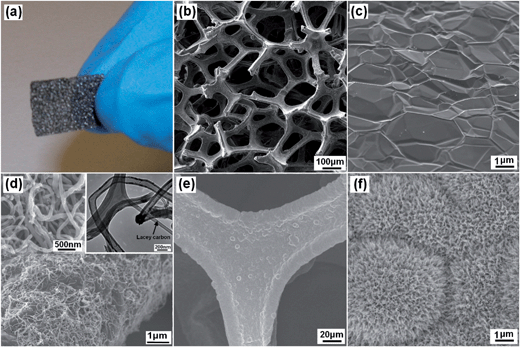
The morphology and structure of 3D graphene/CNTs/Mn2O3 composite were examined by scanning electron microscopy (SEM) and transmission electron microscopy (TEM), respectively, as shown in Fig. 1. The as-prepared graphene foam is monolithic with good mechanical stability and is easily handled (Fig. 1a). An interconnected 3D network structure can be clearly observed in Fig. 1b. The graphene foam exhibits a porous structure with the pore size of 100–300 μm and its skeleton is seamlessly continuous. This structure is useful for the enhancement of its conductivity as the porous structure increase the inter reaction of the electrolyte and the composite electrode. At higher magnification, it indicates the surface of graphene foam is micrometer scale smooth with the similar topographic domains of nickel substrate, as shown in Fig. 1c. After the formation of graphene/CNTs, it can be seen that the CNTs attached on the surface of 3D graphene skeleton and exhibit a dense network structure with the diameter of 100–150 nm (Fig. 1d). The right insert shows the TEM image of the carbon nanotubes, which further confirm the formation of carbon nanotubes with hollow structure. From the Fig. 1e, it can be seen that the skeleton of graphene/CNTs/Mn2O3 composite is fully and uniformly covered by Mn2O3 nano-sheets. The high-resolution SEM image further shows that the Mn2O3 nano-sheets exhibits flower-like nano-structure (Fig. 1f). The unique nanostructure enlarge the surface area of Mn2O3, which is useful for the improvement of its capacitance performance.The Raman spectra were also conducted to measure the structure of graphene, graphene/CNTs and the graphene/CNTs/Mn2O3 composite, as shown in Fig. 2a. 3D graphene shows two distinct peaks at 1575 cm−1 and 2740 cm−1, which are attributed to the G and 2D bands of graphene sheet, respectively.34 As revealed by the integrated intensity ratio of G and 2D bands (IG/I2D) in the Raman spectrum, the 3D graphene consists of single- and few-layer domains.35 It is worth mentioning that the D band (∼1350 cm−1) cannot be discerned on the 3D graphene spectrum, suggesting the high quality of the obtained graphene.36 In comparison with bare graphene, the Raman spectrum of the 3D graphene/CNTs has characteristic D, G and 2D peaks of multi-walled carbon nanotubes. After the formation of graphene/CNTs/Mn2O3 composite, its Raman spectrum not only present the characteristic D, G and 2D peaks of graphene and CNTs, but also exhibits the unique peaks of Mn2O3. The peaks observed around 600 cm−1 are ascribed to the characteristic modes of crystalline Mn–O lattice vibrations.37
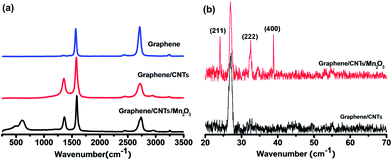 | ||
| Fig. 2 (a) Raman spectra of graphene, graphene/CNTs and graphene/CNTs/Mn2O3. (b) XRD patterns of graphene/CNTs and graphene/CNTs/Mn2O3. | ||
Fig. 2b shows the XRD spectra of graphene/CNTs and graphene/CNTs/Mn2O3 composite, respectively. The peak observed around 25° is the characteristic peak of carbon. The graphene/CNTs/Mn2O3 composite shows strong diffraction peaks, which are well indexed to the (211), (222) and (400) lattice planes of Mn2O3 structure (JCPDS card no.89-2809). The result shows that no impurity phase exists in the graphene/CNTs/Mn2O3 composite. It also confirms that graphene/CNTs/Mn2O3 composite still maintains graphene/CNTs structure after the electrodeposition of Mn2O3.
2.2. Electrochemical testing
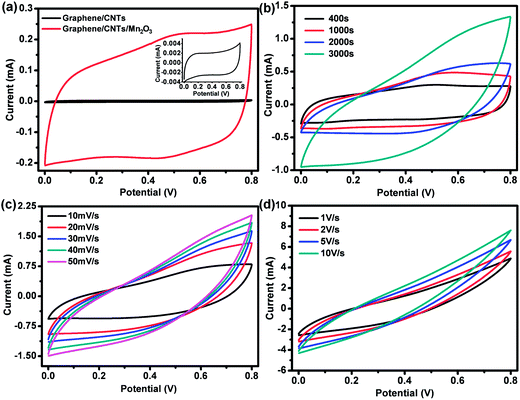
The electrochemical performance of graphene/CNTs and graphene/CNTs/Mn2O3 composite electrode were evaluated by cyclic voltammetry (CV) and galvanostatic charge–discharge measurement, respectively. It is well known that CV is an ideal technique for characterizing the capacitive behavior. As a material for supercapacitor, characteristics such as a large magnitude of current and a rectangular type of voltammogram is ideal. Fig. 3a presents the CV curves over a voltage range from 0 to 0.8 V of the graphene/CNTs and 3000 s electrodeposited graphene/CNTs/Mn2O3 composite electrode measured at a scan rate of 20 mV s−1. It can be seen that the responses of both graphene/CNTs and graphene/CNTs/Mn2O3 electrodes are very close to ideal electrochemical double layer behavior because no polarization was showed. Hahm et al. has analyzed this behavior indicated the electrolyte effectively used the electrode material due to the well-spaced nanostructured geometry.7 Obviously, the area surrounded by the CV curve is dramatically enhanced by the introduction of Mn2O3 onto graphene/CNTs. As known, the area of each closed CV curve suggests its specific capacitance, the increase in area of the CV curve for the graphene/CNTs/Mn2O3 composite compared to the graphene/CNTs indicates the sandwich type architecture has a large enhanced capacitance. The high electronic conductivities of graphene/CNTs materials do not necessarily translate into a high capacitance because the capacitance also depends on other important parameters, such as the pore size, the degree of functionalization, and the accessibility of electrolyte.38 So after depositing Mn2O3, the chemical performance of the composite is greatly improved by both the pseudocapacitive behavior of Mn2O3 and the electrical double layer capacitive behavior of graphene/CNTs.Furthermore, as shown in the Fig. 3a, the redox peak current from the graphene/CNTs/Mn2O3 composite electrode is much larger than that from the graphene/CNTs electrode. Comparing graphene/CNTs/Mn2O3 electrodes prepared by different electrodeposition time at scan rate of 20 mV s−1, it is evident that the CV curve is enhanced by prolonging the electrodeposition time, as shown in Fig. 3b. Increasing the scan rate also leads to further increase of the redox peaks current (Fig. 3c), confirming the pseudocapacitive behavior of the composite electrode and a surface-confined electrochemical process. Further increase the scan rate to 1, 2, 5 and 10 V s−1 within 0.0–0.8 V voltage window, the electrode still present the rectangular shape even at a high scan rate of 10 V s−1, indicating the electrode processes the characteristic of ideal electrochemical double layer capacitive behavior even at such high areal density. This feature is contributed from synergistic effects by the combined 3D graphene, CNTs and Mn2O3. Therefore, it can be concluded that ultrahigh power can be obtained from this kind of device.39
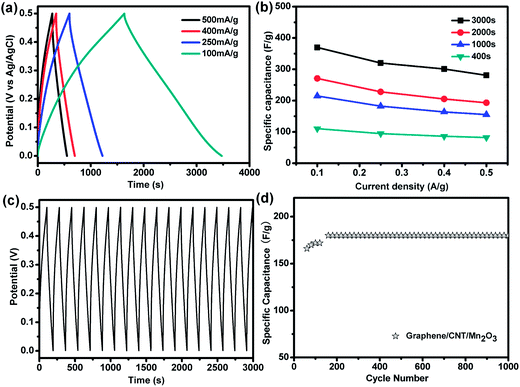
Fig. 4a depicts the galvanostatic charge–discharge curves of the graphene/CNTs/Mn2O3 sandwich electrode prepared by electrodeposition for 3000 s at different current densities. The specific capacitance could be calculated from the following equation:40
| C = I × Δt/(m × ΔV) | (1) |
Fig. 4b shows effect of electrodeposition time on the specific capacitance of graphene/CNTs/Mn2O3 at various discharge current densities calculated from the formula (1). It can be seen that the specific capacitance increased with prolonging the deposition time. These could be attribute to the fact that the mass of the Mn2O3 is unsurprisingly increased as the deposition time extended. However, continue extending the deposition time over the optimal range, the morphology of the sample could be changed and lead to the reduction of the specific surface area of Mn2O3 exposed to electrolyte ions, which results in the decrease of the specific capacitance.41 Therefore, the optimal composite is electrodeposited for 3000 s. TGA analysis indicates that the weight percentage of Mn2O3 in the electrodes deposited 1000 s, 2000 s and 3000 s is about 36%, 66% and 72%, respectively.
More importantly, the 3000 s electrodeposited graphene/CNTs/Mn2O3 sandwich type porous composite electrode has a good columbic efficiency for each cycle of charge and discharge, which indicates a good electrochemical stability (Fig. 4c). Even after many times of charge–discharge cycle (>1000 cycles), the charge–discharge curves remain symmetric. These may be attributed to the synergistic effect of 3D graphene, CNTs and Mn2O3. Graphene and CNTs, with good conductivity, can support the nano-scaled Mn2O3 and improve the contact between the active materials and the electrolyte. It also provide electronically conductive channels for electrons to enlarge the interface between the composites and electrolyte. Furthermore, CNTs can change the roughness of the surface, which makes Mn2O3 tightly attached on the electrode and improves the stability of the electrodes.
Fig. 4d shows evolution of the specific capacitance versus the cycle number at a current density of 1 A g−1. It can be seen that the specific capacitance of the 3000 s deposited composite electrode can be further enhanced at the initial cycles and stays stable afterwards. Such activation process may result from the more complete intercalation and de-intercalation of electrochemical species after several initial cycles. After that, the specific capacitance is very stable. These results reveal that the high specific capacitance, remarkable rate capability and excellent cycle stability for supercapacitors of the graphene/CNTs/Mn2O3 composite electrode. These remarkable electrochemical performance could certainly be attributed to two reasons. First, the conductive graphene and CNTs could enhance the specific capacitances of Mn2O3 through improving their electrical conductivity. Second, the flower-like Mn2O3 has large surface area, which increase the pseudocapacitive reactions between manganese oxides and Na+ occurred on their surface.42
To further evaluate the electrochemical behaviors of the graphene/CNTs/Mn2O3 electrode prepared by electrodeposition for 400, 1000, 2000 and 3000 s, respectively, the Nyquist plots of different electrodes were presented in Fig. 5. The impedance curves were carried out in a frequency of 1 Hz to 10 kHz. It can be seen that each sample exhibits a straight oblique line in the low-frequency range. The more vertical curve suggests the better capacitive behavior of supercapacitor assembly.43 The 3000 s deposited sample shows the best vertical curve compared to the others, suggesting the best capacitive behavior. This may be attributed to the highly reversible redox reactions associated with Mn2O3 nanoparticles along with better electrical conductivity provided by the graphene and CNTs.44
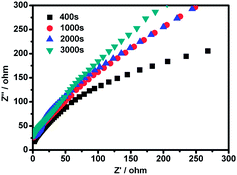 | ||
| Fig. 5 The Nyquist plot of graphene/CNTs/Mn2O3 electrodes prepared in 400, 1000, 2000 and 3000 s, respectively. | ||
3. Conclusions
In summary, graphene-based 3D hierarchical sandwich-type architecture with high specific capacitance were fabricated with a facile chemical vapor deposition and electrodeposition procedure. Serving as a free-standing electrode for supercapacitor, 3D graphene along with the electrodeposited Mn2O3 provided the sandwich type electrode a porous structure, which makes electrolyte fully access to Mn2O3 easily and improves the specific performances of graphene/CNTs/Mn2O3 electrodes dramatically. The electrochemical measurement indicates that the sandwich-type composite electrode exhibits excellent electrochemical activity even at the scan rate of 10 V s−1. The excellent cycle stability and supercapacitor performance attributed to its large active surface area and rapid charge transfer rate, which allowed the electrolyte easily transfer during the rapid charge–discharge process. These results suggest that porous structure enabled by the synergistic effects of carbonous materials and metal oxide may offer a promise for the development of high-performance supercapactiors.4. Experimental section
4.1. Synthesis of 3D graphene/CNTs
The 3D graphene/CNTs were synthesized by a two-step CVD method. Firstly, the 3D graphene foam was synthesized by CVD using nickel foam (thickness 1.0 mm) as the substrate and ethanol as the precursor under atmospheric pressure.45,46 After 20 min growth, the obtained graphene/Ni foams were immersed into NiCl2 solution (0.1 mM) containing 7% (w/w) polyethylene glycol for 3 min and dried in air. Subsequently, the graphene/nickel foams were loaded into a quartz tube for the CVD growth of carbon nanotubes at 750 °C for 40 min, still using ethanol as the precursor. Finally, the Ni substrates were etched away using 3 M HCl at 80 °C overnight to leave the free-standing 3D graphene/CNTs.4.2. Synthesis of graphene/CNTs/Mn2O3 composites
The sandwich-type porous graphene/CNTs/Mn2O3 sandwich electrode were prepared by a following electrochemical deposition step after obtaining the 3D graphene/CNTs composites.47,48 The electrodeposition was performed using an electrochemical workstation (CHI 760D, CH instrument Inc, China) with graphene/CNTs as working electrode, Pt foil as counter electrode and Ag/AgCl as reference electrode. A constant potential of 1.0 V was applied in an aqueous solution of 0.01 mol L−1 manganese acetate for 400, 1000, 2000 and 3000 s, respectively. The products was then washed with double-distilled water several times and dried by nitrogen atmosphere. Finally, the sample was calcinated at 200 °C in air for 3 h to obtain the highly crystalline Mn2O3 on the surface of graphene/CNTs.4.3. Materials characterization
3D graphene/CNTs was observed with scanning electron microscopy (SEM) (JOEL JSM-6700F) and transmission electron microscopy (TEM) (JEOL JEM-1400F). The Raman spectra (excited at 488 nm) were obtained by a Confocal Raman microscope (CRM200, WITec). The X-ray diffraction (XRD) was carried out on a Bruker D8 Advanced Diffractometer using Cu Kα radiation. Thermal gravimetric analysis (TGA) was carried out with simultaneous thermal analyzer (STA449F3).4.4. Electrochemical tests
All electrochemical measurements were carried out using an electrochemical workstation (CHI 760D, CH instrument Inc, China). A conventional three-electrode system was employed with 3D graphene/CNTs/Mn2O3 composite electrode as the working electrode, Ag/AgCl electrode as the reference, and platinum plate as the counter electrode. 1.0 M Na2SO4 was used as electrolyte for all the electrochemical tests.Acknowledgements
The authors gratefully acknowledge the financial support by Jiangsu Provincial Founds for Distinguished Young Scholars (BK20130046), the NNSF of China (21275076, 61328401), the Key Project of Chinese Ministry of Education (2012058), Research Fund for the Doctoral Program of Higher Education of China (20123223110008), the opening project of the State Key Laboratory of Materials-Oriented Chemical Engineering in Nanjing Tech University (KL12-04).References
- B. E. Conway, J. Electrochem. Soc., 1991, 138, 1539 CrossRef CAS PubMed.
- M. Winter and R. J. Brodd, Chem. Rev., 2004, 104, 4245 CrossRef CAS.
- H. Wang, H. S. Casalongue, Y. Liang and H. Dai, J. Am. Chem. Soc., 2010, 132, 7472 CrossRef CAS PubMed.
- J. R. Miller and P. Simon, Science, 2008, 321, 651 CrossRef CAS PubMed.
- P. Simon and Y. Gogotsi, Nat. Mater., 2008, 7, 845 CrossRef CAS PubMed.
- H. J. In, S. Kumar, Y. Shao-Horn and G. Barbastathis, Appl. Phys. Lett., 2006, 88, 083104 CrossRef PubMed.
- M. G. Hahm, A. L. M. Reddy, D. P. Cole, M. Rivera, J. A. Vento, J. Nam, H. Y. Jung and Y. L. Kim, et al., Nano Lett., 2012, 12, 5616 CrossRef CAS PubMed.
- X. C. Dong, G. C. Xing, M. B. Chan-Park, W. H. Shi, N. Xiao, J. Wang, Q. Y. Yan, T. C. Sum, W. Huang and P. Chen, Carbon, 2011, 49, 5071 CrossRef CAS PubMed.
- A. L. M. Reddy and S. Ramaprabhu, J. Phys. Chem. C, 2007, 111, 16138 CAS.
- D. N. Futaba, K. Hata, T. Yamada, T. Hiraoka, Y. Hayamizu, Y. Kakudate, O. Tanaike, H. Hatori, M. Yumura and S. Iijima, Nat. Mater., 2006, 5, 987 CrossRef CAS PubMed.
- S. Park, K. Lian and Y. Gogotsi, J. Electrochem. Soc., 2009, 156, 921 CrossRef PubMed.
- A. K. Geim and K. S. Novoselov, Nat. Mater., 2007, 6, 183 CrossRef CAS PubMed.
- G. Eda and M. Chhowalla, Adv. Mater., 2010, 22, 2392 CrossRef CAS PubMed.
- Y. W. Zhu, S. Murali, W. W. Cai, X. S. Li, J. W. Suk, J. R. Potts and R. S. Ruoff, Adv. Mater., 2010, 22, 3906 CrossRef CAS PubMed.
- Z. P. Chen, W. C. Ren, L. B. Gao, B. L. Liu, S. F. Pei and H. M. Cheng, Nat. Mater., 2011, 10, 424 CrossRef CAS PubMed.
- X. C. Dong, C. Y. Su, W. J. Zhang, J. W. Zhao, Q. D. Ling, W. Huang, P. Chen and L. J. Li, Phys. Chem. Chem. Phys., 2010, 12, 2164 RSC.
- S. Agarwal, X. Zhou, F. Ye, Q. He, G. C. Chen, J. Soo, F. Boey, H. Zhang and P. Chen, Langmuir, 2010, 26, 2244 CrossRef CAS PubMed.
- X. Huang, X. Y. Qi, F. Boey and H. Zhang, Chem. Soc. Rev., 2012, 41, 666 RSC.
- R. R. Bi, X. L. Wu, F. F. Cao, L. Y. Jiang, Y. G. Guo and L. J. Wan, J. Phys. Chem. C, 2010, 114, 2448 CAS.
- Y. Shan and L. Gao, Mater. Chem. Phys., 2007, 103, 206 CrossRef CAS PubMed.
- L. Yuan, X. H. Lu, X. Xiao, T. Zhai, J. Dai, F. Zhang, B. Hu, X. Wang, L. Gong and J. Chen, et al., ACS Nano, 2011, 6, 656 CrossRef PubMed.
- S. Chen, J. W. Zhu, X. D. Wu, Q. F. Han and X. Wang, ACS Nano, 2009, 4, 2822 CrossRef PubMed.
- G. Yu, L. Hu, M. Vosgueritchian, H. Wang, X. Xie, J. R. McDonough, X. Cui, Y. Cui and Z. Bao, Nano Lett., 2011, 11, 2905 CrossRef CAS PubMed.
- A. E. Fischer, K. A. Pettigrew, D. R. Rolison, R. M. Stroud and J. W. Long, Nano Lett., 2007, 7, 281 CrossRef CAS PubMed.
- S. H. Li, Q. H. Liu and L. Qi, Chin. J. Anal. Chem., 2012, 40(3), 339 CAS.
- L. Wei, C. Li, H. Chu and Y. Li, Dalton Trans., 2011, 40, 2332 RSC.
- W. Wei, X. Cui, W. Chen and D. G. Ivey, Chem. Soc. Rev., 2011, 40, 1697 RSC.
- Z. Li, Y. Mi, X. Liu, S. Liu, S. Yang and J. Wang, J. Mater. Chem., 2011, 21, 14706 RSC.
- L. Wang and D. L. Wang, Electrochim. Acta, 2011, 56, 5010 CrossRef CAS PubMed.
- J. H. Kim, K. H. Lee, L. J. Overzet and G. S. Lee, Nano Lett., 2011, 11, 2611 CrossRef CAS PubMed.
- L. L. Zhang, X. Zhao, M. D. Stoller, Y. Zhu, H. Ji, S. Murali, Y. Wu, S. Perales, B. Clevenger and R. S. Ruoff, Nano Lett., 2012, 12, 1806 CrossRef CAS PubMed.
- S. W. Lee, J. Kim, S. Chen, P. T. Hammond and Y. Shao-Horn, ACS Nano, 2010, 4, 3889 CrossRef CAS PubMed.
- J. Liu, J. Essner and J. Li, Chem. Mater., 2010, 22, 5022 CrossRef CAS.
- X. C. Dong, Y. M. Shi, Y. Zhao, D. M. Chen, J. Ye, Y. G. Yao, F. Gao, Z. H. Ni, T. Yu and Z. X. Shen, et al., Phys. Rev. Lett., 2009, 102, 135501 CrossRef.
- Z. Chen, W. Ren, L. Gao, B. Liu, S. Pei and H. M. Cheng, Nat. Mater., 2011, 10, 424 CrossRef CAS PubMed.
- X. C. Dong, D. L. Fu, W. J. Fang, Y. M. Shi, P. Chen and L. J. Li, Small, 2009, 5, 1422 CrossRef CAS PubMed.
- L. Mao, K. Zhang, H. S. O. Chan and J. S. Wu, J. Mater. Chem., 2012, 22, 1845 RSC.
- Z. D. Huang, B. Zhang, R. Liang, Q. B. Zheng, S. W. Oh, X. Y. Lin, N. Yousefi and J. K. Kim, Carbon, 2012, 50, 4239 CrossRef CAS PubMed.
- D. Pech, M. Brunet, H. Durou, P. H. Huang, V. Mochalin, Y. Gogotsi, P. L. Taberna and P. Simon, Nat. Nanotechnol., 2010, 5, 651 CrossRef CAS PubMed.
- C. G. Liu, Z. Yu, D. Neff, A. Zhamu and B. Z. Jang, Nano Lett., 2010, 10, 4863 CrossRef CAS PubMed.
- H. C. Gao, F. Xiao, C. B. Ching and H. W. Duan, ACS Appl. Mater. Interfaces, 2012, 4, 2801 CAS.
- J. Yan, Z. Fan, T. Wei, W. Qian, M. Zhang and F. Wei, Carbon, 2010, 48, 3825 CrossRef CAS PubMed.
- M. D. Stoller, S. Park, Y. Zhu, J. An and R. S. Ruoff, Nano Lett., 2008, 8, 3498 CrossRef CAS PubMed.
- A. K. Mishra and S. Ramaprabhu, J. Phys. Chem. C, 2011, 115, 14006 CAS.
- M. W. Xu, D. D. Zhao, S. J. Bao and H. L. Li, J. Solid State Electrochem., 2007, 11, 1101 CrossRef CAS PubMed.
- X. C. Dong, B. Li, A. Wei, X. H. Cao, M. Park, H. Zhang, L. J. Li, W. Huang and P. Chen, Carbon, 2011, 49, 2944 CrossRef CAS PubMed.
- P. Si, X. C. Dong, P. Chen and D. H. Kim, J. Mater. Chem. B, 2013, 1, 110 RSC.
- X. C. Dong, Y. W. Ma, G. Y. Zhu, Y. X. Huang, J. Wang, M. B. Chan-Park, L. H. Wang, W. Huang and P. Chen, J. Mater. Chem., 2012, 22, 17044 RSC.
| This journal is © The Royal Society of Chemistry 2014 |

