Synthesis and characterization of lignin-based carbon materials with tunable microstructure†
Sabornie Chatterjee*a,
Amy Clingenpeelb,
Amy McKennac,
Orlando Riosa and
Alexander Johs*a
aOak Ridge National Laboratory, Oak Ridge, TN 37831, USA. E-mail: johsa@ornl.gov; saborniec@gmail.com; Fax: +1 865 576 8646; Tel: +1 865 574 7444
bDepartment of Chemistry and Biochemistry, Florida State University, 95 Chieftain Way, Tallahassee, FL 32306, USA
cNational High Magnetic Field Laboratory, Florida State University, 1800 East Paul Dirac Dr., Tallahassee, FL 32310-4005, USA
First published on 2nd December 2013
Abstract
Lignin-based carbons can be used as a low-cost alternative to graphite and petroleum-based carbons enabling the production of sustainable, functional carbon materials for various applications. The microstructure development of these carbons can be controlled through chemical modification of the lignin precursor and choice of carbonization parameters. In this work, microstructured carbon materials are synthesized from lignin using a combination of chemical modification and carbon fiber processing techniques. Lignin is modified by incorporating different ester groups which results in a precursor highly compatible with melt processing using the fiber extrusion technique and conversion into microstructured carbons by oxidative stabilization and subsequent carbonization. Furthermore, the impact of esterifications on precursor chemistry and carbonizations is investigated. A nuclear magnetic resonance study of modified lignins shows characteristic spectral changes as a result of esterifications. Ultrahigh resolution Fourier transform ion cyclotron resonance mass spectrometry shows the modification process does not affect the polymeric character of the lignin backbone. Esterifications result in moderate shifts in O![[thin space (1/6-em)]](https://www.rsc.org/images/entities/char_2009.gif) :
:![[thin space (1/6-em)]](https://www.rsc.org/images/entities/char_2009.gif) C and H
C and H![[thin space (1/6-em)]](https://www.rsc.org/images/entities/char_2009.gif) :
:![[thin space (1/6-em)]](https://www.rsc.org/images/entities/char_2009.gif) C ratios. Thermogravimetric analysis of lignins reveals distinct differences in mass loss trends during oxidations and carbonizations.
C ratios. Thermogravimetric analysis of lignins reveals distinct differences in mass loss trends during oxidations and carbonizations.
Introduction
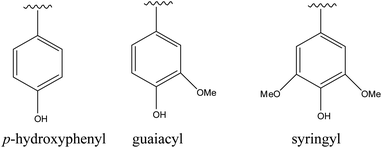
Lignin, a carbon-rich renewable resource, is the second most abundant biopolymer in nature after cellulose.1,2 Lignin is a polyphenol with a three dimensional structure consisting of randomly cross-linked phenyl propane building blocks which are p-hydroxyphenyl (H), guaiacyl (G) and syringyl (S) (Fig. 1).3 The relative distributions of these monomeric units in any lignin type depend on the plant source. The typical S/G ratios in hardwood and softwood lignins are 2![[thin space (1/6-em)]](https://www.rsc.org/images/entities/char_2009.gif) :
:![[thin space (1/6-em)]](https://www.rsc.org/images/entities/char_2009.gif) 1 and 1
1 and 1![[thin space (1/6-em)]](https://www.rsc.org/images/entities/char_2009.gif) :
:![[thin space (1/6-em)]](https://www.rsc.org/images/entities/char_2009.gif) 2–1
2–1![[thin space (1/6-em)]](https://www.rsc.org/images/entities/char_2009.gif) :
:![[thin space (1/6-em)]](https://www.rsc.org/images/entities/char_2009.gif) 3 respectively.4
3 respectively.4
Commercial lignins are primarily obtained as a by-product of various industrial processes such as the organosolv pulping process, sulfite pulping methods used in the paper and pulp industry and enzymatic hydrolysis of biomass for bioethanol production. The U.S. Renewable Fuels Standard (RFS) sets a mandatory target of producing 16 billion gallons of lignocellulosic biofuels (mainly ethanol) by 2022.5 Similarly, the European Union as a whole has set a target to increase the number of biorefineries.1 These policies would inevitably result in a sustained supply of enormous amounts of lignin. If utilized properly, this lignin could further improve the economic viability of bio-derived alternative fuels.
The low cost and abundant availability of lignin have made it an attractive starting material for many applications, which can be divided mainly into two categories: First, various catalytic methods are applied to convert lignin into value-added chemicals. Different types of oxidations,6–11 hydrodeoxygenation (HDO),12,13 catalytic cracking,14,15 etc. are employed to generate chemicals and value added chemical intermediates from lignin. In the other case, lignin is used to make various polymeric materials.2,16–19 Researchers have also used lignin in making adhesives,20 surfactants,21 etc. This paper describes the synthesis of lignin-based microstructured graphitic carbon materials that show promise for use as an anode component in Li-ion batteries or as a supercapacitor material.
There is a growing demand for high capacity, re-usable and less expensive energy storage solutions. The most commonly used anode material for Li-ion batteries is graphite,22–24 which can insert lithium reversibly.25,26 Conventional graphitic anode materials require significant processing before they become part of the final product. Anodes made from battery-grade graphite are highly sensitive to electrolyte solutions, which can promote exfoliation and formation of an unstable solid electrolyte interface (SEI) resulting in loss of capacity and failure.23 These limitations drive the development of microstructured carbon materials that can insert Li ions at higher capacity and increased cycling stability in a wide spectrum of electrolyte solutions. Techniques such as gas phase reaction of liquid propane gas,27 use of mesophase pitch based carbon fibers,28 pretreatment with gelatine,29 use of chemical vapor deposited carbon cloth,23 etc. have been explored to obtain a variety of disordered carbons for use as anode materials. However, most of these methods are complex and require expensive precursors. Lignin-based carbon materials could offer some distinct advantages over graphite as an anode material. These carbon materials exhibit a microstructure with a high degree of turbostratic disorder which has been linked to chemical stability in aggressive electrolytes that destroy battery grade graphites.30 In addition, fused carbon fibers could assume the role of a current collector.31
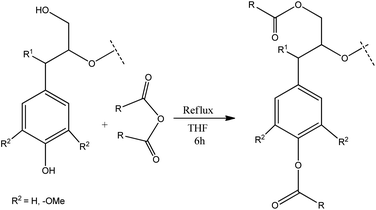
Several oxidative methods have been described to synthesize microstructured graphitic materials industrially. However, direct application of classic oxidative methods to lignin based materials is challenging due to the disordered nature of the biopolymer. Therefore, in this work, we present an alternative route combining chemical modifications with melt processing techniques to obtain functional lignin carbon fibers. This approach comprises chemical modification of specific functional groups in lignin as a method to process a lignin into a microstructured material after oxidation and carbonization. Lignin is chemically modified by esterification using dicarboxylic acid anhydrides which react with hydroxyl groups on lignin (Fig. 2). Acetic, phthalic, succinic and maleic anhydrides are used for esterification reactions. The structural and thermal properties of the lignin-ester groups resulting from modification with each of these anhydrides modulate the microstructure development during oxidation and carbonization. Thus, the final carbon fiber exhibits unique structural properties, based on the type of lignin precursor modification. For example, a cyclic anhydride such as phthalic, succinic or maleic may form di-esters with lignin, whereas acetic anhydride could only form a monoester. Modification of lignin with phthalic anhydride would result in an overall shift from a hydrophilic to a more hydrophobic character. Double bonds in maleic anhydride may favor enhanced cross conjugation among lignin structural units. However, in all cases, esterification has been shown to improve melt processability,32 which in turn enables the fabrication of microstructured carbons from lignin using carbon fiber process technology. Lignin carbon fibers are generally prepared by converting lignin to a precursor fiber by melt spinning or wet spinning.33 The precursor carbon fiber then undergoes thermostabilization which prevents sticking, shrinking, melting of lignin biopolymer fiber during subsequent carbonization.16,34 During thermostabilization at temperatures below 250 °C oxidation reactions prevail, which increase the oxygen content of precursor fibers. At temperatures above 250 °C, the oxygen content of precursor fibers decreases. This process can be described by considering the chemistry of thermostabilization of pitch, where at lower temperatures; alcohols, phenol, alkyl ethers, aldehydes, ketones, carboxylic acids, etc. are formed by oxygenation.35,36 Above 250 °C, concerted decarboxylation type eliminations occur which decrease the overall mass of the material.36 In the final stage, the stabilized carbon fiber precursors are carbonized. At temperatures above 900 °C, all functional groups are eliminated and a highly aromatic carbon backbone remains.36 In particular, during high temperature thermostabilization and the initial stages of carbonization, various functional groups on lignin undergo thermal dehydration, decarboxylation, and condensation reactions resulting in the formation of volatile H2O, CO2 and CO,34,35,37 With modified lignin samples, additional ester groups on lignin modulate the progression of these reactions, which in turn facilitates the development of microscale porosity and a carbon material with turbostratic disorder.
The impact of the chemical modification on the lignin structure was characterized by NMR. In addition, high resolution FT-ICR MS was used to identify potential changes in the lignin polymer characteristics as a result of the modification process. The impacts of the modifications on oxidative stabilization and subsequent carbonization were studied by thermogravimetric analysis (TGA). Finally, the surface area of carbon derived from modified lignin was measured by the BET method.
Experimental
Materials
The primary lignin type used in this study was solvent extracted hardwood lignin. This type of lignin is obtained by extraction using an ethanol–water (50 wt%) mixture, in situ formed acetic acid at about 195 °C and a pressure of about 3 MPa.38 The extraction process used for this type lignin is much milder than the Kraft and sulfite pulping processes. This reduces the amount of secondary condensation reactions and results in lignin with lower molecular weights and greater solubility in organic solvents such as tetrahydrofuran (THF). Lignin generated with this process does not contain any significant amounts of sulfur. Also, the level of impurities and ash-content are very low for organosolv lignins. The organosolv hardwood lignin is very hydrophobic and has a low softening point, and low glass transition temperature.33 All lignin samples were dried under vacuum at 80 °C for 48 h before use in reactions. All other chemicals and reagents including acid anhydrides (acetic, succinic, phthalic and maleic) and solvents were purchased from Sigma Aldrich, USA and used as received.Reactions
All reactions were conducted with a 1![[thin space (1/6-em)]](https://www.rsc.org/images/entities/char_2009.gif) :
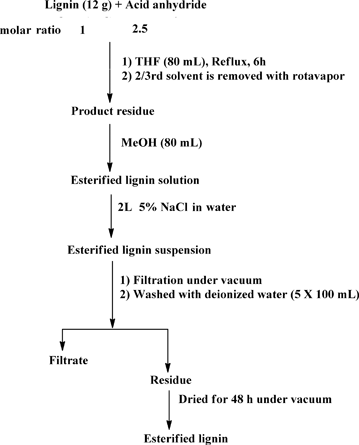
:![[thin space (1/6-em)]](https://www.rsc.org/images/entities/char_2009.gif) 2.5 lignin hydroxyl to acid anhydride molar ratio (assuming approximately 5 mmol of total hydroxyl groups per 1 g of organosolv lignin)39 (Scheme 1). Since hydroxyls are the most abundant functional groups in lignin, the chosen amount of acid anhydride should be sufficient for quantitative conversion of the hydroxyl groups. In all cases, lignin (12 g) was dissolved in anhydrous THF (80 mL) under ambient conditions. Magnetic stirring was used in all reactions. Acid (phthalic, acetic, succinic or maleic) anhydride was added to the lignin solution under stirring. The reaction mixture was heated to 70 °C and kept under reflux for a period of 6 h. After completion of the reaction, the product mixture was cooled to room temperature (RT) and the solvent was removed using a rotary evaporator until the volume of the reaction mixture reached about a third of the initial volume. The residue was dissolved in methanol (MeOH) (80 mL). This mixture was added slowly to a 5% solution of sodium chloride (NaCl) in deionized water (2 L) under vigorous stirring with a magnetic stir bar. This salting out procedure resulted in a lignin suspension which was filtered under vacuum using a Buchner-funnel. The residue was washed five times with water (5 × 100 mL) to remove any residual acids and NaCl. Subsequently, the residue was dried under vacuum over a silica gel as a desiccant to obtain the modified lignin in a powdered form.
2.5 lignin hydroxyl to acid anhydride molar ratio (assuming approximately 5 mmol of total hydroxyl groups per 1 g of organosolv lignin)39 (Scheme 1). Since hydroxyls are the most abundant functional groups in lignin, the chosen amount of acid anhydride should be sufficient for quantitative conversion of the hydroxyl groups. In all cases, lignin (12 g) was dissolved in anhydrous THF (80 mL) under ambient conditions. Magnetic stirring was used in all reactions. Acid (phthalic, acetic, succinic or maleic) anhydride was added to the lignin solution under stirring. The reaction mixture was heated to 70 °C and kept under reflux for a period of 6 h. After completion of the reaction, the product mixture was cooled to room temperature (RT) and the solvent was removed using a rotary evaporator until the volume of the reaction mixture reached about a third of the initial volume. The residue was dissolved in methanol (MeOH) (80 mL). This mixture was added slowly to a 5% solution of sodium chloride (NaCl) in deionized water (2 L) under vigorous stirring with a magnetic stir bar. This salting out procedure resulted in a lignin suspension which was filtered under vacuum using a Buchner-funnel. The residue was washed five times with water (5 × 100 mL) to remove any residual acids and NaCl. Subsequently, the residue was dried under vacuum over a silica gel as a desiccant to obtain the modified lignin in a powdered form.
Characterization and analyses of modified organosolv lignin
The melting and softening properties of unmodified and modified lignins were determined using a Fisher-Johns melting point apparatus. A small amount of lignin powder was placed between two microscope cover slips and was then placed on the heating element of the apparatus. An approximate heating rate of 2–3 °C was used to melt the samples. Temperature readings of initial softening, localized melting, appreciable melting and complete melting of each lignin sample were recorded. Each measurement was repeated twice.The HMQC NMR protocol has 512 increments and 32 scans per increment in the F2 direction. A 90° pulse with a pulse delay of 1.5 s, an acquisition time of 0.13 s, and a single bond C–H coupling constant of 147 Hz were employed. HMQC runs were carried out at RT without spinning and typically required about 16 h. Free induction decays (FIDs) were processed using Mnova NMR software, version 8.1 (Mestrelab Research). For HMQC spectroscopy analysis, a previously published protocol was followed.3
![[thin space (1/6-em)]](https://www.rsc.org/images/entities/char_2009.gif) :
:![[thin space (1/6-em)]](https://www.rsc.org/images/entities/char_2009.gif) 50 (MeOH
50 (MeOH![[thin space (1/6-em)]](https://www.rsc.org/images/entities/char_2009.gif) :
:![[thin space (1/6-em)]](https://www.rsc.org/images/entities/char_2009.gif) THF) with 1% (by volume) ammonium hydroxide (NH4OH) for negative ESI (electrospray ionization) prior to FT-ICR mass spectral analysis.40,41 FT-ICR MS analyses were performed on a custom built FT-ICR mass spectrometer coupled to a room temperature 9.4 T superconducting magnet (Oxford, UK).42 Data acquisition was done with a modular ICR data station (PREDATOR).43 Multiple (100) individual time-domain transients were coadded, Hanning-apodized, zero-filled, and fast Fourier transformed prior to frequency conversion to mass-to-charge ratios to obtain the final mass spectrum.44 Peak lists were generated with custom-built software (MIDAS) for all peaks with signal magnitude greater than six times the baseline RMS noise. The spectra were internally calibrated based on the “walking” calibration45 with the highly abundant homologous O2 series, which differ in mass by 14.01565 Da (mass of a CH2). IUPAC mass can be converted to Kendrick mass46 (Kendrick mass = IUPAC mass × (14/14.01565)) to facilitate rapid identification of compounds that differ in mass by 14 Da. Compounds with the same heteroatom content (nitrogen, oxygen, sulfur) but differ by degree of alkylation are grouped together for rapid identification of homologous series.47
THF) with 1% (by volume) ammonium hydroxide (NH4OH) for negative ESI (electrospray ionization) prior to FT-ICR mass spectral analysis.40,41 FT-ICR MS analyses were performed on a custom built FT-ICR mass spectrometer coupled to a room temperature 9.4 T superconducting magnet (Oxford, UK).42 Data acquisition was done with a modular ICR data station (PREDATOR).43 Multiple (100) individual time-domain transients were coadded, Hanning-apodized, zero-filled, and fast Fourier transformed prior to frequency conversion to mass-to-charge ratios to obtain the final mass spectrum.44 Peak lists were generated with custom-built software (MIDAS) for all peaks with signal magnitude greater than six times the baseline RMS noise. The spectra were internally calibrated based on the “walking” calibration45 with the highly abundant homologous O2 series, which differ in mass by 14.01565 Da (mass of a CH2). IUPAC mass can be converted to Kendrick mass46 (Kendrick mass = IUPAC mass × (14/14.01565)) to facilitate rapid identification of compounds that differ in mass by 14 Da. Compounds with the same heteroatom content (nitrogen, oxygen, sulfur) but differ by degree of alkylation are grouped together for rapid identification of homologous series.47In order to evaluate surface area of modified carbon materials, these materials were used to prepare melt-spun fibers using a Dynisco laboratory mixing extruder. The fiber was thermally stabilized and carbonized before BET surface area measurements.
Results and discussions
All esterification reactions resulted in moderate to good yields of modified lignin (Table 1). Reaction with maleic anhydride gave the lowest yield.| Acid anhydride | Initial mass of lignin (g) | Mass of acid anhydride (g) | Solvent | Mass of modified lignin (g) |
|---|---|---|---|---|
| a Reactions were conducted for 6 h under reflux conditions in open atmosphere. | ||||
| 1. Phthalic | 12 | 22.2 | THF | 14.1 |
| 2. Succinic | 12 | 15 | THF | 12.7 |
| 3. Acetic | 12 | 15.3 | THF | 13.1 |
| 4. Maleic | 12 | 14.7 | THF | 12.4 |
Initial softening points of all esterified lignins were found to be lower than the unmodified lignin (Table 2). However, the differences between the complete melting temperatures of modified and unmodified lignins were negligible. Near the complete melting point, the unmodified lignin started to solidify which indicated heat-induced cross-linking reactions in the material. Among esterified lignin samples, only maleic anhydride modified lignin showed this behavior.
| Melting characterizations (°C) | ||||
|---|---|---|---|---|
| Sample | Initial softening | Localized melting | Appreciable melting | Complete melting |
| a A heating rate of 2–3 °C min−1 is used. | ||||
| Unmodified Lignin | 140 | 145 | 150 | 160 |
| Phthalic anhydride modified | 132 | 138 | 144 | 158 |
| Succinic anhydride modified | 126 | 134 | 142 | 156 |
| Acetic anhydride modified | 116 | 128 | 140 | 153 |
| Maleic anhydride modified | 116 | 130 | 143 | 155 |
The reaction of acid anhydrides with lignin hydroxyl groups is primarily an acyl substitution reaction under neutral conditions. Reactions begin with a slow equilibrium addition of the nucleophile to the carbonyl carbon (Fig. 3). This is subsequently followed by a rapid departure of the alkoxy (–O–R) part of the corresponding acid anhydride to form the nucleophilic acyl substitution product. All three lignin monomeric units have a terminal aliphatic hydroxyl group at C-γ on the side chain in addition to a phenolic hydroxyl groups at C-4 of the aromatic ring. Thus, the reaction of lignin with acid anhydrides under neutral conditions may result in a product with both aliphatic and phenolic hydroxyl groups esterified. Moreover, the reaction involving cyclic anhydrides (phthalic, succinic or maleic) can increase cross-linking in lignin by reacting with two hydroxyl groups simultaneously. However, according to a previous research report diester formation by a cyclic anhydride is negligible below 100 °C.48 Since all reactions reported in this work were performed at 70 °C, formation of diesters by a cyclic anhydride should be negligible. At room temperature, reactions with acid chlorides kinetically favor the esterification of aliphatic hydroxyl groups.48 With a longer reaction time, esterifications of both phenolic and aliphatic hydroxyl groups can occur. Thus, most of the available free hydroxyl groups of lignin would be esterified due to relatively long reaction time (6 h).
NMR results
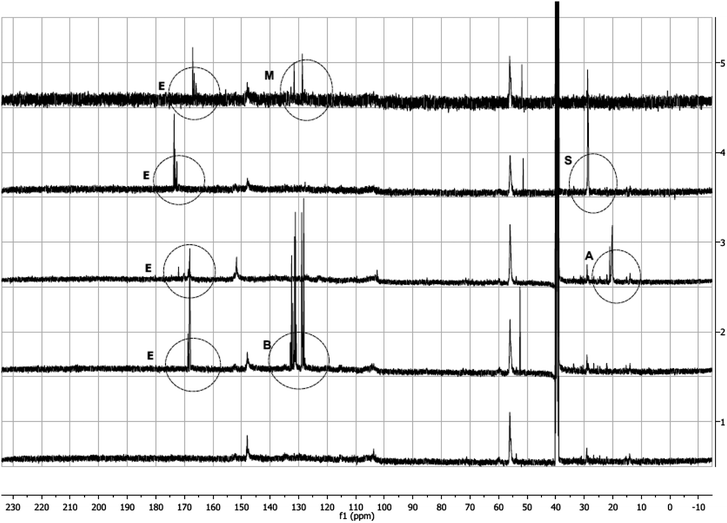
13C (Fig. 4) and 1H (ESI,† Fig. 2–5) NMR spectra of modified lignins show characteristic features corresponding to the chemical modification applied. In 13C spectra, characteristic spectral changes between 10–40 and 100–200 ppm can be assigned to methyl and carbonyl carbons of resulting esters, respectively. 13C NMR spectra of all modified lignins showed characteristic ester carbonyl peaks (indicated by ‘E’ in Fig. 4). In cases of acetic and succinic anhydride-modified lignins, some spectral changes in 10–30 ppm are also observed, which are indicated by ‘A’ and ‘S’, respectively. In cases of phthalic and maleic anhydride modified lignins, a few new peaks (indicated by ‘B’ and ‘M’) are identified in the 110–130 ppm range.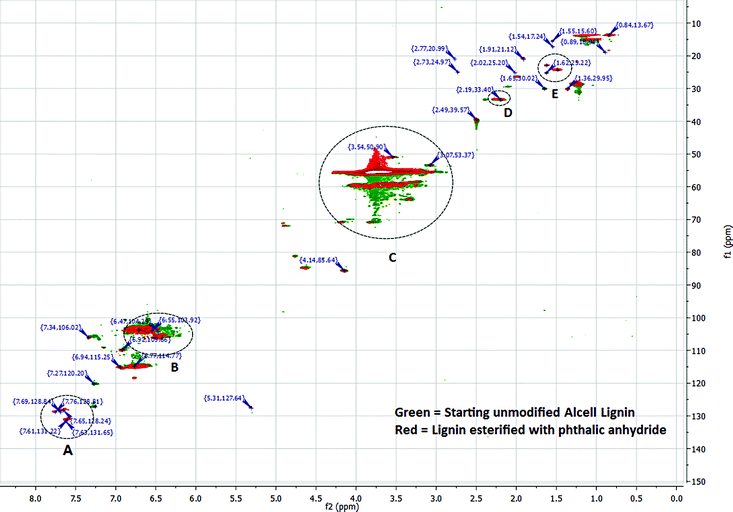 | ||
| Fig. 5 Comparison of HMQC spectra of unmodified and phthalic anhydride modified lignins. For simplicity, only some of the major peaks are listed. | ||
Integration of 1H spectra of unmodified and modified lignins were performed to estimate the degree of lignin esterification based on the amount of phenolics in each sample.49 (ESI,† Fig. 1, 3 and 4). A 1H NMR spectrum of lignin can be divided into several integration regions.49,50 For this work, three integration regions are considered which are approximately (δ = 7.9–9.4 ppm) for substituted and unsubstituted phenolics, (δ = 6.3–7.9 ppm) for aromatics and vinylics, (δ = 3.5–4.0 ppm) for (C9) units of lignin.32 The integration value of the phenolic region of the NMR spectrum of acetic anhydride modified lignin (integration value = 1.00) is lower than that of succinic anhydride modified lignin (integration value = 1.27) (Table 3. ESI,† Fig. 3 and 4). Thus, in the reaction involving acetic anhydride, more phenolic hydroxyl groups of lignin were esterified compared to the reaction involving succinic anhydride. The high integration values for acyl groups (integration value = 1.94), in the case of acetic anhydride modified lignin, also suggests a high degree of esterification. In the case of succinic anhydride, the residual solvent peak (δ = 2.50) and the HOD peak −(δ = 3.33) in DMSO d6 interferes with the –CH2 peaks of succinic anhydride, which precludes quantification of the acyl content. In cases of phthalic and maleic anhydride-modified lignins, proton peaks from acid anhydrides interfere with peaks from aromatic protons of lignin (ESI, Fig. 2 and 5). Interferences stemming from methoxy and HOD peaks are also present. Thus, in these cases, integrations of peaks do not provide acceptable results. In order to get a better understanding of chemical structure changes in phthalic anhydride modified lignin, HMQC (Heteronuclear Multiple Quantum Coherence) spectroscopy analyses of the starting lignin and phthalic anhydride modified lignin were performed (Fig. 5, ESI,† Tables 1 and 2). HMQC spectra provide information about the bonds between carbon and hydrogen (C–H) of a system. To ease the analysis, each spectrum is divided into three overlapping regions which encompass an aromatic region between 160.0–90.0 ppm (13C) and 8.0–6.0 ppm (1H), a side chain region between 110.0–50.0 ppm (13C) and 6.0–2.5 ppm (1H) and an alkyl region between 50.0–10.0 ppm (13C) and 3.0–0.5 ppm (1H). Peak assignments of the two HMQC spectra are based on peak identifications reported in related lignin studies, software simulations or a lignin database.51 The aromatic region in the HMQC spectrum of the unmodified lignin (ESI,† Table 1) contains several peaks representing C2,6, H2,6 of para-hydroxyphenyl (P), guaiacyl (G) or syringyl (S) units. For example, a peak for C2,6/H2,6 of a para-hydroxyphenyl (P) unit with an α-OH is present at the position 127.31/7.28 ppm. The peak at 103.35/6.62 ppm represents C2,6/H2,6 of syringyl units. The side chain region of this spectrum contains peaks representing β-O-4 linkages (84.81/4.63 ppm), methoxy groups (55.53/3.73 ppm) and carbohydrates. Absence of a large number of characteristic peaks for lignin-carbohydrate linkages in the side chain region of the spectrum indicates fewer amounts of residual carbohydrates in the unmodified lignin. The alkyl region of the spectrum contains peaks representing ‘C–H’ bonds at benzylic positions (33.35/2.19 ppm), alkyl groups (14.92/1.09 ppm), etc.
A comparison of HMQC spectra of unmodified and phthalic anhydride modified lignins clearly shows the appearance of several new peaks in the aromatic region (A, Fig. 5) of the HMQC spectrum of the modified lignin. Peaks at 131.65/7.63, 128.84/7.69 or 128.81/7.76 ppm can be attributed to phthalic moieties present in the esterified lignin. Peak at 131.22/7.61 ppm represent C2,6, H2,6 in the parahydroxy phenyl unit with esterified hydroxyl groups. The HMQC spectrum of phthalic anhydride modified lignin contains a few peaks (118.78/7.34, 118.48/6.76 ppm, etc.) in the aromatic region that can be assigned to acyl groups. Several peaks in the aromatic or side chain region (B and C, Fig. 5) are found shifted due to the esterification. However, not much change is observed in the alkyl region. Only a few new peaks are identified (D and E, Fig. 5) which represent benzylic C–H bonds. The results indicate that the esterification reaction does not compromise the lignin core structure and primarily modify the terminal hydroxyl groups.
FT-ICR MS analyses
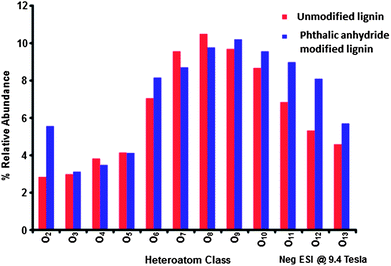
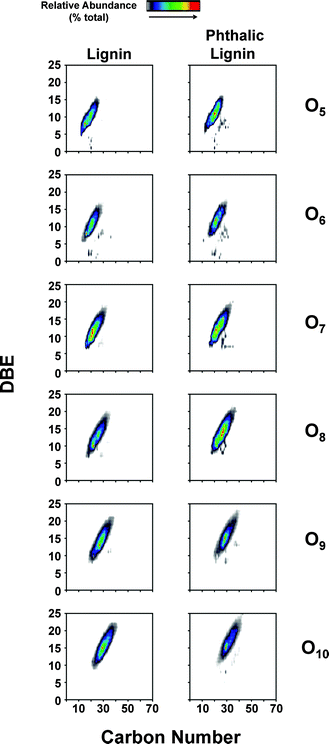
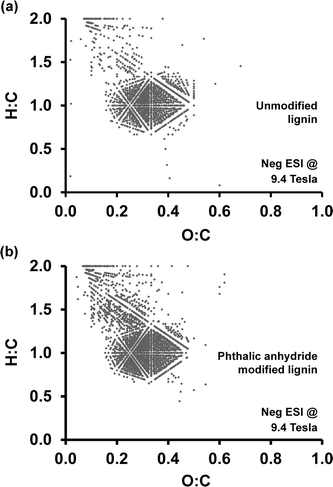
While NMR is an excellent tool for probing specific chemical functionalities, the complex branched nature of lignin biopolymers limits the use of NMR for the characterization of changes in the underlying polymer structure. Fourier transform ion cyclotron resonance mass spectrometry (FT-ICR MS) offers ultrahigh mass resolution and accuracy, which enables unique assignment of elemental compositions for thousands of fragments obtained from a single lignin sample. The high sensitivity of FT-ICR MS can reveal distinct changes in the elemental composition of lignin fragments as a result of chemical modification and its impact on the polymer characteristics. The compositional changes of unmodified and phthalic anhydride-modified lignin as identified by FT-ICR MS are shown in Fig. 6–8. Fig. 6 shows the heteroatom class distribution identified at >1% relative abundance in either lignin of phthalic anhydride-modified lignin derived from negative-ion ESI FT-ICR MS. The heteroatom class with the highest relative abundance detected by negative-ion ESI FT-ICR MS in both samples contains eight oxygen atoms (O8) per molecule, with both samples containing between two and thirteen oxygen atoms. Isoabundance-contoured plots of DBE (double bond equivalents = number of rings plus double bonds to carbon; DBE = c − h/2 + n/2 + 1, calculated from ion elemental composition, CcHhNnOoSs)52 versus carbon number for O5 – O10 classes from lignin (left) and phthalic anhydride-modified lignin (right) derived from negative-ion ESI FT-ICR MS are shown in Fig. 7. The most abundant oxygen classes for both samples display an increase in aromaticity (DBE) concurrent with carbon addition, indicative of a polymeric structural motif as previously observed in bio-oils,53,54 which suggests that the polymeric structural characteristics of lignin are preserved throughout the modification process.Van Krevelen diagrams plot the molar ratio of hydrogen to carbon (H![[thin space (1/6-em)]](https://www.rsc.org/images/entities/char_2009.gif) :
:![[thin space (1/6-em)]](https://www.rsc.org/images/entities/char_2009.gif) C ratio) versus the molar ratio of oxygen to carbon (O
C ratio) versus the molar ratio of oxygen to carbon (O![[thin space (1/6-em)]](https://www.rsc.org/images/entities/char_2009.gif) :
:![[thin space (1/6-em)]](https://www.rsc.org/images/entities/char_2009.gif) C ratio), and have been applied extensively to study complex organic samples.55 Because major chemical compound classes, such as lipids, carbohydrates, and lignin, have characteristic H
C ratio), and have been applied extensively to study complex organic samples.55 Because major chemical compound classes, such as lipids, carbohydrates, and lignin, have characteristic H![[thin space (1/6-em)]](https://www.rsc.org/images/entities/char_2009.gif) :
:![[thin space (1/6-em)]](https://www.rsc.org/images/entities/char_2009.gif) C or O
C or O![[thin space (1/6-em)]](https://www.rsc.org/images/entities/char_2009.gif) :
:![[thin space (1/6-em)]](https://www.rsc.org/images/entities/char_2009.gif) C ratios, van Krevelen diagrams provide rapid identification of compound classes based on location. Elemental compositions for each peak calculated from negative-ion ESI FT-ICR MS provide H
C ratios, van Krevelen diagrams provide rapid identification of compound classes based on location. Elemental compositions for each peak calculated from negative-ion ESI FT-ICR MS provide H![[thin space (1/6-em)]](https://www.rsc.org/images/entities/char_2009.gif) :
:![[thin space (1/6-em)]](https://www.rsc.org/images/entities/char_2009.gif) C and O
C and O![[thin space (1/6-em)]](https://www.rsc.org/images/entities/char_2009.gif) :
:![[thin space (1/6-em)]](https://www.rsc.org/images/entities/char_2009.gif) C ratios. Fig. 8 shows Van Krevelen diagrams generated for unmodified lignin (Fig. 8a) and phthalic anhydride modified lignin (Fig. 8b). Although the main features between 0.2–0.5 O
C ratios. Fig. 8 shows Van Krevelen diagrams generated for unmodified lignin (Fig. 8a) and phthalic anhydride modified lignin (Fig. 8b). Although the main features between 0.2–0.5 O![[thin space (1/6-em)]](https://www.rsc.org/images/entities/char_2009.gif) :
:![[thin space (1/6-em)]](https://www.rsc.org/images/entities/char_2009.gif) C and 0.7–1.4 H
C and 0.7–1.4 H![[thin space (1/6-em)]](https://www.rsc.org/images/entities/char_2009.gif) :
:![[thin space (1/6-em)]](https://www.rsc.org/images/entities/char_2009.gif) C are preserved, additional peaks with high H
C are preserved, additional peaks with high H![[thin space (1/6-em)]](https://www.rsc.org/images/entities/char_2009.gif) :
:![[thin space (1/6-em)]](https://www.rsc.org/images/entities/char_2009.gif) C ratio and low O
C ratio and low O![[thin space (1/6-em)]](https://www.rsc.org/images/entities/char_2009.gif) :
:![[thin space (1/6-em)]](https://www.rsc.org/images/entities/char_2009.gif) C ratio appear in the plot for phthalic anhydride modified lignin. These peaks appearing in the range from 0.1–0.4 O
C ratio appear in the plot for phthalic anhydride modified lignin. These peaks appearing in the range from 0.1–0.4 O![[thin space (1/6-em)]](https://www.rsc.org/images/entities/char_2009.gif) :
:![[thin space (1/6-em)]](https://www.rsc.org/images/entities/char_2009.gif) C and 1.2–1.8 H
C and 1.2–1.8 H![[thin space (1/6-em)]](https://www.rsc.org/images/entities/char_2009.gif) :
:![[thin space (1/6-em)]](https://www.rsc.org/images/entities/char_2009.gif) C indicate an overall higher proportion of hydrogen-rich, presumably more hydrophobic, fragments after the modification process. In summary, phthalic anhydride modification does not significantly alter the lignin polymer backbone structure at the molecular level. However, a comparison of heteroatom class distributions indicates an increase in complex oxygen-containing compounds as a result of the esterification.
C indicate an overall higher proportion of hydrogen-rich, presumably more hydrophobic, fragments after the modification process. In summary, phthalic anhydride modification does not significantly alter the lignin polymer backbone structure at the molecular level. However, a comparison of heteroatom class distributions indicates an increase in complex oxygen-containing compounds as a result of the esterification.
Thermogravimetric analysis (TGA)
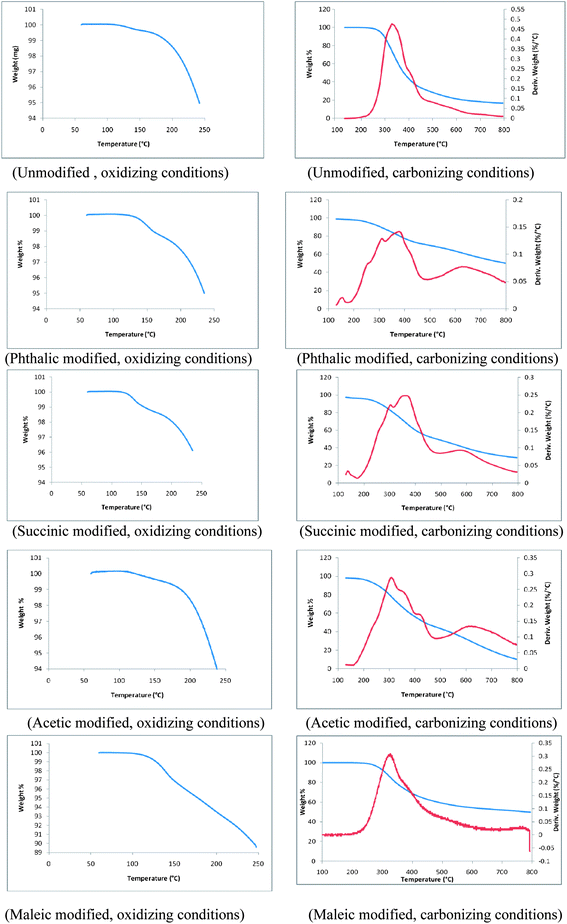
Thermograms of unmodified and phthalic, succinic, acetic and maleic anhydride modified lignins are shown in Fig. 9. These thermograms represent changes of structural and thermal properties of modified lignin samples. TGA plots of all lignin samples are divided into two ranges; (1) 0 to 250 °C corresponds to oxidation in air and (2) 250 to 800 °C corresponds to carbonization of lignin samples under an inert atmosphere. During the initial stage of oxidation a small weight loss was observed, which can be attributed to the volatilization of residual solvent or reagents from the modification process. During carbonization, the first thermal degradation of unmodified lignin was observed at 247 °C whereas, the thermal degradation of phthalic, succinic, acetic and maleic anhydride modified lignins started at 210, 202, 193 and 267 °C. Thus, with the exception of maleic anhydride modified lignin, the thermal degradations of esterified lignins were initiated at much lower temperatures compared to the unmodified lignin. However, temperatures corresponding to 50% weight loss of modified lignin samples during carbonization were higher than that of the unmodified lignin. Temperatures for 50% weight loss of acetic and succinic anhydride modified lignins were 384 and 481 °C respectively. The point of 50% weight loss was observed at 377 °C in the unmodified lignin. Interestingly, for phthalic and maleic anhydride modified lignins, 50% weight loss was reached at temperatures of approximately 770 °C. This significantly higher thermal stability might be a result of partial cross linking of lignin polymers. The derivatives of weight loss profiles of all modified lignins except the one modified with maleic anhydride showed more uniformity during carbonization than that of the unmodified lignin. Derivative weight profile of the unmodified lignin exhibited a broad peak with a maximum at 330 °C and a shoulder at 420 °C. The main peak shifted to approximately 350 °C for all modified lignins. Derivative plots of all modified lignins contained additional shoulders indicative of several discrete thermal degradation steps.BET surface area analysis
Acetic acid modified lignin based carbon was found to have the highest surface area followed by phthalic and succininc anhydride modified lignins (Table 4). These three lignins showed relatively uniform weight loss trends during carbonization compared to the unmodified lignin. The adsorbed pore volume was highest in the case of acetic anhydride modified carbon. All surface areas are found to be in the range of commercial graphitic carbon materials. currently used as anode materials.| Carbon type | BET Surface area (m2/g) | Adsorbed pore volume (cm3/g−1) |
|---|---|---|
| a Standard deviations in each case is specified inside parentheses. | ||
| Phthalic Anhydride modified | 32.7230 (1.5566) | 0.0133 (0.0009) |
| Acetic anhydride modified | 37.4293 (1.2133) | 0.0151 (0.0006) |
| Succinic anhydride modified | 15.3236 (1.8268) | 0.0077 (0.0008) |
| Maleic Anhydride modified | 6.3865 (1.2363) | 0.0018 (0.0007) |
| Unmodified | 8.1976 (0.7089) | 0.0042 (0.003) |
Scanning electron microscopy (SEM)
The SEM image of carbon material made from phthalic anhydride modified lignin was found to have relatively higher micro scale porosity compared to the unmodified lignin based carbon fiber (Fig. 10.).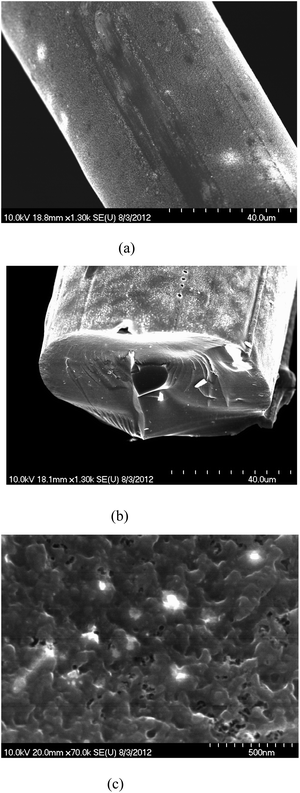 | ||
| Fig. 10 SEM images of the carbons from (a) unmodified lignin, (b) phthalic anhydride modified lignin and (c) micro scale porosity of phthalic anhydride modified lignin. | ||
Conclusions
Organosolv lignin was modified by esterification reactions using dicarboxylic acid anhydrides. The underlying chemistry of this process can be described as a nucleophilic acyl substitution reaction under neutral conditions. NMR spectra of modified lignin samples clearly show the incorporation of ester groups in lignin. In addition, HMQC analysis shows the modification process does not impact the lignin backbone structure, which is consistent with the mild reaction conditions used for the esterification. These results are also in agreement with high resolution FT-ICR MS data, which indicates a moderate increase in the aromatic character, overall higher H![[thin space (1/6-em)]](https://www.rsc.org/images/entities/char_2009.gif) :
:![[thin space (1/6-em)]](https://www.rsc.org/images/entities/char_2009.gif) C ratio and shift in heteroatom class distributions to a higher proportion of oxygen-rich fragments for phthalic anhydride modified lignin. TGA results show that modified lignins exhibit an overall higher thermal stability and less overall mass loss during carbonization than the unmodified lignin. Derivative weight loss profiles reveal a stepwise thermal conversion for modified lignins over a broad range of temperatures. This characteristic indicates that modification can have a significant impact on the underlying meso- and microstructure development. Furthermore, it shows that careful choice of a carbonization temperature profile allows control over the outcome of the conversion process and can be adjusted to obtain carbons with either more graphitic or disordered structures.
C ratio and shift in heteroatom class distributions to a higher proportion of oxygen-rich fragments for phthalic anhydride modified lignin. TGA results show that modified lignins exhibit an overall higher thermal stability and less overall mass loss during carbonization than the unmodified lignin. Derivative weight loss profiles reveal a stepwise thermal conversion for modified lignins over a broad range of temperatures. This characteristic indicates that modification can have a significant impact on the underlying meso- and microstructure development. Furthermore, it shows that careful choice of a carbonization temperature profile allows control over the outcome of the conversion process and can be adjusted to obtain carbons with either more graphitic or disordered structures.
Microscopic porosity is observed by SEM in carbon fibers based on phthalic anhydride modified lignin. BET surface area measurements showed most modified lignin-derived carbon materials have BET surface areas comparable to commercial graphitic carbons.
Microstructured carbon materials combined with a fused carbon fiber-based architecture have potential applications as adsorbents, anode materials for battery or supercapacitor applications.31 In addition, melt processing and subsequent carbonization of modified lignins enable the fabrication of functional carbon materials with custom shapes while making the manufacturing process more economic. The use of lignin as a fully renewable resource for the production of microstructured carbons promotes the transition to a long-term sustainable economy.
Acknowledgements
This research was sponsored by the Laboratory Directed Research and Development (LDRD) Program of Oak Ridge National Laboratory (ORNL), which is managed by UT-Battelle, LLC, for the U.S. Department of Energy under Contract no. DE-AC05-00OR22725. Work performed at the National High Magnetic Field Laboratory was supported by the National Science Foundation (NSF) Division of Materials Research through DMR-1157490, Florida State University, the Future Fuels Institute, BP/The Gulf of Mexico Research Initiative to the Deep-C Consortium, and the State of Florida. A few NMR spectra were collected with the help of Dr J. J. Bozell, Center for Renewable Carbon, The University of Tennessee, Knoxville, TN. All other NMR spectra were collected at the Center for Nanophase Materials Sciences (CNMS), ORNL through a user proposal (CNMS2012-R81). We acknowledge the help of Dr Peter Bonnesen for collecting these spectra at CNMS.References
- J. Zakzeski, P. C. A. Bruijnincx, A. L. Jongerius and B. M. Weckhuysen, Chem. Rev., 2010, 110, 3552–3599 CrossRef CAS PubMed.
- T. Saito, R. H. Brown, M. A. Hunt, D. L. Pickel, J. M. Pickel, J. M. Messman, F. S. Baker, M. Keller and A. K. Naskar, Green Chem., 2012, 14, 3295–3303 RSC.
- J. J. Bozell, C. J. O'Lenick and S. Warwick, J. Agric. Food Chem., 2011, 59, 9232–9242 CrossRef CAS PubMed.
- D. A. Baker, N. C. Gallego and F. S. Baker, J. Appl. Polym. Sci., 2012, 124, 227–234 CrossRef CAS.
- R. F. A. (Renewable Fuels Association)http://www.ethanolrfa.org/pages/renewable-fuels-standard, accessed 04/20/2013, 2012.
- J. J. Bozell and S. Chatterjee, PCT Int. Appl. (WO 2012-US54419), USA., 2012.
- S. Kuitunen, A. Kalliola, V. Tarvo, T. Tamminen, S. Rovio, T. Liitiä, T. Ohra-aho, T. Lehtimaa, T. Vuorinen and V. Alopaeus, Holzforschung, 2011, 65, 587 CrossRef CAS.
- S. Liu, Z. Shi, L. Li, S. Yu, C. Xie and Z. Song, RSC Adv., 2013, 3, 5789–5793 RSC.
- C. Aellig, C. Girard and I. Hermans, Angew. Chem., Int. Ed., 2011, 50, 12355–12360 CrossRef CAS PubMed.
- L. Das, P. Kolar and R. Sharma-Shivappa, Biofuels, 2012, 3, 155–166 CrossRef CAS.
- P. C. Rodrigues Pinto, E. A. Borges da Silva and A. r. E. d. Rodrigues, Ind. Eng. Chem. Res., 2010, 50, 741–748 CrossRef.
- T. H. Parsell, B. C. Owen, I. Klein, T. M. Jarrell, C. L. Marcum, L. J. Haupert, L. M. Amundson, H. I. Kenttamaa, F. Ribeiro, J. T. Miller and M. M. Abu-Omar, Chem. Sci., 2013, 4, 806–813 RSC.
- M. A. Ratcliff, D. K. Johnson, F. L. Posey and H. L. Chum, Appl. Biochem. Biotechnol., 1988, 17, 151–160 CrossRef CAS.
- T. Yoshikawa, T. Yagi, S. Shinohara, T. Fukunaga, Y. Nakasaka, T. Tago and T. Masuda, Fuel Process. Technol., 2013, 108, 69–75 CrossRef CAS PubMed.
- Z. Tang, Y. Zhang and Q. Guo, Ind. Eng. Chem. Res., 2010, 49, 2040–2046 CrossRef CAS.
- D. L. Chung, Carbon Fiber Composites, Butterworth-Heinemann, New York, 1994 Search PubMed.
- D. V. Evtugin and A. Gandini, Acta Polym., 1996, 47, 344–350 CrossRef CAS.
- Y. Li and A. J. Ragauskas, RSC Adv., 2012, 2, 3347–3351 RSC.
- Y. Li and S. Sarkanen, Macromolecules, 2002, 35, 9707–9715 CrossRef CAS.
- N. E. Mansouri, A. Pizzi and J. Salvadó, Holz Roh- Werkst., 2007, 65, 65–70 CrossRef CAS.
- S. B. Gogoi, Indian Chem. Eng., 2010, 52, 325–335 CrossRef.
- Y. Liu, J. S. Xue, T. Zheng and J. R. Dahn, Carbon, 1996, 34, 193–200 CrossRef CAS.
- I. Isaev, G. Salitra, A. Soffer, Y. S. Cohen, D. Aurbach and J. Fischer, J. Power Sources, 2003, 119–121, 28–33 CrossRef CAS.
- A. Manthiram, J. Phys. Chem. Lett., 2011, 2, 373 CrossRef CAS.
- M. Broussely, P. Biensan and B. Simon, Electrochim. Acta, 1999, 45, 3–22 CrossRef CAS.
- J. R. Dahn, T. Zheng, Y. Liu and J. S. Xue, Science, 1995, 270, 590–593 CAS.
- Y. S. Han, J. S. Yu, G. S. Park and J. Y. Lee, J. Electrochem. Soc., 1999, 146, 3999–4004 CrossRef CAS PubMed.
- N. Takami, A. Satoh, M. Hara and T. Ohsaki, J. Electrochem. Soc., 1995, 142, 371–379 CrossRef CAS PubMed.
- M. B. Stane Pejovnik, R. Dominko, J. Drofenik and M. Gaberscek, Acta Chim. Slov., 2001, 48, 115–125 Search PubMed.
- O. Rios, W. E. Tenhaeff, M. A. McGuire, P. A. Menchhofer, A. Johs, K. L. More and D. White, in PRiME 2012-The Electrochemical Society, Honolulu, Hawaii, 2012 Search PubMed.
- W. E. Tenhaeff, O. Rios, K. More and M. A. McGuire, Adv. Funct. Mater., 2013 DOI:10.1002/adfm.201301420.
- G. Glasser Wolfgang and K. Jain Rajesh, Holzforschung, 1993, 47, 225 CrossRef.
- J. Luo, J. Genco, B. Cole and R. Fort, BioResources, 2011, 6, 4566–4605 CAS.
- J. L. Braun, K. M. Holtman and J. F. Kadla, Carbon, 2005, 43, 385–394 CrossRef CAS PubMed.
- T. Matsumoto and I. Mochida, Carbon, 1992, 30, 1041–1046 CrossRef CAS.
- C. Q. Yang and J. R. Simms, Carbon, 1993, 31, 451–459 CrossRef CAS.
- J. Drbohlav and W. T. K. Stevenson, Carbon, 1995, 33, 693–711 CrossRef CAS.
- R. W. Thring, M. N. Vanderlaan and S. L. Griffin, J. Wood Chem. Technol., 1996, 16, 139–154 CrossRef CAS.
- C. A. Cateto, M. F. Barreiro, A. E. Rodrigues, M. C. Brochier-Salon, W. Thielemans and M. N. Belgacem, J. Appl. Polym. Sci., 2008, 109, 3008–3017 CrossRef CAS.
- D. C. Podgorski, A. M. McKenna, R. P. Rodgers, A. G. Marshall and W. T. Cooper, Anal. Chem., 2012, 84, 5085–5090 CrossRef CAS PubMed.
- M. D'Auria, L. Emanuele and R. Racioppi, Nat. Prod. Res., 2011, 26, 1368–1374 CrossRef PubMed.
- N. Kaiser, J. Quinn, G. Blakney, C. Hendrickson and A. Marshall, J. Am. Soc. Mass Spectrom., 2011, 22, 1343–1351 CrossRef CAS PubMed.
- G. T. Blakney, C. L. Hendrickson and A. G. Marshall, Int. J. Mass Spectrom., 2011, 306, 246–252 CrossRef CAS PubMed.
- F. Xian, C. L. Hendrickson and A. G. Marshall, Anal. Chem., 2012, 84, 708–719 CrossRef CAS PubMed.
- J. J. Savory, N. K. Kaiser, A. M. McKenna, F. Xian, G. T. Blakney, R. P. Rodgers, C. L. Hendrickson and A. G. Marshall, Anal. Chem., 2011, 83, 1732–1736 CrossRef CAS PubMed.
- E. Kendrick, Anal. Chem., 1963, 35, 2146–2154 CrossRef CAS.
- C. A. Hughey, C. L. Hendrickson, R. P. Rodgers, A. G. Marshall and K. Qian, Anal. Chem., 2001, 73, 4676–4681 CrossRef CAS.
- B. Xiao, X. F. Sun and R. Sun, Polym. Degrad. Stab., 2001, 71, 223–231 CrossRef CAS.
- S. Li and K. Lundquist, Nord. Pulp Pap. Res. J., 1994, 9, 191–195 CAS.
- S. Li and K. Lundquist, J. Wood Chem. Technol., 1997, 17, 391–397 CrossRef CAS.
- S. A. Ralph, J. Ralph and L. Landucci, Database of Lignin and Cell Wall Model Compounds, November 2004, http://ars.usda.gov/Services/docs.htm?docid=10491 Search PubMed.
- F. W. McLafferty and F. Turecek, Interpretation of Mass Spectra, University Science Books, Mill Valley, CA, 1993 Search PubMed.
- P. Bhattacharya, P. H. Steele, E. B. M. Hassan, B. Mitchell, L. Ingram and C. U. Pittman Jr, Fuel, 2009, 88, 1251–1260 CrossRef CAS PubMed.
- J. M. Jarvis, A. M. McKenna, R. N. Hilten, K. C. Das, R. P. Rodgers and A. G. Marshall, Energy Fuels, 2012, 26, 3810–3815 CrossRef CAS.
- S. Kim, R. W. Kramer and P. G. Hatcher, Anal. Chem., 2003, 75, 5336–5344 CrossRef CAS.
Footnote |
| † Electronic supplementary information (ESI) available. See DOI: 10.1039/c3ra46928j |
| This journal is © The Royal Society of Chemistry 2014 |

