A novel strategy of procalcitonin detection based on multi-nanomaterials of single-walled carbon nanohorns–hollow Pt nanospheres/PAMAM as signal tags
Fei Liua,
Guiming Xianga,
Xuemei Chenb,
Fukang Luoa,
Dongneng Jianga,
Shaoguang Huanga,
Yi Lia and
Xiaoyun Pu*a
aDepartment of Clinical Laboratory, Xinqiao Hospital, Third Military Medical University, Chongqing 400037, China. E-mail: puxiaoyong@yahoo.com; Fax: +86-02368755637; Tel: +86-02368763374
bShima River Community Health Center, Jiangbei District, Chongqing 400021, China
First published on 5th March 2014
Abstract
Procalcitonin (PCT) is a common clinical biomarker of septicemia, and precise detection of PCT is critical to the treatment of septicemia. Conventional detection methods suffer various shortcomings that hinder precise PCT detection. An electrochemical immunosensor based on the antigen–antibody immune-reaction may provide a solution. We developed a novel electrochemical immunosensor for PCT using single-walled carbon nanohorns (SWCNHs)–hollow Pt nanospheres (HPtNPs) as signal tags. Given the high specific surface area of SWCNHs and the interesting catalytic properties of HPtNPs, the successful synthesis of SWCNHs–HPtNPs provided not only a high specific surface area for loading substantial antigen but also good catalytic properties to enhance the electrochemical signal with high sensitivity. In addition, to increase the quantity of the electrochemically active compound thionine immobilized on the surface, PAMAM, which is a class of hyper-branched polymers with a diamine core and an amido amine branching structure, was assembled on the SWCNH–HPtNP surface. A series of results demonstrated the higher sensitivity, improved stability and ideal selectivity of the novel immunosensor compared with a sensor prepared using traditional methods. Furthermore, a broad linear response from 10 pg mL−1 to 20 ng mL−1 with a detection limit of 1.74 pg mL−1 was observed under the optimized conditions of the assay. This immunosensor may provide a new option for clinical septicemia diagnosis through PCT detection.
Introduction
Septicemia is a serious illness, and a delay in its treatment may lead to rapid death.1 The most important serum diagnostic biomarker for septicemia is procalcitonin (PCT).2 A PCT concentration less than 0.25 ng mL−1 is considered nonseptic; however, PCT concentrations can increase to 1 ng mL−1 or exceed 10 ng mL−1 in septicemia patients.3–5 Accurate and specific PCT detection is important for the timely and appropriate treatment of septicemia. Conventional PCT assay methods, including immune-gold labeling techniques and enzyme linked immune sorbent assay (ELISA), suffer some shortcomings, such as long detection times, low accuracies and high costs.6–8 Therefore, new detection methods for PCT assays are needed.An electrochemical immunosensor based on antigen–antibody specific binding may provide a solution for PCT detection.9,10 Single-walled carbon nanohorns (SWCNHs) are a new type of carbonaceous nanostructured material generated in abundance via ablation by a CO2 laser at room temperature under flowing Ar gas.11 SWCNHs offer three advantages: low levels of impurities, few side effects and a high surface area. Because of their unique properties, SWCNHs have been extensively used in various areas, such as drug research, batteries and supercapacitors.12–16 Moreover, SWCNHs can form complexes with other materials to combine their respective advantages. Muniz et al. developed a hexaphyrin–SWCNH complex to enhance the strength of electronic transfer.17 Zhu et al. used SWCNHs to adsorb a fluorescein-based dye (FAM)-labeled peptide (FAM-pep) to detect thrombin with a detection limit of 100 pM.18 Zhang synthesized a gold nanoparticle–SWCNH (GNP–SWCNH) hybrid to detect hypoxanthine and xanthine; the hybrid exhibited high electrochemical activity toward the oxidation of hydrogen peroxide.19 Because HPtNPs have higher specific surface areas, better catalytic properties, a lower density, lower material requirements and reduced cost compared with solid Pt nanospheres,20,21 HPtNPs are well suited for various labeling applications. If SWCNHs can form a complex with HPtNPs, the resulting complex may exhibit the combined advantages of both materials. The advantages of a SWCNH–HPtNP complex, which may include a large loading area, a high catalytic activity and reduced side effects, could render a suitable platform for the fabrication of a high sensitivity sensor.
Motivated by the previously discussed considerations, we successfully prepared SWCNHs–HPtNPs as a solid matrix containing immobilized antibodies and electroactive substances. To increase the loading of antibody and solid electroactive material, we attached PAMAM (G4.0), which is a class of hyperbranched polymers with a diamine core and an amido amine branching structure, to the SWCNH–HPtNP surfaces. The PAMAM dendrimers allow these polymers to be functionalized with various drugs, nucleic acids and imaging system components.22 Their highly branched architectures offer unique interfacial and functional advantages at all levels of the biological hierarchy in PAMAM.23 PAMAM has previously been used to construct a reagent less amperometric glucose immunosensor24 in which horseradish peroxidase (HRP) was used to block the non-specific adsorption sites on the electrode surface and the excess hollow Pt sites. HRP can amplify the electrochemical signal for the detection of certain biomarkers.25,26
In brief, we developed a novel immunosensor using SWCNHs–HPtNPs/PAMAM/HRP as signal tags to bind additional Ab1 for PCT detection. When H2O2 is present in the bottom liquid, HRP and HPtNP can catalyze the hydrolysis of H2O2, there by accelerating the redox reaction in the electro-active substance and enhancing the electrochemical signal. When the as-prepared sensor binds the target antigen, the steric hindrance of the electrode surface increases, which reduces the catalytic ability of the HRP and HPtNP and thus diminishes the electrochemical signal. By measuring this reduction in the electrochemical signal, we achieved highly sensitive detection of the target object. A series of results demonstrated that this novel immunosensor exhibited acceptable reproducibility, high sensitivity, good stability and optimal selectivity compared with traditional methods. The sensing operation is simple, thereby allowing practical evaluation of clinical samples.
Experimental
Chemicals and materials
The SWCNHs (>95% purity) were purchased from the JianSin-Scientific & Trading Co. (Beijing, China). The Pt chloride (HPtCl4), bovine serum albumin (BSA, 96–99%), PDDA (4%), N-hydroxysuccinimide (NHS), N-(3-dimethylaminopropyl)-N-ethylcarbodii-midehydrochloride (EDC) and PAMMA (G4.0) dendrimers were purchased from Sigma Chemical Co. (St. Louis, MO, USA). Phosphate buffered solutions (PBS, pH 7.4) were prepared using 0.01 M Na2HPO4 and 0.01 M KH2PO4. The prepared solutions were maintained at 4 °C prior to use. The PCT antibodies and antigen were purchased from YeXiang Bio.Co. (HangZhou, China). Five cases of human blood serum samples were collected from the Department of Clinical Laboratory of Xinqiao Hospital; all of the samples were obtained with informed consent from the patients.Apparatus
Cyclic voltammetry (CV) measurements were carried out with a CHI 660C electrochemistry workstation (Shanghai CH Instruments, China). The three-compartment electrochemical cell contained a platinum wire auxiliary electrode and a saturated calomel reference electrode (SCE). The working electrode was a glassy carbon electrode (GCE, diameter 4 mm). Scanning electron microscopy (SEM) measurements were obtained on an S4800 (Hitachi Co., Japan) instrument. The pH measurements were made using a pH meter (MP 230, Mettler-Toledo, Switzerland) and a digital ion analyzer (Model PHS-3C, Dazhong Instruments, Shanghai, China). The gold-label chips were purchased from Thermo Fisher Scientific Corp. (MA, USA).Synthesized HPtNPs
The HPtNPs were synthesized according to the method described in the literature.21,27 In brief, CoCl2·6H2O (8.5 mg) and poly(vinylpyrrolidone) (PVP, MW 40![[thin space (1/6-em)]](https://www.rsc.org/images/entities/char_2009.gif) 000, 100 mg) were dissolved in 50 mL of ddH2O (18.2 M), sonicated for 15 min, and purged with N2 for 15 min. A freshly prepared NaBH4 solution (10 mg in 20 mL of H2O) was then added dropwise under stirring to reduce Co2+ to Co nanoparticles. After the addition of NaBH4, 1.2–1.5 mL of a 1% H2PtCl6 solution was added dropwise under stirring, and the Co nanoparticles were oxidized to Co2+, which replaced the Pt4+ to form hollow Pt nanospheres around the original Co nanoparticle templates. Stirring was continued for 30 min. Finally, the sediment was collected via centrifugation and washed several times with H2O and ethanol. The precipitate was re-suspended in 4 mL H2O and stored at 4 °C until needed.
000, 100 mg) were dissolved in 50 mL of ddH2O (18.2 M), sonicated for 15 min, and purged with N2 for 15 min. A freshly prepared NaBH4 solution (10 mg in 20 mL of H2O) was then added dropwise under stirring to reduce Co2+ to Co nanoparticles. After the addition of NaBH4, 1.2–1.5 mL of a 1% H2PtCl6 solution was added dropwise under stirring, and the Co nanoparticles were oxidized to Co2+, which replaced the Pt4+ to form hollow Pt nanospheres around the original Co nanoparticle templates. Stirring was continued for 30 min. Finally, the sediment was collected via centrifugation and washed several times with H2O and ethanol. The precipitate was re-suspended in 4 mL H2O and stored at 4 °C until needed.
Preparation of the SWCNH–HPtNP/PAMAM/Thio–Ab1 bioconjugate
A 2 mg sample of SWCNHs was dispersed in 2 mL of 0.5 wt% PDDA solution under agitation to obtain a stable PDDA–SWCNH suspension. Then, 1 mL of hydrated SWCNHs was mixed with a 1 mL of HPtNP solution overnight. The SWCNHs–HPtNPs were collected after centrifugation, and the complexes were subsequently stirred with 200 μL of PAMAM (G4.0) to form a SWCNH–HPtNP/PAMAM complex. The SWCNH–HPtNP/PAMAM complex was stored at 4 °C, and the excess PAMAM was removed via high-speed centrifugation.The proposed Ab1 bioconjugate was prepared according to the following method: 120 μL of PCT Ab1 was treated with EDC and an NHS solution and was subsequently mixed with thionine. The Thio–Ab1 was collected after centrifugation. Subsequently, the Thio–Ab1 was mixed with the SWCNH–HPtNP/PAMAM complex under stirring overnight after 0.1 mL of a 0.5% glutaraldehyde solution was added. The Thio–Ab1 crosslinked with the SWCNHs–HPtNPs/PAMAM. We then collected the SWCNHs–HPtNPs/PAMAM/Thio–Ab1 via centrifugation and added the appropriate quantity of HRP to the SWCNH–HPtNP/PAMAM/Thio–Ab1 solution to bind the Ab1 and block excess hollow Pt sites without binding the proteins.
Fabrication of the immunosensor to detect PCT
The process used to fabricate the immunosensor is depicted in Scheme 1. Before each bare glassy carbon electrode (GCE) was modified, it was polished with 0.3 μm and 0.05 μm alumina slurries, sonicated in deionized water and dried with a stream of highly pure nitrogen to obtain a mirror surface. Then, the Au particles were directly electrodeposited onto the electrode via CV in 100 μM L−1 HAuCl4 using the strip analysis method. The Au particles were directly deposited onto the clean electrode surface and subsequently dried at room temperature.28,29 The Au particle composite nanohybrid was used as an effective matrix to immobilize the PCT Ab1 via amino–Au affinity. Subsequently, 20 μL of 0.25% BSA solution was dropped onto the electrode over 0.5 h at 37 °C to block the nonspecific binding sites. The modified electrode was thoroughly cleaned with doubly distilled water and 1 × PBS buffer to remove the nonchemisorbed species. The finished immunosensor was stored at 4 °C when not in use. The immunosensor was first incubated with the PCT samples for 50 min at 37 °C, and then used to detect the current in a HAc–NaAc buffer solution (pH 5.5) with or without H2O2.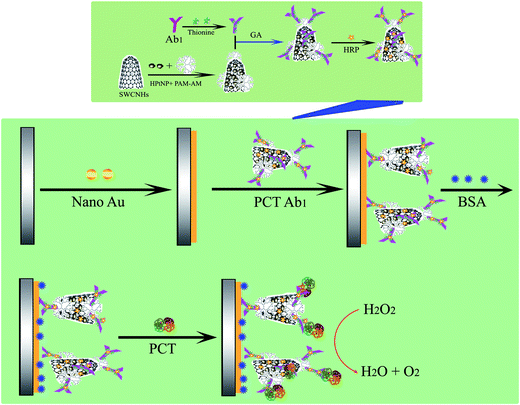 | ||
Scheme 1 Schematic diagram of the biosensor fabrication process. PCT: procalcitonin, Ab1![[thin space (1/6-em)]](https://www.rsc.org/images/entities/char_2009.gif) : :![[thin space (1/6-em)]](https://www.rsc.org/images/entities/char_2009.gif) PCT antibody, GA: glutaraldehyde. PCT antibody, GA: glutaraldehyde. | ||
Experimental measurements
The electrochemical experiments were performed in a conventional electrochemical cell containing a three-electrode arrangement. The electrochemical measurements were performed in 2 mL of 0.01 M HAc–NaAc buffer solution (pH 5.5), with the participation of an appropriate quantity of H2O2 as the substrate, from −0.6 to 0 V at a scanning rate of 50 mV s−1. Data for the preliminary application of the immunosensor were analyzed using the SPSS 19.0 software package (SPSS Inc., Chicago, USA).Results and discussion
SEM of the SWCNH, HPtNP, SWCNH–HPtNP complex
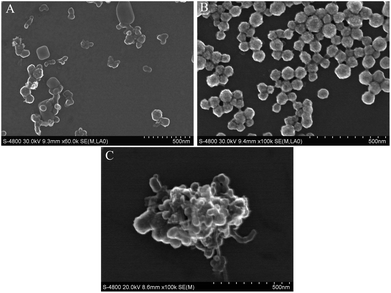
We synthesized the SWCNH–HPtNP complex, which was then used to bind the PAMAM for signal detection. The shapes of the individual components are shown in Fig. 1A–C. First, the SWCNHs were hydrated with PDDA. A typical SEM image of the PDDA–SWCNHs is provided in Fig. 1A. The PDDA–SWCNHs exhibited ‘bud-like’ or ‘disc-like’ aggregates and further form cluster. Their brightness universally appeared slightly dark or gray. The diameter of the individual SWCNHs ranged from 30 to 70 nm and the clusters are not of uniform size. All the results are consistent with previously reported results.30 The HPtNPs were successfully manufactured and consisted of numerous hollow Pt spheres dispersed through the monomer. An individual HPtNP exhibits distinct brightness differences between the inner and outer regions of the particles. The average diameter of the HPtNPs was estimated to be 15–70 nm (Fig. 1B). The HPtNPs have a much greater specific surface area for catalytic reactions than do the solid Pt nanoparticles, which results in the HPtNPs exhibiting a substantially higher binding capacity. The results indicated that the HPtNPs were synthesized and are consistent with previously reported results.21 The HPtNP size can be controlled by the volume of temp PVP.Subsequently, the SWCNHs and HPtNPs were mixed overnight. The SEM images revealed that the HPtNPs strongly bind with the SWCNHs to form a SWCNH–HPtNP complex (Fig. 1C). The results indicate the complete preparation of the SWCNH–HPtNP complex.
Electrochemical characterization of the proposed immunosensor
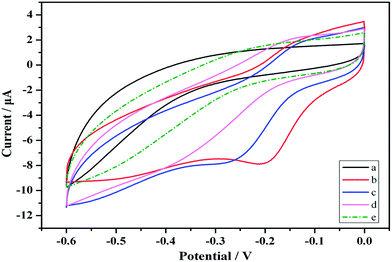
CVs was a convenient and effective tool for assessing the electro-activity of the various modified electrodes. During the fabrication process, the features of the step wise-modified electrode surfaces were investigated via CV in a HAc–NaAc buffer solution (pH 5.5) at a scan rate of 50 mV s−1. The electrochemical characterization results for the modified electrodes are depicted in Fig. 2. Curve (a) shows a pair of typical reversible redox peaks corresponding to the reversible redox reaction of the bare GCE in a HAc–NaAc buffer solution. Au is highly conductive, and the intensity of the redox peak therefore substantially increased after the electrode was modified with Au (Fig. 2 curve (b)). Although the PCT Ab1 does not favor electron transfer, the SWCNHs–HPtNPs–HRP–thionine, which binds Ab1, may enhance the electron transfer with the BSA, thereby facilitating the electron transfer of the GCE/Au/SWCNHs–HPtNPs/PAMAM/Thio–Ab1 (Fig. 2, curve (c)). However, after the electrode was modified with BSA and the PCT antigen, the intensities of the corresponding redox peaks clearly decreased (curves (d) and (e)). The CV measurements demonstrate that the immunosensor was useful for PCT sensing.Fig. 3 shows the CVs of the modified immunosensor in an HAc–NaAc buffer solution at scan rates ranging from 20 to 300 mV s−1 (i.e., at 20, 50, 80, 100, 150, 200 and 300 mV s−1). The anodic and cathodic peaks clearly varied with the scan rate. Moreover, the peak currents were directly proportional to the scan rates (Fig. 3). The results reveal a surface-confined redox process in the electrode.
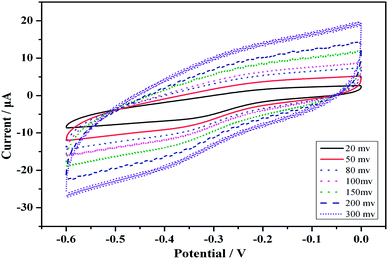 | ||
| Fig. 3 CVs of the modified electrode at different scan rates (from inner to outer), 20, 50, 80, 100, 150, 200 and 300 mV s−1, in a 2 mL HAc–NaAc buffer solution (pH 5.5) at room temperature. | ||
Analytical performance of the immunosensor
Our immunosensor operates on a cooperative catalysis amplification strategy based on the ability of HRP and the HPtNPs to catalyze the decomposition of H2O2. To determine whether the bound HPtNPs–HRP can catalyze the decomposition of H2O2, H2O2 was added to 2 mL of 0.1 M HAc–NaAc buffer solution (pH 5.5) and the response of the immunosensor was measured using CV and DPV.The results depicted in Fig. 4 indicate that the current response was amplified by the addition of H2O2 because of the high catalytic activity of the bound HPtNPs–HRP. The intensities of the redox peaks in the CVs clearly increased after the H2O2 was added; the signal was amplified 3- to 4-fold (Fig. 4A), indicating a catalytic effect that substantially exceeds those reported previously.31 The same results were obtained using DPV, through which the catalytic phenomenon is obvious (Fig. 4B). Therefore, the high sensitivity resulted from the multiple signal amplification, thereby indicating that the proposed approach is suitable for the detection of low concentrations of H2O2 in small sample volumes.
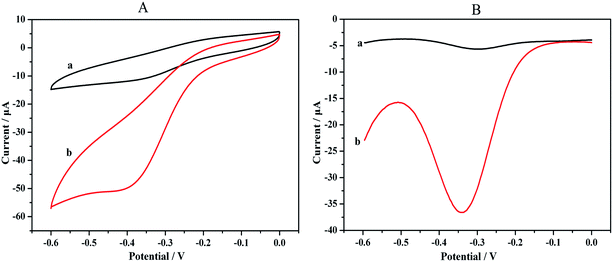 | ||
| Fig. 4 (A) CVs and (B) DPVs of the catalytic activity in a 2 mL HAc–NaAc buffer solution (pH 5.5): (a), without H2O2; (b), with H2O2. | ||
Optimization of main experimental conditions
The effect of the H2O2 concentration on the sensor response was examined. Fig. 5 provides the CV plot of the fully assembled immunosensor under exposure to 10 ng mL−1 PTC in 2 mL of HAc–NaAc buffer solution (pH 5.5) containing H2O2. As shown in the inset of Fig. 5, the change in the maximum cathode peak current was obtained when 35 μL of 2 mmol L−1 H2O2 was present. Additional H2O2, even 1 μL, led to a decrease in the maximum cathode peak intensity. Thus, 2 mmol L−1 H2O2 was used as the optimum concentration for detection, and the optimized volume for H2O2 catalysis was 35 μL (Fig. 5A).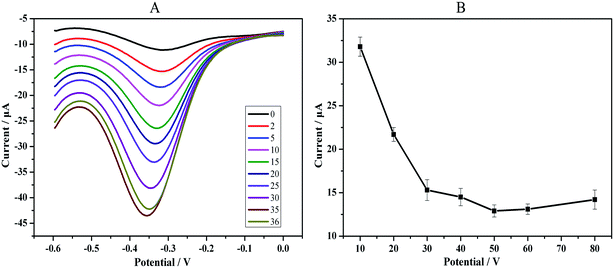 | ||
| Fig. 5 Optimization (A) of the volume of H2O2 catalysis: from 0 to 36 μL of 2 mM L−1 H2O2. (B) Incubation time of the Ab1–PCT reaction. | ||
Our strategy adopted a direct method in which PAMAM has a strong electron-hindering function; the cathode peak current will decrease as the PCT is detected. Therefore, optimization of the immune-reaction time for the antibody–antigen was necessary to obtain the minimum current. We detected a series of intervals that ranged from 10 min to 80 min under the same PCT concentration (1 ng mL−1). The results demonstrated that the cathode peak current responses decreased rapidly with increasing incubation time up to 50 min. However, after 50 min, the decrease slowed substantially. Therefore, an optimal incubation time of 50 min was adopted in the subsequent experiments (Fig. 5B).
Calibration line for the immunosensor for the detection of PCT
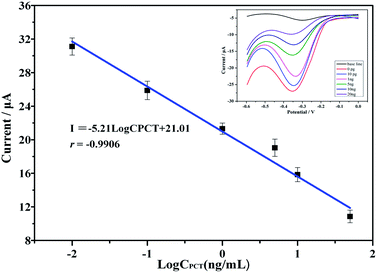
The as-prepared electrochemical immunosensor was subjected to incubation with various PCT concentrations. As shown in the inset of Fig. 6, the cathodic peak clearly decreased with increasing PCT concentration, which we attributed to the bulky PCT molecules attached to the electrode surface; the bulky PCT molecules created a barrier for the electrons and substantially inhibited the electron transfer. Fig. 6 displays the corresponding calibration plots; the cathodic peak currents were proportional to the PCT concentration over the concentration range of 10 pg mL−1 to 20 ng mL−1. A linear relationship existed in the concentration range of 0 to 20 ng mL−1. The linear equation was I = −5.21![[thin space (1/6-em)]](https://www.rsc.org/images/entities/char_2009.gif) log
log![[thin space (1/6-em)]](https://www.rsc.org/images/entities/char_2009.gif) CPCT + 21.01; the correlation coefficient was 0.9906, and the detection limit was 1.74 pg mL−1 (defined as 3σ, where σ is the standard deviation of six concentration: the blank, 0.001, 0.01, 0.1, 1, 10 and 20 ng mL−1). The detection limit was much lower than those obtained using traditional methods.
CPCT + 21.01; the correlation coefficient was 0.9906, and the detection limit was 1.74 pg mL−1 (defined as 3σ, where σ is the standard deviation of six concentration: the blank, 0.001, 0.01, 0.1, 1, 10 and 20 ng mL−1). The detection limit was much lower than those obtained using traditional methods.
Reproducibility, stability and specificity of the immunosensor
We evaluated the reproducibility of the immunosensor response by analyzing the same concentration of PCT (1 ng mL−1) using six identical electrodes. All electrodes exhibited similar electrochemical responses with a relative coefficient of variation (cv) of 7.93%. This result implies that the proposed immunosensor exhibits acceptable reproducibility for the quantitative assay of PCT proteins.The stability was evaluated over 40 continuous cycles in the potential range from −0.6 to 0.1 V at a scan rate of 50 mV s−1 in pH 5.5 HAc–NaAc buffer solution (Fig. 7). All redox lines of 40 cycles precisely coincided, the relative standard deviation was less than 2.1% and the current changes limit was ±0.14 μA. The results indicated that the immunosensor was perfectly stable when used to scan a buffer solution.
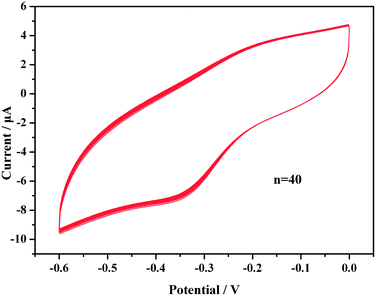 | ||
| Fig. 7 CV results over 40 cycles in an HAc–NaAc buffer solution (pH 5.5) after the sensors were incubated with PCT. | ||
To confirm whether the observed voltammetric response was generated from the antibody–antigen-specific interaction or from a nonspecific protein interaction, we investigated the selectivity when the immunosensor was incubated with samples containing the following potential interfering substances: CEA, AFP, PCT and a PCT mixture. The catalysis redox peaks of the CEA and AFP are clearly smaller, even for CEA and AFP concentrations as high as 5 ng mL−1. In contrast, the redox peak of the PTC and its mixture remained substantially higher, even at PTC concentrations as low as 100 pg mL−1 (Fig. 8). This gap is statistically significant according to calculations performed using SPSS 19.0(P < 0.05). The results reveal that the PCT immunosensor exhibits ideal specificity.
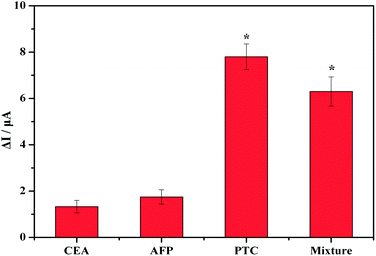 | ||
| Fig. 8 Specificity of the PCT biosensor with 5 ng of CEA, 5 ng of AFP, 100 pg of PTC and a PTC mixture (100 pg of PTC, 5 ng of CEA and 5 ng of AFP). | ||
Preliminary application of the immunosensor
To validate the actual application of the newly developed immunosensor, 5 cases of human blood serum samples were detected using the PCT immunosensor. The samples were first detected via immunogold labeling. We then compared these results with each other. All experiments were performed in compliance with relevant laws and institutional guidelines, and the institutional committee approved all of the experiments.Immunogold labeling results are qualitative in that they indicate only ‘with’ or ‘without’ PCT. ELISA is seldom used for actual serum samples of PCT detection, but it can precisely quantify the concentrations of PCT. So five cases of septicemia serum samples were detected by both the PCT immunosensor and ELISA facilitating comparison. The concentration detected by ELISA ranged from 1.91 to 6.55 ng mL−1. The concentration detected by the PCT immunosensor ranged from 1.79% to 6.63%. The relative deviations of both ranged from 1.399% to 3.01%, with a recovery range from 93.72% to 114.98% (Table 1). These data demonstrate that the recovery and relative standard deviation values are acceptable and that the immunosensor represents a promising alternative tool for determining PCT in real clinical serum samples.
| Sample | Actual conc. (C0) | Immunosensor cont. (C1) | Recovery (%) (C1/C0) | SD (%) |
|---|---|---|---|---|
| a Conc.: concentration, SD: standard deviation. | ||||
| 1 | 5.93 | 5.86 | 97.83 | 1.47 |
| 2 | 2.07 | 2.38 | 114.98 | 3.01 |
| 3 | 2.74 | 2.69 | 98.18 | 1.39 |
| 4 | 1.91 | 1.79 | 93.72 | 2.15 |
| 5 | 6.55 | 6.63 | 101.22 | 2.63 |
Conclusions
We employed a SWCNH–HPtNP complex as Ab1 tags and used amino–PAMAM to link the SWCNH–HPtNP complex and Ab1 through the function of glutaraldehyde. We utilized HPtNPs and HRP to enhance the electron transfer through the catalytic reduction of H2O2. Overall, we developed a novel PCT immunosensor by adopting a direct method based on the previously described new materials. The PCT immunosensor exhibits high sensitivity, good stability and ideal selectivity compared with the conventional methods. Moreover, the immunosensor fabrication process is simple. Thus, this immunosensor may provide a new means for PCT detection and could certainly provide a novel immunosensor model for other illness markers through the utilization of different Abs.Conflict of interest
We declare to have no conflict of interest related to the submission of this article.Acknowledgements
This work was supported by the Chongqing Science and Technology Commission (CSTC2011AB5035). We appreciate the valuable comments from other members of our laboratories.References
- M. Christ-Crain, N. G. Morgenthaler, J. Struck, S. Harbarth, A. Bergmann and B. Muller, Crit. Care, 2005, 9, R816–R824 CrossRef PubMed.
- N. Aikawa, S. Fujishima, S. Endo, I. Sekine, K. Kogawa, Y. Yamamoto, S. Kushimoto, H. Yukioka, N. Kato, K. Totsuka, K. Kikuchi, T. Ikeda, K. Ikeda, K. Harada and S. Satomura, J. Infect. Chemother., 2005, 11, 152–159 CrossRef CAS PubMed.
- M. Assicot, D. Gendrel, H. Carsin, J. Raymond, J. Guilbaud and C. Bohuon, Lancet, 1993, 341, 515–518 CrossRef CAS.
- W. Karzai, M. Oberhoffer, A. Meier-Hellmann and K. Reinhart, Infection, 1997, 25, 329–334 CrossRef CAS.
- S. Russwurm, M. Wiederhold, M. Oberhoffer, I. Stonans, P. F. Zipfel and K. Reinhart, Clin. Chem. Lab. Med., 1999, 37, 789–797 CrossRef CAS PubMed.
- S. Kurabuchi and S. Tanaka, J. Histochem. Cytochem., 2002, 50, 903–909 CrossRef CAS PubMed.
- P. J. Peters and J. Pierson, Methods Cell Biol., 2008, 88, 131–149 CAS.
- C. Zuber, J. Fan, B. Guhl and J. Roth, Ultrastruct. Pathol., 2005, 29, 319–330 CrossRef PubMed.
- T. R. Holford, F. Davis and S. P. Higson, Biosens. Bioelectron., 2012, 34, 12–24 CrossRef CAS PubMed.
- S. Centi, S. Laschi and M. Mascini, Bioanalysis, 2009, 1, 1271–1291 CrossRef CAS PubMed.
- S. Iijima, M. Yudasaka, R. Yamada, S. Bandow, K. Suenaga, F. Kokai and K. Takahashi, Chem. Phys. Lett., 1999, 309, 165–170 CrossRef CAS.
- S. Y. Zhu, H. J. Li, W. X. Niu and G. B. Xu, Biosens. Bioelectron., 2009, 25, 940–943 CrossRef CAS PubMed.
- T. Murakami, K. Ajima, J. Miyawaki, M. Yudasaka, S. Iijima and K. Shiba, Mol. Pharmaceutics, 2004, 1, 399–405 CrossRef CAS.
- E. Bekyarova, K. Murata, M. Yudasaka, D. Kasuya, S. Iijima, H. Tanaka, H. Kahoh and K. Kaneko, J. Phys. Chem. B, 2003, 107, 4681–4684 CrossRef CAS.
- T. Yoshitake, Y. Shimakawa, S. Kuroshima, H. Kimura, T. Ichihashi, Y. Kubo, D. Kasuya, K. Takahashi, F. Kokai and M. Yudasaka, Phys. B, 2002, 323, 124–126 CrossRef CAS.
- T. Ohba, K. Murata, K. Kaneko, W. A. Steele, F. Kokai, K. Takahashi, D. Kasuya, M. Yudasaka and S. Iijima, Nano Lett., 2001, 1, 371–373 CrossRef CAS.
- J. Muniz, E. Sansores, A. Olea and E. Valenzuela, Int. J. Quantum Chem., 2013, 113, 1034–1046 CrossRef CAS.
- S. Y. Zhu, Z. Y. Liu, L. Z. Hu, Y. L. Yuan and G. B. Xu, Chem.–Eur. J., 2012, 18, 16556–16561 CrossRef CAS PubMed.
- L. Zhang, J. P. Lei, J. Zhang, L. Ding and H. X. Ju, Analyst, 2012, 137, 3126–3131 RSC.
- H. P. Liang, H. M. Zhang, J. S. Hu, Y. G. Guo, L. J. Wan and C. L. Bai, Angew. Chem., Int. Ed., 2004, 43, 1540–1543 CrossRef CAS PubMed.
- Y. Vasquez, A. K. Sra and R. E. Schaak, J. Am. Chem. Soc., 2005, 127, 12504–12505 CrossRef CAS PubMed.
- S. Sadekar and H. Ghandehari, Adv. Drug Delivery Rev., 2012, 64, 571–588 CrossRef CAS PubMed.
- R. Esfand and D. A. Tomalia, Drug Discovery Today, 2001, 6, 427–436 CrossRef CAS.
- M. Senel, C. Nergiz and E. Cevik, Sens. Actuators, B, 2013, 176, 299–306 CrossRef CAS PubMed.
- Z. J. Song, R. Yuan, Y. Q. Chai, Y. Zhuo, W. Jiang, H. L. Su, X. Che and J. J. Li, Chem. Commun., 2010, 46, 6750–6752 RSC.
- H. L. Su, R. Yuan, Y. Q. Chai, L. Mao and Y. Zhuo, Biosens. Bioelectron., 2011, 26, 4601–4604 CrossRef CAS PubMed.
- J. Zeng, J. L. Huang, W. Lu, X. P. Wang, B. Wang, S. Y. Zhang and J. G. Hou, Adv. Mater., 2007, 19, 2172–2176 CrossRef CAS.
- C. B. Liu, K. Wang, S. L. Luo, Y. H. Tang and L. Y. Chen, Small, 2011, 7, 1203–1206 CrossRef CAS PubMed.
- H. L. Guo, X. F. Wang, Q. Y. Qian, F. B. Wang and X. H. Xia, ACS Nano, 2009, 3, 2653–2659 CrossRef CAS PubMed.
- X. Q. Liu, L. H. Shi, W. X. Niu, H. J. Li and G. B. Xu, Biosens. Bioelectron., 2008, 23, 1887–1890 CrossRef CAS PubMed.
- Y. S. Fang, H. Y. Wang, L. S. Wang and J. F. Wang, Biosens. Bioelectron., 2013, 51C, 310–316 Search PubMed.
| This journal is © The Royal Society of Chemistry 2014 |

