MnO2 nano/micro hybrids for supercapacitors: “Nano's Envy, Micro's pride”†
S. Roshny,
R. Ranjusha,
M. S. Deepak,
N. Sanoj Rejinold,
R. Jayakumar,
S. V. Nair and
A. Balakrishnan*
Amrita Center for Nanosciences and Molecular Medicine, Ponekkara, Kochi, India. E-mail: avinash.balakrishnan@gmail.com; Fax: +91-484-2802020; Tel: +91-484-2802020
First published on 12th March 2014
Abstract
The present study provides the first reports on a low temperature molten salt route which can generate unique architecture of MnO2 nanospikes arrayed in a peculiar fashion to form micron sized ball morphology. This morphology when employed as supercapacitor electrodes gives an advantage of surface relaxation during the charge–discharge process making it super stable. The study highlights the advantages of nanostructuring of microparticles which can answer the toxicity issues and their potential as a commercial product. This claim in the present study has been validated by cell toxicity study on human dermal fibroblasts, which established that a nano/micro hybrid structure can be relatively less toxic. Cytoskeleton rearrangements were also observed as the size of MnO2 was reduced from micron to nanoscale. A mechanism of the structure formation and the influence of the salt in controlling the process parameters as well as the morphology are also proposed. These electrodes in coin cells exhibited specific mass capacitance value as high as 1100 F g−1 with a power density and energy density of 4.5 W h kg−1 and 14 kW kg−1, respectively.
1. Introduction
Nanotechnology utilizes the unique properties of ultra-fine particles in the form of large surface area to create devices with high performance.1–4 While much of the research is focused on improving the performance of the batteries, some of the most exciting research has happened with supercapacitors, because they demonstrate longer life, can be charged quickly and deliver higher power than a conventional battery. One option being explored is making supercapacitors with nanostructures. Different nanomaterials have been employed for electrode development in both energy storage and generation devices.5 This includes different nanostructures of metal oxides, nanocarbons, chalcogenides and their composites.6,7 Metal oxides have gained a lot of attention because of their superior chemical stability and high temperature performance as electrode materials in supercapacitors and batteries.7 Among these metal oxides, MnO2 has been widely researched because of its low cost and toxicity.8 The advantages of these MnO2 nanostructures in supercapacitors include: lower internal resistance, good cycling stability and high capacitance.8–11 Moreover, as the particle size scales down from micron to nano, the number particle per volume increases by an order of nine.12 The resulting increase in surface area can be highly desirable for electrode applications since more active sites can be utilized during the redox reactions which can improve specific capacitance of the electrode overlay.13–15 But from a commercial perspective, the advantages are compromised by problems associated with environmental and health issues. For instance, nanoparticles in free form, when released into the air or water during production can accumulate in the soil, water, or plant life. Secondly, in fixed form, where they are part of a manufactured product, they can cause pollution on disposal.16 This in turn can have adverse impact on humans. So the hands are tied when it comes to fully utilising the potential nanotechnology could offer as the risks involved prove to be fatal.Manganese dioxide (MnO2) as the cathode material for supercapacitors and batteries has been widely investigated because of its low-cost, abundance, non-toxicity and high theoretical specific capacitance of 1370 F g−1.8 Although MnO2 is a biocompatible material, our studies on cell up-take and toxicity have shown that when the particle size is reduced to <100 nm, MnO2 showed higher cellular uptake than their micro-counter parts resulting in cell inflammation at topical level to humans.17 Results of these studies have been discussed later in the text. This means that once these particles are within the body they are highly mobile and in some instances can even cross the blood–brain barrier causing permanent damage.
Thus these nanoparticles can enter market only when it has been proven that there is no threat to health and the environment by regulatory bodies like Food and Drug Administration (FDA). The bill, entitled ‘the FDA Safety and Innovation Act’ which was passed in June 2012, states that “it is not enough to rely on the existing knowledge about a chemical or substance that is been cleared in its bulk state. A version of that material that is on the nanoscale may require additional testing and approvals even if it is already in the market”. Apart from the toxicity issue, an industry viable process which is simple as well as environmentally friendly and one which involves easily available precursors at attainable working temperatures is the need of the hour.18,19
MnO2 can exist as polymorphs of α, β, γ and δ type. The polymorphs differ in their physio-chemical properties which can be utilized for various applications.8–10 Amongst them, α-MnO2 is widely used as the electrode material in energy storage devices. The structure of α-MnO2 consists of double chains of edge sharing MnO6 octahedra. These octahedra share corners to form 2 × 2 as well as 1 × 1 tunnels. The 2 × 2 tunnels favor the storage of electrolytic cations due to their larger size thereby increasing diffusion and capacitance. This property makes α-MnO2 a desirable material for electrode fabrication in storage devices like supercapacitors/alkaline-batteries.8
The present article demonstrates the first report on the bulk synthesis of spike balled micro/nano hybrid structures of α-MnO2 via a low temperature molten salt route. These 3D structures exhibited a mean diameter of ∼1 μm arrayed with 1D spikes of diameter 30–50 nm. The study highlights the advantages of utilizing these hybrid structures in supercapacitor applications as well as compares its cell up take and toxicity through MTT assay (3-(4,5-dimethylthiazol-2-yl)-2,5-diphenyltetrazolium bromide) tests with their nano-counter parts. Detailed electrochemical studies have elucidated the role that surface morphology and redox reactions play to enhance the cycling and capacitive performance of the electrodes. These electrodes showed a specific mass capacitance of 1100 F g−1 with excellent cycling stability extending to 10![[thin space (1/6-em)]](https://www.rsc.org/images/entities/char_2009.gif) 000 cycles. The study revealed an intrinsic correlation between the capacitance, internal resistance and the surface morphology. This correlation could be explained considering the relative contributions from the faradaic properties of MnO2 in different electrolytes. Further, a working model supercapacitor in coin cell form is also shown exhibiting energy and power density 4.5 W h kg−1 and 14 kW kg−1, respectively.
000 cycles. The study revealed an intrinsic correlation between the capacitance, internal resistance and the surface morphology. This correlation could be explained considering the relative contributions from the faradaic properties of MnO2 in different electrolytes. Further, a working model supercapacitor in coin cell form is also shown exhibiting energy and power density 4.5 W h kg−1 and 14 kW kg−1, respectively.
2. Experimental
The chemicals used in the present study were of reagent grade obtained from Nice Chemicals, India. First, 5 g of lithium nitrate was taken in quartz crucibles and melted at 250 °C. To this melt 1 g of anhydrous MnSO4 was added under constant stirring conditions. The prepared melt mixture was heated to 350 °C for different holding time of 1, 2, 5 and 10 h in air and furnace cooled. The resultant mass was dispersed in deionized water and centrifuged at 8000 rpm for 10 min. The sediment pellet was thoroughly washed using distilled water and dried in air at 70 °C for 12 h.2.1 Electrophoretic deposition and surface characterization
Morphology and phase analyses were performed using transmission electron microscopy-selective area energy dispersive X-ray (TEM, Model: JEOL, JEM-2100F), scanning electron microscopy (SEM-JEOL, Japan) and X-ray diffraction analyses (XRD, X'Pert PRO Analytical), respectively. The resultant nanostructures were electrophoretically deposited onto a titanium substrate. For this an electrochemical setup comprising of titanium foil (1 cm × 1 cm × 0.2 mm) was used as a substrate (cathode) and platinum wire as an anode. Isopropanol solution was used as the electrolytic solvent. To this electrolyte, 10 mg of the synthesized MnO2 powder were dispersed uniformly by ultra-sonication. The deposition was carried out at 40 V for 15 min at room temperature, resulting in a thin uniform porous layer of MnO2 nanostructures. The surface porosity was determined by quantitative image analysis (using GMDH software, Charlottesville, VA) from the SEM images. Surface profilometer (VeecoDektak 150) was used to measure the surface roughness and thickness of the deposited layer. Surface area measurements were carried out using a BET analyzer (Nova Quantachrome, USA) and Atomic Force Microscopy (AFM) (JEOL SPM 5200). Stability of the electrodes were further analysed using Inductively Coupled Plasma Atomic Emission Spectroscopy (ICP-AES).2.2 Cytotoxicity studies and cellular localization by fluorescent imaging
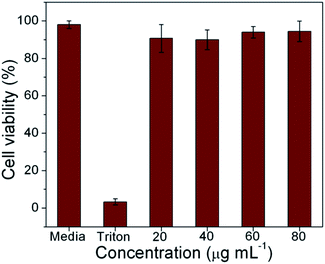
Cytotoxicity experiments were carried out on human dermal fibroblasts (HDF) by MTT assay. MTT [3-(4,5-dimethylthiazole-2-yl)-2,5-diphenyl tetrazolium] assay for cytotoxic evaluation is a colorimetric test based on the selective ability of viable cells to reduce the tetrazolium component of MTT in to purple colored formazan crystals. The cells were seeded on a 96 well plate with a density of 10![[thin space (1/6-em)]](https://www.rsc.org/images/entities/char_2009.gif) 000 cells per cm2. Four different concentrations of the samples (20, 40, 60 and 80 μg mL−1) were prepared by dilution with the media. After reaching 90% confluency, the cells were washed with phosphate buffer saline (PBS) and different concentration of the samples (100 μL) was added and incubated. Cells in media alone, devoid of samples acted as negative control and cells treated with Triton X-100 as positive control for a period of 24 h. 5 mg of MTT (Sigma) was dissolved in 1 mL of PBS and filter sterilized. 10 μL of the MTT solution was further diluted to 100 μL with 90 μL of serum-free phenol red free medium. The cells were incubated with 100 μL of the above solution for 4 h to form formazan crystals by mitochondrial dehydrogenases. 100 μL of the solubilisation buffer (10% Triton X-100, 0.1 N HCl and isopropyl alcohol) was added in each well and incubated at room temperature for 1 h to dissolve the formazan crystals. The optical density of the solution was measured at a wavelength of 570 nm using a Beckmann Coulter Elisa plate reader (BioTek Power Wave XS). Triplicate samples were analyzed for each experiment.
000 cells per cm2. Four different concentrations of the samples (20, 40, 60 and 80 μg mL−1) were prepared by dilution with the media. After reaching 90% confluency, the cells were washed with phosphate buffer saline (PBS) and different concentration of the samples (100 μL) was added and incubated. Cells in media alone, devoid of samples acted as negative control and cells treated with Triton X-100 as positive control for a period of 24 h. 5 mg of MTT (Sigma) was dissolved in 1 mL of PBS and filter sterilized. 10 μL of the MTT solution was further diluted to 100 μL with 90 μL of serum-free phenol red free medium. The cells were incubated with 100 μL of the above solution for 4 h to form formazan crystals by mitochondrial dehydrogenases. 100 μL of the solubilisation buffer (10% Triton X-100, 0.1 N HCl and isopropyl alcohol) was added in each well and incubated at room temperature for 1 h to dissolve the formazan crystals. The optical density of the solution was measured at a wavelength of 570 nm using a Beckmann Coulter Elisa plate reader (BioTek Power Wave XS). Triplicate samples were analyzed for each experiment.
For cell uptake studies, Rhodamine labelled nano/micro hybrids and nano MnO2 samples were used. Acid etched cover slips kept in 24 well plates were loaded with HDF cells with a seeding density of 20![[thin space (1/6-em)]](https://www.rsc.org/images/entities/char_2009.gif) 000 cells per cover slip and incubated for 24 h for the cells to attach well. After 24 h incubation, the media was removed and the wells were carefully washed with PBS buffer. Then the particle at a concentration of 60 μg mL−1 was added along with the media in triplicate to the wells and incubated for a time period of 24 h. After the particular incubation time, media with sample were removed and the cover slips were processed for fluorescent imaging. The processing involved washing the cover slips with PBS and fixing the cells in 3.7% para formaldehyde (PFA) followed by a final PBS wash. The cover slips were air dried and mounted on to glass slides with DPX as the mountant. The slides were then viewed under the microscope to study the internalization.
000 cells per cover slip and incubated for 24 h for the cells to attach well. After 24 h incubation, the media was removed and the wells were carefully washed with PBS buffer. Then the particle at a concentration of 60 μg mL−1 was added along with the media in triplicate to the wells and incubated for a time period of 24 h. After the particular incubation time, media with sample were removed and the cover slips were processed for fluorescent imaging. The processing involved washing the cover slips with PBS and fixing the cells in 3.7% para formaldehyde (PFA) followed by a final PBS wash. The cover slips were air dried and mounted on to glass slides with DPX as the mountant. The slides were then viewed under the microscope to study the internalization.
2.3 Electrochemical characterization
Cyclic voltammetry (CV) and constant current charge–discharge were performed to evaluate the capacitance. Electrochemical impedance spectroscopy (EIS) (electrochemical workstation: Newport Model) was performed under a biased potential of 0.2 V to measure the charge transfer resistance of the prepared electrode in the frequency range of 100![[thin space (1/6-em)]](https://www.rsc.org/images/entities/char_2009.gif) 000–0.1 Hz. For the above electrochemical studies, a three-electrode setup consisting of electrophoretically deposited MnO2 powder, platinum and calomel electrodes were used as working, counter and reference electrodes respectively. Different electrolytes comprising of KOH, NaOH and LiOH in 1 M concentrations were used. From the best system determined, CV was performed for different scan rates of 100, 50, 20, 10 and 5 mV s−1. The specific capacitance was measured. The cycling stability was also determined using CV for 10
000–0.1 Hz. For the above electrochemical studies, a three-electrode setup consisting of electrophoretically deposited MnO2 powder, platinum and calomel electrodes were used as working, counter and reference electrodes respectively. Different electrolytes comprising of KOH, NaOH and LiOH in 1 M concentrations were used. From the best system determined, CV was performed for different scan rates of 100, 50, 20, 10 and 5 mV s−1. The specific capacitance was measured. The cycling stability was also determined using CV for 10![[thin space (1/6-em)]](https://www.rsc.org/images/entities/char_2009.gif) 000 cycles. ICP-AES studies were done to determine the dissolution of the material in the electrolyte.
000 cycles. ICP-AES studies were done to determine the dissolution of the material in the electrolyte.
3. Results and discussions
3.1 Phase and morphological analysis
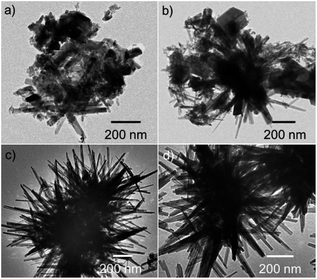
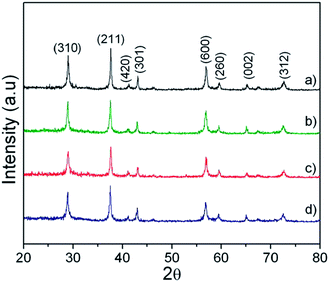
Fig. 1(a–d) show the TEM images displaying the evolution of MnO2 morphology synthesised under different processing times of 1, 2, 5 and 10 h. It was observed that as the processing time increased from 1 to 10 h, the morphology showed prominent spikes arrayed randomly to form microspheres. These microspheres showed diameter varying from 1–2 μm. The spike showed thickness ranging from 30–70 nm.Fig. 2 shows the XRD pattern of the processed powder at various times. The diffraction peaks corresponded to pure tetragonal phases of α-MnO2 (JCPDS 44-0141). This time dependent morphological evolution is schematically represented in Fig. 3. During the initial formation stage, the reactant gets diffused into the salt and dissolves in it. This stage is followed by the formation of nuclei which can be expressed by the reaction (1) shown below:
| MnSO4 → MnO2 + SO2 | (1) |
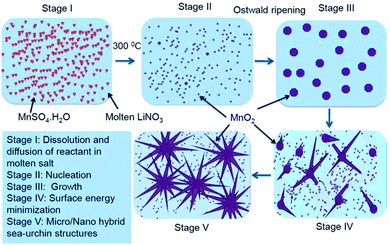 | ||
| Fig. 3 Schematic representation of the time dependent morphological evolution of the nano/micro structure. | ||
The MnO2 nuclei formed can undergo Ostwald ripening (crystal growth stage) and aggregate into nanosized spheroidal particles. The spheroids thus formed may act as crystal growth sites, which can adsorb newly formed nuclei onto its surfaces. The degree of adsorption is determined by the surface energies of the different facets of the base crystal. The nuclei gets attached itself to the high surface energy facet as a part of surface energy minimisation and continues to grow along the incited direction. The spike formation and growth seem to stabilize at the end 5 h. This structure was retained for longer time periods of 10 h as seen from the TEM images (see Fig. 1(d)). Thus the further characterization was done on 5 h samples. Hereby these samples are designated as M-5.
3.2 Cytotoxicity studies
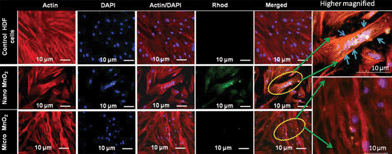
The M-5 samples were compared with ∼50 nm MnO2 powders (for TEM please see ESI-I†) and studied for their cell toxicity and cell uptake. The BET surface area (see ESI-II†) for M-5 and the nanopowders was measured to be 18 and 38 m2 g−1, respectively. MTT assay confirmed the biocompatibility of M-5 (Fig. 4).Even as these tests confirm the biocompability of MnO2, it was observed that cell uptake was higher in case of nano-MnO2. From Fig. 5, it was evident that the nano-MnO2 exhibited higher cellular uptake, modulating the cytoskeletal arrangements of HDF cells as depicted with actin dye (purple spots).
As explained earlier, such an uptake can be detrimental considering the fact that it can penetrate the blood brain barrier. Further observations showed distorted cell nucleus with expanded cell morphology confirming enhanced cellular uptake of the nano MnO2 in comparison to M-5. Such a cell inflammatory response was also an indication of its toxicity for humans at the topical level.
However, M-5 samples showed no uptake by the HDF cells. This means that lack of safety protocols while handling the energy storage devices during processing and disposal can lead to the penetration of these nanopowders into the blood stream. These results showed that M-5 did not pose any health threats on exposure.
3.3 Electrochemical studies
For electrochemical studies, M-5 samples were deposited as thin films onto titanium plates. The surface morphology of these coatings (Fig. 6(a)) showed a roughened and porous layer. The mean surface roughness (Ra) measured from AFM was found to be 200 ± 45 nm (see ESI-III†). | ||
| Fig. 6 SEM image of (a) Ti plate coated with M-5 samples and (b) cross sectional image of the coating. | ||
The SEM cross-sectional image (Fig. 6(b)) showed this deposited layer having a thickness of ∼30 μm.
| MnO2 + yC+ + e− ↔ yMnOOK + (1 − y)MnO2 + e− | (2) |
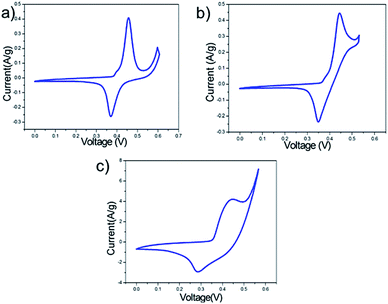
The best performing electrolyte was found to be 1 M KOH, in which the CV curves showed higher current when compared to NaOH and LiOH. The reason for this could be mainly attributed to the low hydrated radius of K+ ions (0.25 nm) as compared to Na+ (0.36 nm) and Li+ (0.42 nm).8,20 This becomes relevant as the tunnel cavity of α-MnO2 has an inner diameter of 0.38 nm which can facilitate the intercalation and de-intercalation of hydrated K+.20–22 Moreover, the peculiar architecture of MnO2 when employed as thin films can also enhance the electrode–electrolyte interaction which can play a pivotal role in improving the capacitance. Thus, further studies were conducted with 1 M KOH.
 | (3) |
![[thin space (1/6-em)]](https://www.rsc.org/images/entities/char_2009.gif) 000 cycles. This was further confirmed by ICP-AES analysis where no electrode dissolution in the electrolyte occurred at the end of 1st and 10
000 cycles. This was further confirmed by ICP-AES analysis where no electrode dissolution in the electrolyte occurred at the end of 1st and 10![[thin space (1/6-em)]](https://www.rsc.org/images/entities/char_2009.gif) 000th cycle.
000th cycle.
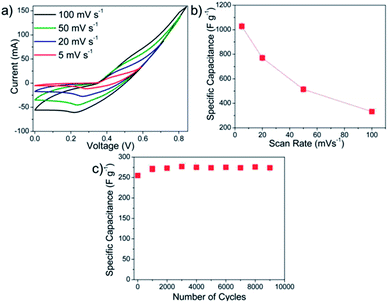 | ||
| Fig. 8 (a) CV curves at different scan rates, (b) plot of scan rate vs. capacitance and (c) cycling studies at 200 mV s−1. | ||
Capacitance fading is generally attributed to the dissolution of the oxide film into the electrolyte. Any structural variations within an electrode overlay can play a significant role in determining the final stability. During the cyclic volumetric expansion–contraction, these electrodes tend to be stretched and relaxed, leading to tensile and compressive stresses on the entire overlay. Since these spiked micro/nano-hybrid structures are deposited in a 3-D stacked plane, the electrode overlay can distribute these microscopic stresses isotropically along the matrix. Further, the inter-locking of these spikes could also increase shear strength of the electrode structure, which in turn may help to prevent crack formation thereby preventing any peeling under cycling.8,25
Further, an increase in capacitance was observed during the initial cycles prior to the stabilization. It has been shown that the porous microstructure is electrochemically favorable since it can provide substantially larger spatial clearance for electrode expansion and contraction during cycling. Upon prolonged cycling, expansion and contraction of the electrode overlay open new active sites within the porous structure which participates in the charge-transfer mechanism and increases the capacitance values. A similar phenomenon has been reported earlier in a literature where MnO2 nanostructures in the form of thin film nanoporous electrodes in combination with 1 M KOH electrolyte have been used wherein the mass specific capacitance increased by ∼45%.8
 | (4) |
 | (5) |
 | (6) |
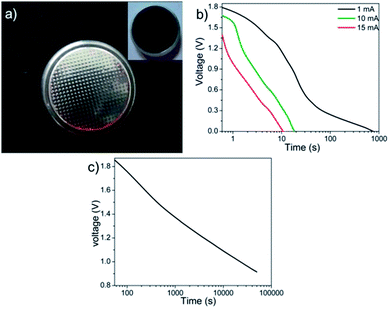 | ||
| Fig. 9 (a) Coin cell with the cathode coating in the inset, (b) constant current discharge performance at different discharging currents and (c) self-discharge behaviour of M-5 coin cells. | ||
The slight deviation of the linear characteristics for each discharge curve was observed. This deviation from the linear trend could be attributed to either of the following factors i.e. (a) variation in the direct equivalent series resistance, (b) the re-arrangement of charges within the pores of the material structure during the discharge and (c) the redox behavior of the material.26,27 The capacitance values were measured to be 450, 12 and 11 mF at discharge currents of 1 mA, 10 mA and 15 mA respectively. The reduction in capacitance values with increase in applied current is well known phenomenon for transition metal oxide systems.29,30 The fading of capacitance at higher currents can be attributed to an assortment of multiple factors like voltage (IR) drop, distributed pore resistance on the electrode overlay and severe redox reactions on the metal oxide electrode surface.28 However, isolating the role of individual factor affecting the electrode's performance is difficult. Fig. 9(c) shows the self-discharge behavior for period of ∼14 h where the total-discharge was found to be ∼50% indicating low self-discharge property. The maximum energy density and peak power density values for these coin cells were found to be 4.5 W h kg−1 and 14 kW kg−1, respectively.
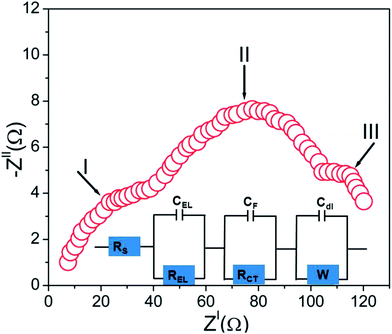
The impedance measurements of the MnO2 nano/micro hybrid system in KOH electrolyte were performed in the frequency range of 0.1 to 105 Hz. The Nyquist plot of these hybrid samples are presented in Fig. 10 and the corresponding equivalent circuit model is shown as the inset of Fig. 10. The equivalent circuit for this Nyquist plot was obtained by using the circuit fitting tool in the FRA software representing a third order RC network system. The impedance behavior of the sample was analysed in three frequency regions such as high, medium and low-frequency to evaluate the different mechanisms occurring in different frequency domains. The first point of intersection with the real axis gives the electrolyte/solution resistance (Rs) where MnO2 behaves like a pristine resistor. The two partial semicircles at high and medium frequency regions can be attributed to the different charge transfer mechanisms in the nano/micro hybrid system as a result of redox reactions. The appearance of high frequency semicircle (region-I) is mainly attributed to the charge propagation phenomenon occurring at the interface of MnO2 nano/micro hybrid and KOH electrolyte and can be modelled as interfacial capacitance at the solid-electrolyte layer CEL in parallel with the electrolyte resistance REL. This REL is the resistance resulting from the discontinuity in the charge propagation phenomenon occurring at the MnO2/KOH interface, which arises from the difference in electronic conductivity of MnO2 and ionic conductivity of the KOH electrolyte. The second semicircle (region-II) at the medium frequency regions correspond to the charge-transfer resistance (RCT) due to redox processes in the system which involves the exchange of K+ ions and this charge transfer is associated with the surface phenomena of the nano/micro hybrid system. This characteristic feature of the hybrid system can be modeled as thin film impedance due to the redox processes involving electron hopping mechanism in the MnO2 hybrid system and K+ ions diffusion. This will consist of a film capacitor, CF, in parallel with the RCT.31,32 At a lower frequency region of the Nyquist plot, Warburg impedance gets displayed as a partial semicircle (region-III), and is described as diffusive resistance (W) of the K+ ion within the hybrid electrode pores. Generally a straight vertical line along the imaginary axis ZII is observed for an ideally polarized system where as in a practical supercapacitor, a finite slope appears in this line which represents the diffusive resistance of electrolyte in electrode pores and ion diffusion in MnO2 as the diffusion of K+ is not same in the liquid electrolyte and solid electrode materials. The presence of Warburg indicates the dense nature of these spiked ball structure.33 The storage mechanism in this region is predominated by double layer mechanism Cdl which can be modelled parallel to Warburg resistance (W).
4. Conclusions
The present study investigates the storage performance of MnO2 nano/micro hybrids for supercapacitors. The MnO2 nano/micro clusters were synthesized using a low temperature molten salt method, wherein several nanospikes assembled to form these clusters. MTT assay tests showed low cell uptake in human dermal fibroblasts as compared to their nano-counter parts. These hybrid clusters were employed as an electrode in a fully functional coin cell exhibiting an energy density and power density of 4.5 W h kg−1 and 14 kW kg−1, respectively, with a low self-discharge behavioural trend. These electrodes showed super stability even at the end of 10![[thin space (1/6-em)]](https://www.rsc.org/images/entities/char_2009.gif) 000 cycles. EIS studies demonstrated that these systems can exhibit an equivalent circuit corresponding to a third order transient response. The performance of these micro/nano hybrid MnO2 systems is promising considering their low cost and facile fabrication process.
000 cycles. EIS studies demonstrated that these systems can exhibit an equivalent circuit corresponding to a third order transient response. The performance of these micro/nano hybrid MnO2 systems is promising considering their low cost and facile fabrication process.
Acknowledgements
Council of Scientific and Industrial Research (CSIR), Government of India is gratefully acknowledged for its financial support under project no. 22(0565)/12/EMR-II. MNRE is also acknowledged for providing with the infrastructural support. DST-Government of India is also acknowledged for supporting Dr Avinash Balakrishnan under the Fast Track Scientist-Scheme.Notes and references
- B. E. Conway, Electrochemical Supercapacitor: Scientific Fundamentals and Technological Applications, Kluwer Academic/Plenum Publishers, New York, 1999 Search PubMed
.
- P. Simon and Y. Gogotsi, Nat. Mater., 2008, 7, 845 CrossRef CAS PubMed
.
- M. Jayalakshmi and K. Balasubramanian, Int. J. Electrochem. Sci., 2008, 3, 1196–1217 CAS
.
- A. Burke, J. Power Sources, 2000, 91, 37–50 CrossRef CAS
.
- M. Wohlfahrt-Mehrens, J. Schenk, P. M. Wilde, E. Abdelmula, P. Axmann and J. Garche, J. Power Sources, 2002, 105, 182–188 CrossRef CAS
.
- B. E. Conway, V. Birss and J. Wojtowicz, J. Power Sources, 1997, 66, 1–14 CrossRef CAS
.
- G. Wang, L. Zhang and J. Zhang, Chem. Soc. Rev., 2012, 41, 797–828 RSC
.
- R. Ranjusha, A. S. K. Nair, S. Ramakrishna, P. Anjali, K. Sujith, K. R. V. Subramanian, N. Sivakumar, T. N. Kim, S. V. Nair and A. Balakrishnan, J. Mater. Chem., 2012, 22, 20465 RSC
.
- X. Lang, A. Hirata, T. Fujita and M. Chen, Nat. Nanotechnol., 2011, 6, 232–236 CrossRef CAS PubMed
.
- R. N. Reddy and R. G. Reddy, J. Power Sources, 2003, 124, 330–335 CrossRef CAS
.
- R. N. Reddy and R. G. Reddy, J. Power Sources, 2004, 132, 315–320 CrossRef CAS
.
- D. L. Schodek, P. Ferreira and M. F. Ashby, Nanomaterials, Nanotechnologies and Design: An Introduction for Engineers and Architects, Butterworth-Heinemann Ltd, UK, 2009, p. 187 Search PubMed
.
- M. W. Xu, L. B. Kong, W. J. Zhou and H. L. Li, J. Phys. Chem. C, 2007, 111, 19141–19147 CAS
.
- S. L. Brock, N. G. Duan, Z. R. Tian, O. Giraldo, H. Zhou and S. L. Suib, Chem. Mater., 1998, 10, 2619–2628 CrossRef CAS
.
- C. Burda, X. B. Chen, R. Narayanan and M. A. El-Sayed, Chem. Rev., 2005, 4, 1025–1102 CrossRef PubMed
.
- C. Buzea, I. I. Pacheco and K. Robbie, Biointerphases, 2007, 2, MR17–MR71 CrossRef PubMed
.
- N. Sanoj Rejinold, R. Ranjusha, A. Balakrishnan, N. Mohammed and R. Jayakumar, RSC Adv., 2014, 4, 5819–5825 RSC
.
- N. Sui, Y. Duan, X. Jiao and D. Chen, J. Phys. Chem. C, 2009, 113, 8560–8565 CAS
.
- B. Li, G. Rong, Y. Xie, L. Huang and C. Feng, Inorg. Chem., 2006, 45, 6404–6410 CrossRef CAS PubMed
.
- Y. U. Jeong and A. Manthiram, J. Electrochem. Soc., 2002, 149, A1419 CrossRef CAS
.
- J. Jiang and A. Kucernak, Electrochim. Acta, 2002, 47, 2381 CrossRef CAS
.
- G. G. Kumar and S. Sampath, Solid State Ionics, 2003, 160, 289 CrossRef CAS
.
- R. Ranjusha, S. Ramakrishna, A. S. K. Nair, P. Anjali, S. Vineeth, T. S. Sonia, N. Sivakumar, K. R. V. Subramanian, S. V. Nair and A. Balakrishnan, RSC Adv., 2013, 3, 17492–17499 RSC
.
- R. Ranjusha, K. M. Sajesh, S. Roshny, V. Lakshmi, P. Anjali, T. S. Sonia, A. Sreekumaran Nair, K. R. V. Subramanian, S. V. Nair, K. P. Chennazhi and A. Balakrishnan, Microporous Mesoporous Mater., 2014, 186, 30–36 CrossRef CAS
.
- S. Cheng, D. Yan, J. T. Chen, R. F. Zhuo, J. J. Feng, H. J. Li, H. T. Feng and P. X. Yan, J. Phys. Chem. C, 2009, 113, 13630 CAS
.
- S. Chen, J. Zhu, X. Wu, Q. Han and X. Wang, ACS Nano, 2010, 4, 2822 CrossRef CAS PubMed
.
- J. Chen, N. Xia, T. Zhou, S. Tan, F. Jiang and D. Yuan, Int. J. Electrochem. Sci., 2009, 4, 1063 CAS
.
- S. K. Meher, P. Justin and G. R. Rao, Electrochim. Acta, 2010, 55, 8388 CrossRef CAS
.
- C. Yuan, X. Zhang, L. Su, B. Gao and L. Shen, J. Mater. Chem., 2009, 19, 5772 RSC
.
- J. W. Lang, L. B. Kong, W. J. Wu, Y. C. Luo and L. Kang, Chem. Commun., 2008, 4213 RSC
.
- P. Kurzweil, The 14th International Seminar On Double Layer Capacitors, Deerfield Beach, FL, U.S.A., 2004 Search PubMed
.
- A. J. Bard and L. R. Faulkner, Electrochemical Methods, JohnWiley & Sons, New York, 1980, ch. 9 Search PubMed
.
- S. K. Meher, P. Justin and G. R. Rao, Nanoscale, 2011, 3, 683–692 RSC
.
Footnote |
| † Electronic supplementary information (ESI) available: SEM and TEM of MnO2 nanoparticles, BET of M-5 sample and AFM analysis of M-5 coating. See DOI: 10.1039/c4ra00935e |
| This journal is © The Royal Society of Chemistry 2014 |

