Photoelectrochemical response and electronic structure analysis of mono-dispersed cuboid-shaped Bi2Fe4O9 crystals with near-infrared absorption†
Yangyang
Zhang
,
Yiping
Guo
*,
Huanan
Duan
,
Hua
Li
,
Lei
Yang
,
Pei
Wang
,
Chongyang
Sun
,
Biyi
Xu
and
Hezhou
Liu
*
State Key Laboratory of Metal Matrix Composites, School of Materials Science and Engineering, Shanghai Jiaotong University, Room 331, Material Building D, Dongchuan Road No. 800, Minhang District, Shanghai, 200240, People's Republic of China. E-mail: ypguo@sjtu.edu.cn; hzhliu@sjtu.edu.cn; Tel: +86 021 34202549
First published on 18th June 2014
Abstract
An n-type mono-dispersed cuboid-shaped Bi2Fe4O9 semiconductor is synthesized via a hydrothermal method in concentrated NaOH solution. It is demonstrated that Bi2Fe4O9 phase is formed by the reaction of Bi25FeO40 crystal and amorphous Fe(OH)3. A doctor-blade technique is employed to determine the orientation of Bi2Fe4O9 cuboids. It is found that the cuboids are preferentially grown along [001] direction with side facets (110) and (![[1 with combining macron]](https://www.rsc.org/images/entities/char_0031_0304.gif) 10) parallel to it. The UV-visible-near infrared absorption spectrum shows that besides two broad absorption edges in visible spectrum region, remarkable near-infrared absorption is also observed, indicating Bi2Fe4O9 is a promising semiconductor capable of utilizing all solar band energy. Hence, steady and distinct photocurrents are measured to be 0.35 μA cm−2, 7 μA cm−2 and 33 μA cm−2 under near-infrared irradiation, visible-light and simulated sunlight, respectively. First principle calculation is used to reveal the electronic structure of Bi2Fe4O9 and the derived band gap is 1.23 eV, which agrees well with our experimental value of 1.29 eV. The calculation results also show that Bi2Fe4O9 is an indirect bandgap semiconductor which is contrary to previous results. Besides, the extra absorption peak at around 700 nm in the UV-visible-near infrared spectrum should be attributed to the intervalence charge transfer induced by unevenly distributed [FeO6]9− octahedrons and [FeO4]5− tetrahedrons rather than the previously reported d–d transition which is both spin and Laporte forbidden. Our work provides deep insights into the nature of the band structure of Bi2Fe4O9, and will facilitate the design of composite photoanodes that can response to near-infrared light.
10) parallel to it. The UV-visible-near infrared absorption spectrum shows that besides two broad absorption edges in visible spectrum region, remarkable near-infrared absorption is also observed, indicating Bi2Fe4O9 is a promising semiconductor capable of utilizing all solar band energy. Hence, steady and distinct photocurrents are measured to be 0.35 μA cm−2, 7 μA cm−2 and 33 μA cm−2 under near-infrared irradiation, visible-light and simulated sunlight, respectively. First principle calculation is used to reveal the electronic structure of Bi2Fe4O9 and the derived band gap is 1.23 eV, which agrees well with our experimental value of 1.29 eV. The calculation results also show that Bi2Fe4O9 is an indirect bandgap semiconductor which is contrary to previous results. Besides, the extra absorption peak at around 700 nm in the UV-visible-near infrared spectrum should be attributed to the intervalence charge transfer induced by unevenly distributed [FeO6]9− octahedrons and [FeO4]5− tetrahedrons rather than the previously reported d–d transition which is both spin and Laporte forbidden. Our work provides deep insights into the nature of the band structure of Bi2Fe4O9, and will facilitate the design of composite photoanodes that can response to near-infrared light.
Introduction
Conventional n-type metal oxides such as TiO2, WO3 and ZnO for applications in photoanodes and photocatalysts have been intensively studied.1–3 However, they have low response to ultraviolet (UV) light owing to their wide band gaps (typically ∼3.2 eV) and thus the solar energy utilization is insufficient. Hence, narrow bandgap metal oxides capable of capturing a substantial part of visible light are receiving more and more attention. For example, some metal oxides, such as Bi2WO6 which is reported to be able to harvest near-infrared (NIR) irradiation and organometal halide perovskites (i.e. CH3NH3PbI3) which possess high molar absorption coefficient in all visible light range are now hot topics in photovoltaic applications.4,5Multiferroic BiFeO3 with a band gap of ∼2.2–2.8 eV has attracted a great deal of attention for its potential applications in resistive memory and solar cells.6–8 As another typical bismuth ferrite, Bi2Fe4O9 (BFO) with a previously evaluated narrow band gap of ∼2.0 eV is also of interest. Most studies to date have focused on using BFO as powder-type photocatalysts for decomposition of organic compounds or as semiconductor gas sensors rather than using BFO as a photoanode in a water photoelectrolysis cell and as sensors in NIR related areas.9–12
BFO can be obtained via traditional solid-state reaction method, chemical co-precipitation route, sol–gel method, molten-salt technique and hydrothermal process.12–16 However, pure BFO is difficult to prepare because the kinetics of phase formation in the Bi2O3–Fe2O3 pseudo-binary system can easily lead to the coexistence of compounds such as BiFeO3, BFO and Bi25FeO40.17 Among all the methods that have been developed, hydrothermal process is a controllable, low temperature, facile and cost effective method to realize large scale production of pure orthorhombic BFO with regular shapes including nanosheets, nanoplates and microcubes.18 To date, the synthesis of mono-dispersed BFO crystal with regular shape and uniform size via hydrothermal method has not been reported, and the chemical reactions during the synthesis of BFO crystals remain unclear.
To the best of our knowledge, a large majority of single-phased metal oxide semiconductors usually have only one absorption edge in visible light range. However, BFO exhibits two distinct absorption edges in visible light range, one is from 610 nm and the other is from 850 nm.9,12,19 To interpret the origin of the extra absorption edge observed at 850 nm, Sun and co-workers carried out the first principle calculation and they proposed a middle band (Em) that consisted of Fe eg (O)/Fe t2g (T). BFO was thus defined as a multiband semiconductor with two band gaps (2.05 eV and 1.53 eV) and the extra absorption edge was ascribed to the d–d transition between Em and the bottom of the conduction band composed of Fe t2g (O)/Fe eg (T).12,19 Besides, a symmetric density of states (DOS) for BFO which is spin polarized was also proposed. On the contrary, Pchelkina et al. derived an asymmetric DOS in BFO and a single bandgap varied from 0.97 eV to 1.28 eV based on their ab initio investigation.20 Therefore, whether BFO belongs to a multiband semiconductor or not is still quite elusive and the conclusion that d–d transition results in the extra absorption edge remains controversial as well. It is known that semiconductors can be divided into two categories, namely direct bandgap semiconductor and indirect semiconductor, depending on the feature of their interband transitions.21 On the basis of optical spectrum, Tauc's relation is a frequently used method to determine the interband transition type.22 However, it is not sufficient to tell the feature of interband transition only through this relationship. First principle calculations have successfully predicted the interband transition feature of many semiconductors including silicon (Si), germanium (Ge), gallium arsenide (GaAs), zinc sulfide (ZnS), BiFeO3 and so on.23,24 BFO was used to be regarded as a direct band gap semiconductor with a narrow band gap of ∼2.0 eV according to the analysis of its UV-Vis spectrum.12 However, there is no theoretical calculations on determining its interband transition type up to now.
In this study, mono-dispersed BFO cuboids were successfully synthesized via a hydrothermal method. The growth mechanism, the origin of the extra absorption edge, the interband transition feature and the photoelectrochemical response of the cuboid-shaped BFO were studied. An interesting NIR response was first observed and analyzed in the BFO crystals.
Experimental method
Synthesis of BFO cuboids
All chemicals used in the synthesis of BFO cuboids are of analytical grade purchased from Sinopharm Chemical Reagent Co., Ltd. The precursor suspensions were prepared by using bismuth nitrate (Bi(NO3)3·5H2O), ferric nitrate (Fe(NO3)3·9H2O) and sodium hydroxide (NaOH) as the starting materials. Briefly, 3 mmol Bi(NO3)3·5H2O was added into 40 ml deionized (DI) water under constant stirring for 1 h to give a homogeneous milk-white suspension, which is resulted from the hydrolysis of bismuth nitrate. 6 mmol Fe(NO3)3·9H2O was then added to the above suspension and stirred for another 1 h. Subsequently, 0.75 mol NaOH was dropped in slowly to precipitate Bi3+ and Fe3+ and the molar concentration of NaOH is 18.75 M. The as-obtained dark brown mixture was transferred into a 50 ml Teflon-lined stainless-steel autoclave to 80% of its total volume. The autoclave was held at 180 °C for different time (0 h, 0.5 h, 1 h, 2 h, 6 h, 24 h) and then cooled down to ambient temperature naturally. The final products, denoted as S-0 h, S-0.5 h, S-1 h, S-2 h, S-6 h and S-24 h hereafter, were obtained by washing with DI water for several times to remove any possible diffluent impurities followed by drying at 60 °C for 5 h.Characterization
Morphologies of the products were observed with a field emission scanning electron microscope (FEI Sirion 200 SEM) operated at 10 kV. Phase purity was confirmed by powder XRD analysis (Rigaku D/MAX255ovl/84, Cu Kα radiation) from 10° to 70° (2θ) at a scan rate of 4° min−1 under 35 kV and 200 mA. Diffuse-reflectance spectroscopy of the sample S-24 h was measured by UV-Vis-NIR spectrometer (PerkinElmer 750S) between 200-1500 nm with analytical BaSO4 powder as the baseline correction material. X-ray photoelectron spectrum (XPS) was collected on a Kratos Axis Ultra DLD using Mg Kα radiation as the X-ray source.Preparation of doctor-blade BFO (DB-BFO)
A doctor-blade technique was used to determine the orientation of cuboid shaped BFO crystals because a substantial part of BFO cuboids were likely to lie down to lower their barycenter upon scraping and finally resulted in an oriented BFO film. In our work, a mixture of 3 g S-24 h and 6 ml 5 wt% polyvinyl alcohol (PVA, analytical reagent) aqueous solution was deposited onto a cleaned glass slide with a doctor-blade coating method followed by calcination at 500 °C for 3 h to remove PVA.Photoelectrochemical measurement
For photoelectrochemical measurements, BFO film electrode with a thickness up to ∼20 μm was prepared on fluorine doped tin oxide (FTO) glass using the doctor-blade method. A strip of copper foil was connected to the conductive side of FTO glass using conductive tape to create an ohmic contact. Then the whole device was sealed with insulating epoxy resin to control the exposed area of BFO film to be 1 cm × 1 cm. The photoelectrochemical performance of cuboid-shaped BFO film electrodes were performed in a three electrode setup in a 0.1 M potassium phosphate (K3PO4) solution (pH = 7) with platinum (Pt) electrode acting as the counter electrode and saturated calomel electrode (SCE) in saturated potassium chloride (KCl) as the reference electrode. The working electrode was irradiated using a 350 W Xe arc lamp (XQ-350) either with or without a cutoff filter (λ > 420 nm or λ > 780 nm) from the back of the FTO glass. All time-dependent photocurrents with chopped illumination were carried out under a constant bias of +0.7 V (vs. SCE) within 400 s.Electronic structure calculation
First-principle calculation was performed on the Castep module of Material Studio using the all-electron Blöchl’s projector augmented wave (PAW) method, within the PBE version of the generalized gradient approximation (GGA) to depict the exchange correlation functional.25,26 Accounting for the antiferromagnetic nature of BFO and the strong electronic correlations on the Fe sites, spin polarized calculation and LDA + U approximation were introduced.27,28 The cutoff energy of plane wave was set as 450 eV. The k-points sampling in Brillouin zone were carried out using Monkhorst–Pack scheme (Fig. S1†).29Results and discussion
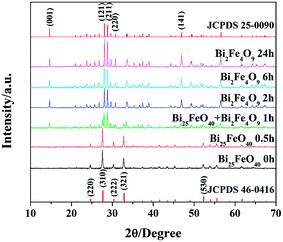
The purity and phase structure of the as-prepared samples were examined by XRD patterns, as shown in Fig. 1. It is evident that the XRD patterns of S-0 h and S-0.5 h can be fully indexed to the cubic structure of Bi25FeO40 (space group: I23, JCPDS 46-0416), whose chemical formula actually is Bi12(Bi0.5Fe0.5)O19.30 All diffraction peaks in the XRD patterns for S-2 h, S-6 h and S-24 h samples match well with the single-phase orthorhombic BFO (space group: Pbam, JCPDS 25-0090). Fig. 2 shows the morphology and fine structure of the BFO crystals synthesized at 180 °C for various time. It can be observed from Fig. 2a that S-0 h is primarily composed of a large quantity of randomly distributed Bi25FeO40 nanoparticles with diameters of about 20 nm. The nanoparticles then begin to assemble into roughly cuboid-like aggregations of Bi25FeO40 (Fig. 2b), which are probably embryos of the well-crystallized BFO cuboids. After the hydrothermal time reaches to 1 h, cuboid-shaped BFO crystals with plenty of residual Bi25FeO40 nanoparticles adhered to their surfaces come into being (Fig. 2c). The XRD pattern of S-1 h in Fig. 1 also suggests the coexistence of BFO and Bi25FeO40 crystals, which is consistent with the corresponding SEM image (Fig. 2c). Single-phase BFO cuboids can be obtained after 2 h's reaction, but massive large porous defects are randomly distributed on their surfaces (Fig. 2d and e). By further increasing the reaction time to 24 h, perfect mono-dispersed cuboid-shaped BFO crystals (Fig. 2f) with length of 2.8–3.2 μm and transverse size of 0.9–1.1 μm are finally obtained. It is worth noting that the tiny fragments appeared in Fig. 2f are also BFO rather than impurities according to the XRD pattern of S-24 h in Fig. 1 and the energy dispersive spectrum (EDS) results in Fig. S2.† These tiny fragments should be generated by the combination of fierce thermal motion and longtime corrosion of concentrated NaOH solution which as well results in crystal size reduction. As introduced in the experimental part, the mole ratio of Bi and Fe in raw materials is 1![[thin space (1/6-em)]](https://www.rsc.org/images/entities/char_2009.gif) :
:![[thin space (1/6-em)]](https://www.rsc.org/images/entities/char_2009.gif) 2, while the value of the Bi25FeO40 crystals appeared in S-0 h and S-0.5 h is merely 25
2, while the value of the Bi25FeO40 crystals appeared in S-0 h and S-0.5 h is merely 25![[thin space (1/6-em)]](https://www.rsc.org/images/entities/char_2009.gif) :
:![[thin space (1/6-em)]](https://www.rsc.org/images/entities/char_2009.gif) 1. Therefore, there must be other iron rich amorphous substances exist in S-0 h and S-0.5 h, which probably iron hydroxide (Fe(OH)3), because a light brown sol (Fig. S3†) exhibiting Tyndall effect is formed after dispersing the iron rich amorphous precipitate in DI water. In addition, compared with the content of Bi in the dried brown sol, far more abundant Fe is found according to the EDS results (Fig. S4†), which further demonstrates that the sol is primarily composed of iron hydroxide. As a result, the time-dependent experiments suggest that BFO crystal nucleuses are originated from a chemical reaction involving Bi25FeO40 and Fe(OH)3 instead of a phase transformation process.
1. Therefore, there must be other iron rich amorphous substances exist in S-0 h and S-0.5 h, which probably iron hydroxide (Fe(OH)3), because a light brown sol (Fig. S3†) exhibiting Tyndall effect is formed after dispersing the iron rich amorphous precipitate in DI water. In addition, compared with the content of Bi in the dried brown sol, far more abundant Fe is found according to the EDS results (Fig. S4†), which further demonstrates that the sol is primarily composed of iron hydroxide. As a result, the time-dependent experiments suggest that BFO crystal nucleuses are originated from a chemical reaction involving Bi25FeO40 and Fe(OH)3 instead of a phase transformation process.
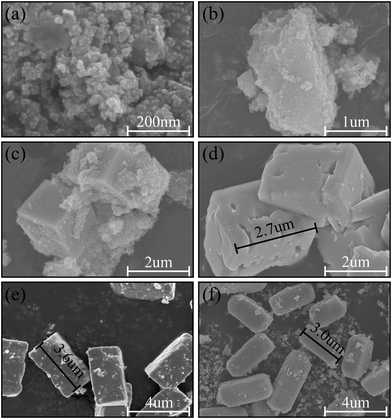 | ||
| Fig. 2 FE-SEM images of the hydrothermal products synthesized at 180 °C for (a) 0, (b) 0.5, (c) 1, (d) 2, (e) 6 and (f) 24 h. | ||
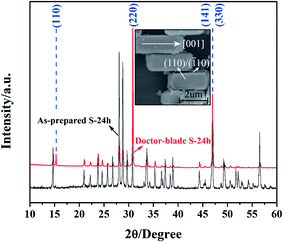
By taking advantage of the large dimension of the BFO cuboid, its orientation was determined using a DB-BFO sample assisted by XRD rather than via a typical TEM approach. Fig. 3 presents the XRD patterns of the as-prepared S-24 h and its doctor-blade sample (DB-BFO). In contrast with the XRD pattern of S-24 h, the relative intensities of the (110), (220) and (330) peaks to those of other peaks are enhanced significantly for the DB-BFO sample, suggesting more (110), (220) and (330) facets meet Bragg's law as a result of the alignment of BFO cuboids after scraping (inset of Fig. 3 and S5†). Consequently, the rectangular crystal facets, as shown in the inset of Fig. 3, should be either (110) or (![[1 with combining macron]](https://www.rsc.org/images/entities/char_0031_0304.gif) 10). The preferential growth direction of BFO cuboid should be [001], zone-axis of (110) and (
10). The preferential growth direction of BFO cuboid should be [001], zone-axis of (110) and (![[1 with combining macron]](https://www.rsc.org/images/entities/char_0031_0304.gif) 10) facets, which agrees well with the TEM results reported previously.12,15,18
10) facets, which agrees well with the TEM results reported previously.12,15,18
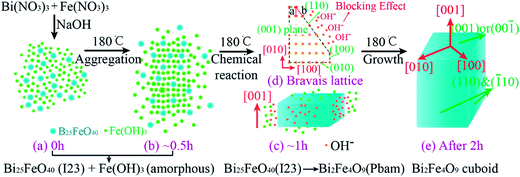
The phase and morphology evolution process during the formation of cuboid-shaped BFO were illustrated in Fig. 4. Initially, Bi(NO3)3 and Fe(NO3)3 hydrolyze into several complicated water insoluble basic salt precipitation in DI water and make the pH value decrease. Upon the addition of NaOH to the above mixture, both Bi(OH)3 and Fe(OH)3 sediments spring up immediately and they will further react with OH− to form a dense precursor composed of Bi(OH)−x3+x and Fe(OH)−y3+y. The solubility product constant of Bi(OH)3 is 4 × 10⁻³¹ which is a few orders of magnitude larger than that of Fe(OH)3 (4 × 10−38).31 Therefore, the hydrolysis of Bi(OH)3 is more significant than that of Fe(OH)3, which will lead to a higher concentration of Bi(OH)−x3+x compared to that of Fe(OH)−y3+y in the precursor. Subsequently, monoclinic Bi2O3 serves as an intermediate product, which is confirmed by a self-designed experiment as presented in Fig. S6,† is formed at first during the dehydration stage owing to the higher concentration of Bi(OH)−x3+x. As illustrated in Fig. 4a, the Bi25FeO40 crystals present in S-0 h should be attributed to the following reaction between Bi2O3 and Fe(OH)3+y−y. The main possible chemical reactions are listed as below.32,33
| Precipitation: Bi3+ + 3OH− → Bi(OH)3 | (1) |
| Fe3+ + 3OH− → Fe(OH)3 | (2) |
| Hydrolyzation: Bi(OH)3 + xOH− → Bi(OH)−x3+x | (3) |
| Fe(OH)3 + yOH− → Fe(OH)−y3+y | (4) |
| Dehydration: Bi(OH)−x3+x → Bi2O3 | (5) |
| Bi2O3 + Fe(OH)−y3+y → Bi25FeO40 | (6) |
As the reaction proceeding, the cuboid-like aggregation composed of Bi25FeO40 and Fe(OH)3 particles appears (Fig. 4b). When the compactness of the aggregation reaches a certain value, BFO nuclei start to generate due to the reaction between Bi25FeO40 crystals and its surrounding residual Fe(OH)3 (Fig. 4c). The recrystallization reaction will not be terminated until all amorphous Fe(OH)3 are consumed. The corresponding chemical reaction is as follows.
| 4Bi12(Bi0.5Fe0.5)O19.5 + 98Fe(OH)3 = 25Bi2Fe4O9 + 147H2O | (7) |
Previous studies had shown that the dominant facets of BFO crystals were (001), (110) and (![[1 with combining macron]](https://www.rsc.org/images/entities/char_0031_0304.gif) 10),34 which was also confirmed in our study. According to the Bravais law, the growth rate of (110)/(
10),34 which was also confirmed in our study. According to the Bravais law, the growth rate of (110)/(![[1 with combining macron]](https://www.rsc.org/images/entities/char_0031_0304.gif) 10) facets should be higher than that of (001) facet owing to their smaller interplanar spacing and lattice point density (Fig. 4d). Hence, BFO intrinsically prefers to grow along [110] or [
10) facets should be higher than that of (001) facet owing to their smaller interplanar spacing and lattice point density (Fig. 4d). Hence, BFO intrinsically prefers to grow along [110] or [![[1 with combining macron]](https://www.rsc.org/images/entities/char_0031_0304.gif) 10] directions to form nano-plate which has been achieved at low NaOH concentrations previously.18 However, in our experiment, BFO only grows along [001] direction to form cuboids and this abnormal growth habit should result from the high NaOH concentration (18.75 M). Products prepared with lower NaOH concentrations (12.5 M, 6.25 M, 2.5 M, 1 M, 0.5 M and 0.25 M) were characterized by SEM and XRD, as shown in Fig. S7 and S8.† BFO cannot be formed at NaOH concentrations less than 2.5 M and the aspect ratio of BFO decreases with the reduction of NaOH concentration which confirms the role of NaOH concentration. It is suggested that OH− ions are favorable to adsorb onto the (110)/(
10] directions to form nano-plate which has been achieved at low NaOH concentrations previously.18 However, in our experiment, BFO only grows along [001] direction to form cuboids and this abnormal growth habit should result from the high NaOH concentration (18.75 M). Products prepared with lower NaOH concentrations (12.5 M, 6.25 M, 2.5 M, 1 M, 0.5 M and 0.25 M) were characterized by SEM and XRD, as shown in Fig. S7 and S8.† BFO cannot be formed at NaOH concentrations less than 2.5 M and the aspect ratio of BFO decreases with the reduction of NaOH concentration which confirms the role of NaOH concentration. It is suggested that OH− ions are favorable to adsorb onto the (110)/(![[1 with combining macron]](https://www.rsc.org/images/entities/char_0031_0304.gif) 10) facets of an oxide crystal which is bound to prevent the Fe(OH)3 particles from approaching and thus modifies the intrinsic growth habit, as shown in Fig. 4d.35,36 The “blocking effect” of OH− is enhanced with the increase of NaOH concentration. Therefore, the growth rates of (110)/(
10) facets of an oxide crystal which is bound to prevent the Fe(OH)3 particles from approaching and thus modifies the intrinsic growth habit, as shown in Fig. 4d.35,36 The “blocking effect” of OH− is enhanced with the increase of NaOH concentration. Therefore, the growth rates of (110)/(![[1 with combining macron]](https://www.rsc.org/images/entities/char_0031_0304.gif) 10) facets will be reduced with the addition of NaOH while the growth rate of (001) is scarcely influenced, which eventually leads to BFO cuboids with orientation of [001] (Fig. 4e).
10) facets will be reduced with the addition of NaOH while the growth rate of (001) is scarcely influenced, which eventually leads to BFO cuboids with orientation of [001] (Fig. 4e).
From the magnified FE-SEM images centered by one corner of the BFO cuboid, one can see that some extra small facets occupy the position of some edges, as displayed in Fig. 5. Obviously, two small facets, which are labelled as 1 and 2 in both Fig. 5a and b appear at the edges of (001) surface while no facets are discovered at the edges that are perpendicular to (001), such as edge 4 in Fig. 5a and b. It is also noticeable that the sharp edge 4 and vertex 3 of S-2 h change into blunt ones due to the corrosion of alkali and violent thermal motion. For better understanding of the fine structure of BFO cuboid, a schematic of an individual BFO cuboid with all existing surfaces is presented in Fig. 5c.
 | ||
| Fig. 5 SEM images of small facets on the edges of S-2 h (a) and S-24 h (b). Schematic (c) outlines the detailed profile of an individual BFO cuboid. | ||
The influence of alkali type on the phase and shape of the products was also investigated, as shown in Fig. 6a–d. As mentioned above, cubic Bi25FeO4 crystals and amorphous Fe(OH)3 nanoparticles coexist in the initial precipitation when NaOH is used as mineralizer (Fig. 6b). However, tetragonal Bi2O2CO3 crystals (space group: I4/mmm) and some amorphous phases are obtained when NaOH is substituted with the same amount of KOH (Fig. 6a). It is inferred that the carbon element in Bi2O2CO3 can only come from the atmosphere. After the initial precipitations are both hydrothermal treated at 180 °C for 24 h, BFO cuboids are synthesized with NaOH while a mixture of spherical BiFeO3 and hexagon-like α-Fe2O3 is obtained with KOH, as shown in Fig. 6c and d. Effects of alkali ions including Li+, Na+ and K+ on the phase structure, morphology and size of rare earth fluoride or bismuth ferrite (BiFeO3) obtained by hydrothermal process have been investigated systematically.37,38 It is reported that the particle size of BiFeO3 decreases following the diminution of cationic radii (Na+ = 1.32 Å < K+ = 1.78 Å). Similarly, the dimension of BiFeO3 and Fe2O3 obtained in concentrated KOH is around 10 um which is much larger than that of Bi2Fe4O9 (around 3 um) prepared with NaOH. Therefore, the cations, such as Na+ and K+, also play a key role in the initial chemical reaction and the following crystal growth process which finally alters the phase structure and the morphology of the final products.
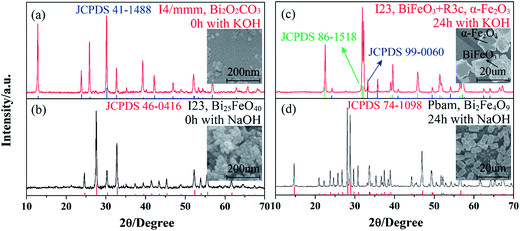 | ||
| Fig. 6 XRD patterns and SEM images of the products synthesized at 180 °C for 0 h with KOH (a), NaOH (b) and for 24 h with KOH (c), NaOH. The amount of substance of NaOH and KOH are equal here. | ||
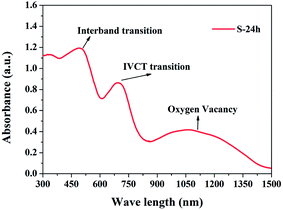
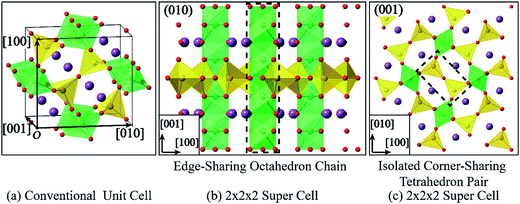
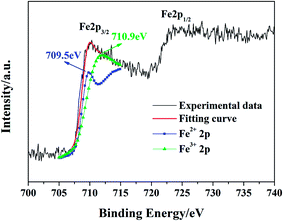
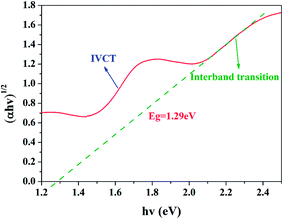
Fig. 7 shows the UV-Vis-NIR absorption spectrum of S-24 h. In general, single-phase oxide semiconductors have only one absorption edge which is usually attributed to interband transition, that's why UV-Vis spectrum can be used to evaluate the value of the band gap.6,39,40 However, different from conventional oxide semiconductors, such as BiFeO3, BiVO4, α-Fe2O3, and Bi2WO6,6,39–41 BFO crystals possess two evident absorption edges in the visible light range, one is at about 610 nm and the other one is at about 850 nm, which are similar to the previously reported results.19,42,43 As shown in Fig. 8, BFO contains nonequivalent edge-sharing [FeO6]9− octahedron chains and corner-sharing [FeO4]5− tetrahedron pairs. According to the crystal field theory (CFT), the 3d orbitals of both Feo3+ and Fet3+ will split into a threefold degenerate t2g orbital and a double degenerate eg orbital due to the static electric field produced by their surrounding O ligands. The energy of t2g orbital is lower than that of eg orbital in the octahedral symmetry but will get inverted in the tetrahedral symmetry, as shown in Fig. S9.†44 Besides, all the 3d electrons of Feo3+ or Fet3+ should occupy the 3d orbitals singly on account of the weak-field of O2− ligand, which means high spin state and strong electronic correlations on Fe site. It is also well accepted that UV-Vis absorption of an oxide semiconductor is primarily ordinated from the superposition of transitions involving ligand field transition (intra-atomic transition), charge transfer transition (interatomic transition), and interband transition. Based on the ab initio calculation, a narrow middle band consist of Fe t2g (O)/Fe eg (T) orbitals and a conduction band composed of Fe eg (O)/Fe t2g (T) orbitals were proposed by former workers.19 Thus the second absorption edge was ascribed to the d–d transition between the narrow middle band Fe t2g (O)/Fe eg (T) and the conduction band Fe eg (O)/Fe t2g (T). However, the origin of the second absorption edge is quite controversial because d–d transition belongs to an intra-atomic transition rather than an inter-band transition. Moreover, Pchelkina et al. derived an asymmetric DOS in BFO and a single bandgap varies from 0.97 eV to 1.28 eV based on their ab initio investigation Moreover, the up-spin and down-spin branches in their calculated DOS should be asymmetric rather than symmetric owing to the high spin state of Fe3+. Pchelkina et al. not only derived an asymmetric DOS in BFO but also a single bandgap varies from 0.97 eV to 1.28 eV based on their first principle calculation.20 Besides, a calculated middle band composed of Fe t2g (O)/Fe eg (T) was also obtained in KBiFe2O5 semiconductor which had only one absorption edge indicating the extra absorption edge was not caused by the calculated narrow middle band.44 In principle, the d–d transition here is both spin and Laporte forbidden according to the spectroscopic selection rules. The molar absorption coefficient of the ligand field transition in Fe3+ with high spin state is about three orders of magnitude lower than that of charge transfer transition.45 Although crystal field distortion and hybridization of Fe 3d and O 2p orbitals could relax the spin and Laporte forbidden transition to some extent.46 The probability of ligand field transition is still extremely limited. As a result, the extra strong absorption edge at 850 nm should not result from d–d transition as reported. It has been investigated that Fe3O4 crystals show intensive absorption throughout the whole UV-Vis range owing to the intervalence charge transfer (IVCT) between randomly arranged Fe2+ and Fe3+.47 In BFO crystals, the octahedral [FeO6]9− chain are connected by isolated tetrahedral [FeO4]5− pairs with all Bi3+ occupying equivalent sites. The uneven distributed negative charges tend to induce variation in valence state of Fe3+ and a certain amount of Fe2+ in BFO crystals is demonstrated via XPS, as presented in Fig. 9. The 2p3/2 binding energies of the Fe2+ and Fe3+ were reported at 709.5 eV and 710.9 eV, respectively.48 However, the Fe 2p3/2 binding energy in the obtained XPS spectrum located at ∼710.1 eV indicating the coexistence of Fe2+ and Fe3+, which coincide with a previous study on BFO.49 The ratio of Fe2+![[thin space (1/6-em)]](https://www.rsc.org/images/entities/char_2009.gif) :
:![[thin space (1/6-em)]](https://www.rsc.org/images/entities/char_2009.gif) Fe3+ is estimated to be 39
Fe3+ is estimated to be 39![[thin space (1/6-em)]](https://www.rsc.org/images/entities/char_2009.gif) :
:![[thin space (1/6-em)]](https://www.rsc.org/images/entities/char_2009.gif) 61 using the Lorentzian fitting method. Therefore, similar to Fe3O4, IVCT without restriction of selection rule is also likely to happen in BFO crystals and brings about intense interatomic absorption. However, different from IVCT in Fe3O4, IVCT in BFO is localized due to the isolated [FeO4]5− pair and thus results in a charge-transfer insulator.50
61 using the Lorentzian fitting method. Therefore, similar to Fe3O4, IVCT without restriction of selection rule is also likely to happen in BFO crystals and brings about intense interatomic absorption. However, different from IVCT in Fe3O4, IVCT in BFO is localized due to the isolated [FeO4]5− pair and thus results in a charge-transfer insulator.50
In addition, it is important to note that BFO crystals not only have very broad absorption in the UV-Vis light range, but also possess remarkable absorption to NIR light compared with other reported semiconductors including the hottest perovskite sensitizer CH3NH3PbI3.4,5,44 The significant NIR absorption is attributed to oxygen vacancies produced by the existence of Fe2+ which is similar with W18O49 and Bi2WO6 nanosheets.5,51 This result is of significance in fully utilizing the solar energy and exploring potential applications in NIR related fields. In addition, the existence of oxygen vacancies also indicate that Bi2Fe4O9 is an n-type oxide semiconductor as with other most widely studied oxide semiconductors.
The band gap of BFO cuboids can be determined by the following Tauc's relation using data of UV-Vis-NIR diffuse reflectance spectra:52
| αhν = A(hν − Eg)n/2 | (8) |
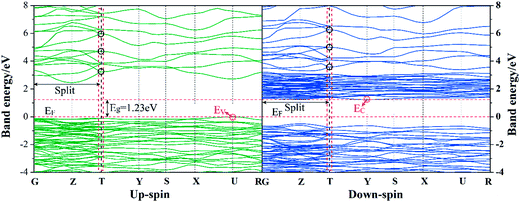 | ||
| Fig. 10 Calculated band structure for BFO crystals along the high-symmetry axes of the Brillouin zone. | ||
The total and partial density of states (DOS) of BFO with up-spin and down-spin components are also calculated to clarify the feature of the interband transition in BFO, as displayed in Fig. 12. The up-spin and down-spin branch are asymmetric owing to the high spin state of Fe3+ which is in good agreement with the other reported results.20 The top of the valence band is mainly dominated by the O 2p states, while the bottom of the conduction band is defined by Fe 3d states. Thus the interband transition is mainly contributed by O 2p to Fe 3d transition.
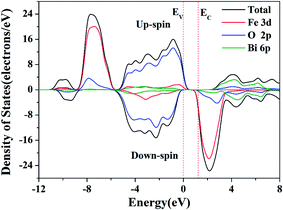 | ||
| Fig. 12 Up-spin (upper branch) and down-spin (lower branch) components of total density of states (DOS) and partial DOS of BFO crystals. | ||
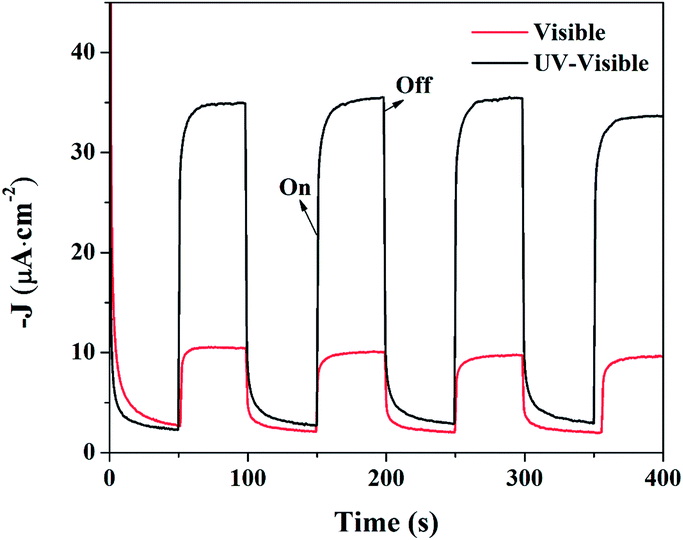
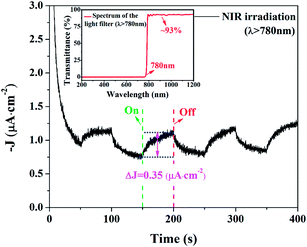
Despite of the narrow band gap and strong absorption in Vis-NIR range, the photoelectrochemical properties of BFO, especially under NIR irradiation, are seldom investigated. The time-dependent photocurrent for BFO cuboids with chopped visible-light and UV-visible-light irradiation are shown in Fig. 13. The photocurrent density is 7 μA cm−2 under visible light while the value nearly quintupled, as large as 33 μA cm−2 when exposed to UV-visible light. The photoelectric responses are find to be much more sensitive and the photocurrents are more stable compared with previously reported results implying a more efficient charge transfer in DB-BFO film electrode which was probably brought about by the orientation of BFO cuboids.12 Small but distinct photoelectric response of BFO cuboids under chopped NIR irradiation (λ > 780 nm) is measured and the photocurrent is around 0.35 μA cm−2, as shown in Fig. 14. It has been investigated in Fig. 7 that the NIR absorption in BFO is much lower than visible light absorption and electrolyte solution between the BFO photoanode and the solar light simulator can also absorb a big part of NIR irradiation while UV-Vis light is barely weakened, which both lead to a small photocurrent.53 Despite of the low photocurrent, the PEC measurement of BFO under NIR irradiation intuitively proved its ability to utilizing NIR irradiation. In theory, sufficient over-potentials of both the valence band edge (VBE) and the conduction band edge (CBE) versus EO2/H2O = +1.229 V (vs. SHE, 298 K) and EH+/H2 = 0 V (vs. SHE, 298 K) are essential for an ideal semiconductor used in a photoelectrochemical cell.45,54 The optical band gap of BFO (1.29 eV) is very close to the potential difference between EO2/H2O and EH+/H2 implying insufficient over-potentials in single-phase BFO. Therefore, the photoelectrochemical performance of BFO cuboid was not as good as the well-studied BiVO4 (Eg = 2.4 eV).55 Accounting for its low bandgap and the UV-Vis-NIR all band absorption feature, photoanodes based on BFO should have potential applications in water photocatalytic splitting and toxic organic pollutants degradation. More importantly, the evident NIR absorption of BFO crystal can encourage people to study its applications in other NIR light related fields.
Conclusion
In summary, single-phase mono-dispersed BFO cuboids have been synthesized successfully using a cost-effective and practical low temperature hydrothermal method in concentrated NaOH solution. The formation of the BFO crystal is based on the reaction between Bi25FeO40 crystal and amorphous Fe(OH)3 and the cuboid shape is resulted from the “blocking effect” of concentrated OH−. The BFO cuboid is preferentially grown along [001] direction and its dominating facets are (001), (110) and (![[1 with combining macron]](https://www.rsc.org/images/entities/char_0031_0304.gif) 10). The cuboid-shaped BFO crystals is an n-type oxide semiconductor that not only exhibit broad and intensive absorption in all UV-Vis light range but also show very strong NIR absorption suggesting an ability to make use of a broader range of the solar light spectrum including a considerable part of the NIR irradiation and potential applications in fields related to NIR light. Therefore, steady and distinct photocurrents that have rapid response to irradiation are measured to be 0.35 μA cm−2, 7 μA cm−2 and 33 μA cm−2 under chopped NIR irradiation, visible light and UV-Vis light, respectively. First principle calculation reveals that BFO is an indirect semiconductor with a band gap of 1.23 eV which is comparable with the experimental value 1.29 eV. In addition, the origin of the extra absorption peak at around 700 nm in the UV-Vis-NIR spectrum should be attributed to the IVCT induced by an unevenly distribution of [FeO6]9− octahedrons and [FeO4]5− tetrahedrons rather than the d–d transition.
10). The cuboid-shaped BFO crystals is an n-type oxide semiconductor that not only exhibit broad and intensive absorption in all UV-Vis light range but also show very strong NIR absorption suggesting an ability to make use of a broader range of the solar light spectrum including a considerable part of the NIR irradiation and potential applications in fields related to NIR light. Therefore, steady and distinct photocurrents that have rapid response to irradiation are measured to be 0.35 μA cm−2, 7 μA cm−2 and 33 μA cm−2 under chopped NIR irradiation, visible light and UV-Vis light, respectively. First principle calculation reveals that BFO is an indirect semiconductor with a band gap of 1.23 eV which is comparable with the experimental value 1.29 eV. In addition, the origin of the extra absorption peak at around 700 nm in the UV-Vis-NIR spectrum should be attributed to the IVCT induced by an unevenly distribution of [FeO6]9− octahedrons and [FeO4]5− tetrahedrons rather than the d–d transition.
Acknowledgements
This work is supported by the Natural Science Foundation of China (no. 11074165 and no. 11304198). Instrumental Analysis Center of Shanghai Jiao Tong University and National Engineering Research Center for Nanotechnology were sincerely acknowledged for assisting relevant analyses.References
- S. U. Khan, M. Al-Shahry and W. B. Ingler, Science, 2002, 297, 2243 CrossRef CAS PubMed.
- D. Chen and J. Ye, Adv. Funct. Mater., 2008, 18, 1922 CrossRef CAS.
- F. Lu, W. Cai and Y. Zhang, Adv. Funct. Mater., 2008, 18, 1047 CrossRef CAS.
- G. Xing, N. Mathews, S. Sun, S. S. Lim, Y. M. Lam, M. Grätzel, S. Mhaisalkar and T. C. Sum, Science, 2013, 342, 344 CrossRef CAS PubMed.
- J. Tian, Y. Sang, G. Yu, H. Jiang, X. Mu and H. Liu, Adv. Mater., 2013, 25, 5075 CrossRef CAS PubMed.
- F. Gao, X. Chen, K. Yin, S. Dong, Z. Ren, F. Yuan, T. Yu, Z. Zou and J. M. Liu, Adv. Mater., 2007, 19, 2889 CrossRef CAS.
- G. Catalan and J. F. Scott, Adv. Mater., 2009, 21, 2463 CrossRef CAS.
- T. Choi, S. Lee, Y. Choi, V. Kiryukhin and S.-W. Cheong, Science, 2009, 324, 63 CrossRef CAS PubMed.
- Q. J. Ruan and W. D. Zhang, J. Phys. Chem. C, 2009, 113, 4168 CAS.
- A. Poghossian, H. Abovian, P. Avakian, S. Mkrtchian and V. Haroutunian, Sens. Actuators, B, 1991, 4, 545 CrossRef.
- N. Zakharchenko, Kinet. Catal., 2002, 43, 95 CrossRef CAS.
- Y. Li, Y. Zhang, W. Ye, J. Yu, C. Lu and L. Xia, New J. Chem., 2012, 36, 1297 RSC.
- H. Koizumi, N. Niizeki and T. Ikeda, Jpn. J. Appl. Phys., 1964, 3, 495 CrossRef CAS.
- Z. Yang, Y. Huang, B. Dong, H. L. Li and S. Q. Shi, J. Solid State Chem., 2006, 179, 3324 CrossRef CAS PubMed.
- T.-J. Park, G. C. Papaefthymiou, A. R. Moodenbaugh, Y. Mao and S. S. Wong, J. Mater. Chem., 2005, 15, 2099 RSC.
- J. T. Han, Y. H. Huang, R. J. Jia, G. C. Shan, R. Q. Guo and W. Huang, J. Cryst. Growth, 2006, 294, 469 CrossRef CAS PubMed.
- A. Maitre, M. Francois and J. Gachon, J. Phase Equilib. Diffus., 2004, 25, 59 CrossRef CAS PubMed.
- X. Zhang, L. Bourgeois, J. Yao, H. Wang and P. A. Webley, Small, 2007, 3, 1523 CrossRef CAS PubMed.
- S. Sun, W. Wang, L. Zhang and M. Shang, J. Phys. Chem. C, 2009, 113, 12826 CAS.
- Z. Pchelkina and S. Streltsov, Phys. Rev. B: Condens. Matter Mater. Phys., 2013, 88, 054424 CrossRef.
- F. Wooten, Optical properties of solids, Academic Press, New York, 1972, vol. 111 Search PubMed.
- V. Dolocan and F. Iova, Phys. Status Solidi A, 1981, 64, 755 CrossRef CAS.
- C. Wang and B. Klein, Phys. Rev. B: Condens. Matter Mater. Phys., 1981, 24, 3393 CrossRef CAS.
- J. Neaton, C. Ederer, U. Waghmare, N. Spaldin and K. Rabe, Phys. Rev. B: Condens. Matter Mater. Phys., 2005, 71, 014113 CrossRef.
- J. P. Perdew, K. Burke and M. Ernzerhof, Phys. Rev. Lett., 1996, 77, 3865 CrossRef CAS.
- P. E. Blöchl, Phys. Rev. B: Condens. Matter Mater. Phys., 1994, 50, 17953 CrossRef.
- N. Shamir, E. Gurewitz and H. Shaked, Acta Crystallogr., Sect. A: Found. Crystallogr., 1978, 34, 662 CrossRef.
- V. I. Anisimov, F. Aryasetiawan and A. Lichtenstein, J. Phys.: Condens. Matter, 1997, 9, 767 CrossRef CAS.
- H. J. Monkhorst and J. D. Pack, Phys. Rev. B: Solid State, 1976, 13, 5188 CrossRef.
- S. Radaev, L. Muradyan and V. Simonov, Acta Crystallogr., Sect. B: Struct. Sci., 1991, 47, 1 CrossRef.
- P. Patnaik, Dean's analytical chemistry handbook, McGraw-Hill, New York, 2004, vol. 1143 Search PubMed.
- C. Chen, J. Cheng, S. Yu, L. Che and Z. Meng, J. Cryst. Growth, 2006, 291, 135 CrossRef CAS PubMed.
- S. H. Han, K. S. Kim, H. G. Kim, H. G. Lee, H. W. Kang, J. S. Kim and C. I. Cheon, Ceram. Int., 2010, 36, 1365 CrossRef CAS PubMed.
- N. Niizeki and M. Wachi, Z. Kristallogr. - New Cryst. Struct., 1968, 127, 173 CrossRef CAS PubMed.
- J. Zhang, Z. Lin, Y. Lan, G. Ren, D. Chen, F. Huang and M. Hong, JACS, 2006, 128, 12981 CrossRef CAS PubMed.
- Y. Chang and H. C. Zeng, Cryst. Growth Des., 2004, 4, 273 CAS.
- X. Xue, L. Wang, L. Huang, D. Zhao and W. Qin, CrystEngComm, 2013, 15, 2897 RSC.
- M. Hojamberdiev, Y. Xu, F. Wang, J. Wang, W. Liu and M. Wang, Ceram.-Silik., 2009, 53, 113 CAS.
- L. Ren, L. Jin, J. B. Wang, F. Yang, M. Q. Qiu and Y. Yu, Nanotechnology, 2009, 20, 115603 CrossRef PubMed.
- L. W. Zhang, Y. J. Wang, H. Y. Cheng, W. Q. Yao and Y. F. Zhu, Adv. Mater., 2009, 21, 1286 CrossRef CAS.
- S. Mitra, S. Das, K. Mandal and S. Chaudhuri, Nanotechnology, 2007, 18, 275608 CrossRef.
- Y. Liu and R. Zuo, Particuology, 2012, 11, 581 CrossRef PubMed.
- Q. Zhang, W. Gong, J. Wang, X. Ning, Z. Wang, X. Zhao, W. Ren and Z. Zhang, J. Phys. Chem. C, 2011, 115, 25241 CAS.
- G. Zhang, H. Wu, G. Li, Q. Huang, C. Yang, F. Huang, F. Liao and J. Lin, Sci. Rep., 2013, 3, 1265 Search PubMed.
- F. A. Cotton, G. Wilkinson, C. A. Murillo and M. Bochmann, Advanced inorganic chemistry, Wiley, New York, 1988, vol. 5 Search PubMed.
- Y. He, Y. Miao, C. Li, S. Wang, L. Cao, S. Xie, G. Yang, B. Zou and C. Burda, Phys. Rev. B: Condens. Matter Mater. Phys., 2005, 71, 125411 CrossRef.
- W. Fontijn, P. Van der Zaag, L. Feiner, R. Metselaar and M. Devillers, J. Appl. Phys., 1999, 85, 5100 CrossRef CAS PubMed.
- T. Schedel-Niedrig, W. Weiss and R. Schlögl, Phys. Rev. B: Condens. Matter Mater. Phys., 1995, 52, 17449 CrossRef CAS.
- Z. Tian, Y. Qiu, S. Yuan, M. Wu, S. Huo and H. Duan, J. Appl. Phys., 2010, 108, 064110 CrossRef PubMed.
- J. Zaanen, G. Sawatzky and J. Allen, Phys. Rev. Lett., 1985, 55, 418 CrossRef CAS.
- G. Leftheriotis, S. Papaefthimiou, P. Yianoulis and A. Siokou, Thin Solid Films, 2001, 384, 298 CrossRef CAS.
- P. Kubelka and F. Munk, Z. Tech. Phys., 1931, 12, 593 Search PubMed.
- B. Wozniak and J. Dera, Light absorption in sea water, Springer, NewYork, 2007, vol. 33 Search PubMed.
- K. J. McDonald and K. S. Choi, Chem. Mater., 2011, 23, 4863 CrossRef CAS.
- S. P. Berglund, D. W. Flaherty, N. T. Hahn, A. J. Bard and C. B. Mullins, J. Phys. Chem. C, 2011, 115, 3794 CAS.
Footnote |
| † Electronic supplementary information (ESI) available. See DOI: 10.1039/c4ra01727g |
| This journal is © The Royal Society of Chemistry 2014 |

