Li-ion and Na-ion insertion into size-controlled nickel hexacyanoferrate nanoparticles†
Carissa H. Lia,
Yūsuke Nanbab,
Daisuke Asakurab,
Masashi Okubo*c and
Daniel R. Talham*a
aDepartment of Chemistry, University of Florida, Gainesville, FL 32611-7200, USA. E-mail: talham@chem.ufl.edu; Fax: +1-352-392-3255; Tel: +1-352-392-9016
bNational Institute of Advanced Industrial Science and Technology (AIST), Umezono 1-1-1, Tsukuba, Ibaraki 305-8568, Japan
cDepartment of Chemical System Engineering, School of Engineering, The University of Tokyo, Hongo 7-3-1, Bunkyo-ku, Tokyo, 113-8656, Japan. E-mail: m-okubo@chemsys.t.u-tokyo.ac.jp
First published on 23rd May 2014
Abstract
The influence of particle size on the electrochemical properties of guest-ion storage materials has attracted much attention because of the extensive need for long cycle-life, high energy density, and high power batteries. The present work describes a systematic study of the effect of particle size on the guest-ion storage capabilities of a cyanide-bridged coordination polymer. A series of nickel hexacyanoferrate particles ranging from approximately 40 to 400 nm were synthesized by a co-precipitation method and were used as the cathode material for both Li-ion and Na-ion insertion/extraction experiments using organic electrolyte. A large polarization was observed for the largest particles during Li-ion cycling, indicating a heterogeneous ion concentration within the lattice. As a consequence, the available capacity of Li-ion intercalation at high rates is significantly improved by reducing the particle size. On the other hand, Na-ion intercalation shows excellent rate capability regardless of the particle size.
Introduction
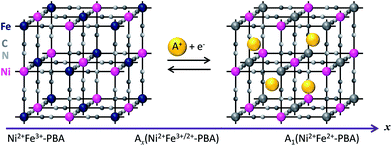
The demand for electrochemical energy storage in the form of reusable batteries continues to increase in parallel with the ever-growing rise in portable electronics and the desire to shift overall energy consumption to renewable sources.1–4 Enhancements in electrode materials to provide safe, lower cost, higher power, higher energy density, and longer cycle life will be extremely valuable. Currently used cathode materials for Li-ion batteries include LiCoO2 or LiFePO4, which possess redox-active metals and porous/layer spaces to allow guest ions to be reversibly intercalated and de-intercalated.5 Members of the family of coordination polymers called Prussian blue analogues (PBAs) have been recently demonstrated as potential electrode materials for alkali ion batteries exploiting their stable redox properties and large and uniform porosity.6–11 The PBA formula is generally written as AjMk[M′(CN)6]l·γm·nH2O (hereafter represented as MM′-PBA), in which A denotes a counter cation, M and M′ denote transition metal ions, and γ denotes [M′(CN)6]3− vacancies. The open framework structure allows for fast and reversible guest ion intercalation (Scheme 1). Prussian blue analogue frameworks have been proposed as battery cathodes for grid-scale energy storage using aqueous electrolytes.6 For example, a CuFe–PBA cathode was shown to retain 83% of its original capacity following 40![[thin space (1/6-em)]](https://www.rsc.org/images/entities/char_2009.gif) 000 charge–discharge cycles in aqueous K+-containing electrolytes at a high operating rate.6 For the case of Li-ion batteries with organic electrolytes, many analogues, including the MnFe–PBA7 and NiFe–PBA,12 show a discharge capacity of ca. ∼60 mA h g−1 with strong cycle stability. Recently, by combining the higher capacity component, CuFe–PBA, with a robust NiFe–PBA in core@shell geometry, a relatively high Li-ion storage capacity of 119 mA h g−1 was achieved, retaining 65% of its initial capacity after 50 charge–discharge cycles.13 These advances show the potential of applying cyanide-bridged coordination polymer-based electrodes in future technologies.
000 charge–discharge cycles in aqueous K+-containing electrolytes at a high operating rate.6 For the case of Li-ion batteries with organic electrolytes, many analogues, including the MnFe–PBA7 and NiFe–PBA,12 show a discharge capacity of ca. ∼60 mA h g−1 with strong cycle stability. Recently, by combining the higher capacity component, CuFe–PBA, with a robust NiFe–PBA in core@shell geometry, a relatively high Li-ion storage capacity of 119 mA h g−1 was achieved, retaining 65% of its initial capacity after 50 charge–discharge cycles.13 These advances show the potential of applying cyanide-bridged coordination polymer-based electrodes in future technologies.
Diffusion length and surface area become important parameters for any process involving ion diffusion. Nanotechnology has offered the opportunity for detailed analysis of the thermodynamics and kinetics of chemical and physical processes at small particles and at interfaces,2,14,15 as nanoscale effects of grain size or particle size play a crucial role in the performance of electrode materials.16 In fact, nanosized materials have shown improved storage capabilities, as they can possess different ion solubility and altered interfacial strain associated with changes in redox states.14,17,18 For example, it has been reported by Wagemaker et al.18 that anatase TiO2 particles of reduced size cannot accommodate domain boundaries between Li-ion rich and Li-ion poor phases leading to more homogeneous charging.
Nanoscale effects in coordination polymers are less extensively documented, so the present report presents a systematic study of the effect of particle size on Na-ion and Li-ion storage capabilities of a Prussian blue analogue in organic electrolytes. Among a wide variety of different analogues, the NiFe–PBA was chosen for study due to its redox stability, relatively long cycle life, and the easy synthesis of uniform particles for size-controlled studies. Somewhat surprisingly, the results show that for Na-ion intercalation, neither the discharge capacity nor rate of discharge is greatly influenced by particle sizes up to 400 nm. For Li-ions, which possess a larger Stokes radius, ion diffusion limits performance at high cycle rates and large particle sizes.
Experimental section
All reagents were purchased from Sigma-Aldrich, Fisher Scientific, or Acros Organics and used without further purification. Deionized water used in synthetic procedures was obtained from a Barnstead NANOpure purification system. The filters used during the syntheses were Fast PES Bottle Top Filters with 0.2 μm or 0.45 μm pore size (Nalgene).NiFe–PBA particles (38 nm, 140 nm, 176 nm, 295 nm)
The syntheses of the NiFe–PBA particles of various sizes were performed at room temperature. An aqueous solution of NiCl2·6H2O and an equal volume of an aqueous solution containing K3Fe(CN)6 were simultaneously added dropwise to 200 mL of deionized water. The concentrations and volumes of the precursor solutions and the addition rate used to achieve each particle size are listed in Table 1. The mixture was vigorously stirred for 18 h after complete addition. The particles were subsequently filtered under vacuum before being washed with deionized water. To isolate the particles, they were redispersed in 100 mL deionized water, centrifuged, and dried at room temperature. Compositions and analyses are reported in Table 2.| Size (nm) | 38 | 140 | 176 | 295 |
|---|---|---|---|---|
| NiCl2·6H2O (mmol/mM−1) | 2/20 | 8/80 | 1.2/4 | 0.8/8 |
| K3Fe(CN)6 (mmol/mM−1) | 1.84/18.4 | 7.35/73.5 | 1.1/3.67 | 0.74/7.4 |
| Volume (mL) | 100 | 100 | 300 | 100 |
| Speed (mL h−1) | 600 | 10 | 150 | 10 |
| Size (nm) | Molecular formula | Elemental analysisa,b | EDS | Theoretical capacity (mA h g−1) | ||||
|---|---|---|---|---|---|---|---|---|
| C | H | N | Ni | Fe | ||||
| a Note that the elemental analysis of the C, H, and N elements shows absolute atomic percentages, whereas the EDS of Ni and Fe elements shown in the table are the atomic percentages relative to each other.b Theoretical capacity was calculated assuming all the iron ions present in the lattice are Fe3+. | ||||||||
| 38 ± 4 | K0.5Ni[Fe(CN)6]0.825·6.5H2O | Calc. | 16.06 | 3.55 | 18.73 | 59.7 | ||
| Exp. | 16.23 | 3.03 | 18.46 | 54.68 | 45.32 | |||
| 140 ± 13 | K0.325Ni[Fe(CN)6]0.775·4.5H2O | Calc. | 17.63 | 2.87 | 20.57 | 65.6 | ||
| Exp. | 17.57 | 2.49 | 19.99 | 56.29 | 43.71 | |||
| 176 ± 18 | K0.425Ni[Fe(CN)6]0.8·6H2O | Calc. | 16.33 | 3.43 | 19.05 | 60.7 | ||
| Exp. | 16.58 | 3.27 | 18.80 | 55.27 | 44.73 | |||
| 295 ± 33 | K0.25Ni[Fe(CN)6]0.75·5H2O | Calc. | 17.02 | 3.18 | 19.85 | 63.3 | ||
| Exp. | 17.10 | 2.84 | 19.26 | 57.31 | 42.69 | |||
| 387 ± 36 | K0.25Ni[Fe(CN)6]0.75·5H2O | Calc. | 17.02 | 3.18 | 19.85 | 63.3 | ||
| Exp. | 17.50 | 2.82 | 19.42 | 57.27 | 42.73 | |||
NiFe–PBA particles (387 nm)
A seed–shell synthetic procedure was applied for making particles greater than 300 nm in size.19,20 The synthesis of NiFe–PBA core particles was performed first at room temperature. A 100 mL aqueous solution of NiCl2·6H2O (0.190 g, 0.80 mmol) and an equal volume of an aqueous solution containing K3Fe(CN)6 (0.242 g, 0.74 mmol) were simultaneously added dropwise to 200 mL of deionized water. The solution was vigorously stirred for 18 h after complete addition. The particles were subsequently filtered under vacuum before being washed with deionized water. To achieve larger sizes, the particles were redispersed by stirring in 50 mL of deionized water then diluted to 400 mL and used as the growing seeds. A 200 mL aqueous solution of NiCl2·6H2O (0.095 g, 0.40 mmol) and an equal volume of an aqueous solution of K3Fe(CN)6 (0.121 g, 0.37 mmol) were added using a peristaltic pump at a rate of 10 mL h−1. Once the addition was complete, the particles were filtered and washed with deionized water before being redispersed in 50 mL of deionized water. The same seed–shell synthesis procedure was repeated for one more cycle to yield an average particle size of ∼400 nm. For isolation of the particles, they were centrifuged and dried at room temperature. Composition and analysis is reported in Table 2.Instrumentation
Infrared spectra were recorded on a Nicolet 6700 Thermo Scientific spectrophotometer. Typically 16 scans were taken between 2300 and 1900 cm−1 with a precision of 0.482 cm−1. Powder samples were mixed with KBr and pressed into a pellet using 3000 psi. A scan of pure KBr was taken as a background reference. Combustion analysis to determine carbon, hydrogen, and nitrogen (CHN) percentages was performed by the University of Florida Spectroscopic Services Laboratory. Transmission electron microscopy (TEM) was performed on a JEOL-2010F HRTEM at 200 kV. The TEM grids (ultrathin carbon film on holey carbon support film, 400 mesh, copper from Ted-Pella, Inc) were prepared by dropping onto the grid 40 μL of a solution containing 5 mg of sample dispersed by sonication in 1 mL of water for 30 minutes. Energy dispersive X-ray spectroscopy (EDS) was performed with an Oxford Instruments EDS X-ray Microanalysis System coupled to the HRTEM microscope. A total of three scans were performed on different parts of the sample and then averaged to give relative atomic percentages for potassium, iron, and nickel. The chemical formulas were based on metal compositions from EDS, adding counter cation (potassium) as determined by the number of cyanoferrate vacancies to ensure electroneutrality. The surface morphology and particle uniformity were analyzed using an FEI XL-40 Field Emission Gun Scanning Electron Microscope (FEG-SEM). Powder X-ray diffraction (XRD) measurements were performed on a X'Pert powder diffractometer using Cu Kα radiation in steps of 0.008° over the 2θ range of 5–70°. Typically ∼10 mg of particles were mounted with double-sided tape on a glass slide.Electrochemical experiments
Each sample (50 mg) was ground with acetylene black (13.3 mg) and polytetrafluoroethylene (PTFE, 3.3 mg) into a paste and used as working electrode. The mass loading is ca. 1 mg cm−2. For Li-ion insertion/extraction, the three-electrode electrochemical cell with the reference and counter electrodes of lithium metal was used. As the Li-ion electrolyte, a 1 M LiClO4/ethylene carbonate (EC)–diethyl carbonate (DEC) solution (1/1 v/v%) was used. For Na-ion insertion/extraction, Na-metal was used as the counter and reference electrodes, and a 1 M NaClO4/propylene carbonate (PC) solution was used as the Na-ion electrolyte. The charge–discharge experiments were performed with an HOKUTO HJSD8. The cut-off voltages were 2.5 V (vs. Li/Li+) for Li-ion insertion, 4.3 V (vs. Li/Li+) for Li-ion extraction, 2.2 V (vs. Na/Na+) for Na-ion insertion and 4.0 V (vs. Na/Na+) for Na-ion extraction. All capacities are expressed per gram of NiFe–PBA coordination polymer.Results
Particle synthesis
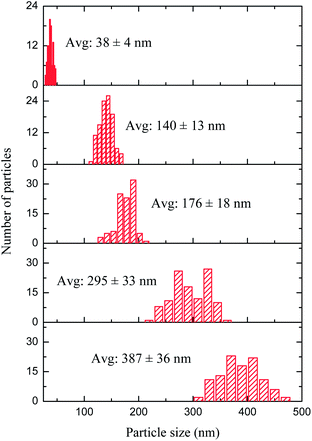
Five different samples of NiFe–PBA with mean particle sizes ranging from 38 to 387 nm were synthesized using a co-precipitation method, varying the concentration of the precursors and their addition rate. The particle size increases as the concentration of the precursors decreases under the same addition rate, whereas speeding up the reaction results in smaller particles. Particles greater than 300 nm were obtained with a seed–shell approach. Previously synthesized NiFe–PBA particles of approximately 260 nm were suspended in water and used as seeds for the growth of particles of larger size upon further slow addition of the two precursors. Table 1 summarizes the conditions used to synthesize the NiFe–PBA particles of various sizes.The gradual increase in the size of the NiFe–PBA particles was confirmed by TEM images, as shown in Fig. 1. The particle sizes and dispersions determined from an analysis of TEM images are shown in Fig. 2, giving average size of 38 nm, 140 nm, 176 nm, 295 nm, and 387 nm. An SEM image of the particles of each of the five sizes appears in Fig. 3, exhibiting the surface morphology and the uniformity of the samples. Clearly, particles uniform in shape and size were formed during each of the five syntheses. Similar chemical analyses and Ni![[thin space (1/6-em)]](https://www.rsc.org/images/entities/char_2009.gif) :
:![[thin space (1/6-em)]](https://www.rsc.org/images/entities/char_2009.gif) Fe ratios for each sample give consistent molecular formulas and thus theoretical discharge capacities (Table 2). The room temperature powder X-ray diffraction pattern of the 140 nm particles, Fig. S1,† confirms the known cubic structure and Fm
Fe ratios for each sample give consistent molecular formulas and thus theoretical discharge capacities (Table 2). The room temperature powder X-ray diffraction pattern of the 140 nm particles, Fig. S1,† confirms the known cubic structure and Fm![[3 with combining macron]](https://www.rsc.org/images/entities/char_0033_0304.gif) m space group with unit cell parameter, a = 10.23 Å.21
m space group with unit cell parameter, a = 10.23 Å.21
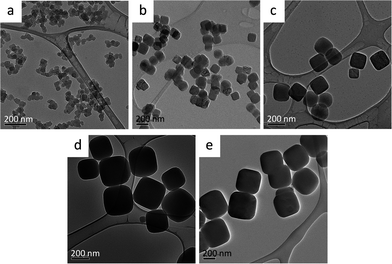 | ||
| Fig. 1 HRTEM images of the NiFe–PBA particle samples of five different sizes. (a) 38 ± 4 nm; (b) 140 ± 13 nm; (c) 176 ± 18 nm; (d) 295 ± 33 nm; (e) 387 ± 36 nm. The size designations are based on the size analysis of Fig. 2. | ||
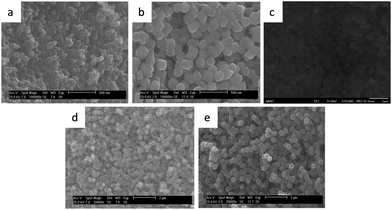 | ||
| Fig. 3 SEM images of the NiFe–PBA particle samples of five different sizes, corresponding to Fig. 1 and 2, (a) 38 ± 4 nm; (b) 140 ± 13 nm; (c) 176 ± 18 nm; (d) 295 ± 33 nm; (e) 387 ± 36 nm. The scale bars are 500 nm for (a) and (b), 1 μm for (c), and 2 μm for (d) and (e). | ||
Behavior at low cycling rates
To investigate the electrochemical properties and the guest ion storage capabilities of the PBA particles, electrochemical Li-ion and Na-ion insertion/extraction experiments were performed on the NiFe–PBA particles of various sizes. The Li-ion extraction (charge) and insertion (discharge) curves for the first electrochemical cycle are compared in Fig. 4a for a specific current of 30 mA g−1 (0.5 C). A reversible specific capacity of ca. 60 mA h g−1 is obtained for particles greater than 176 nm, which agrees with the calculated theoretical capacities associated with the Fe2+/3+ redox couple, corresponding to the insertion of ∼0.8 Li+ per formula unit of KjNi[Fe(CN)6]k·nH2O (Table 2). Relative to the smaller particles, the charge–discharge curve for the 387 nm particle displays a large potential separation of 200 mV between the charge and discharge plateaus. This large polarization may be ascribed to a concentration gradient of Li-ions within the NiFe–PBA lattice.8 That is, the 30 mA g−1 cycling rate (Li-ion insertion/extraction rate of 0.3 mol s−1 g−1) is too fast for the 387 nm particles to retain a uniform Li-ion concentration throughout the particle. For each of the smaller particles, the mean redox potential is 3.3 V vs. Li/Li+ (0.3 V vs. NHE).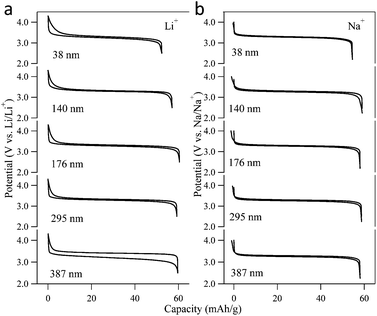 | ||
| Fig. 4 First cycle Li-ion and Na-ion charge–discharge curves of NiFe–PBA at a specific current of 30 mA g−1 for the five different particle sizes. | ||
Fig. 4b compares the Na-ion charge and discharge curves of the NiFe–PBA particles of various sizes for the first electrochemical cycle under a specific current of 30 mA g−1, again yielding a reversible specific capacity of ca. 60 mA h g−1. Taking advantage of the faster diffusion of the Na-ions,22 a uniform Na-ion concentration is established throughout the particles within the experimental timescale. No considerable polarization was observed in the Na-ion charge–discharge curves for any of the five different sizes. The potential of the Fe2+/3+ redox couple for Na-ion insertion is higher than that for Li-ion by 0.3 V, at 3.3 V vs. Na/Na+ (0.6 V vs. NHE).
Response as a function of cycling rate
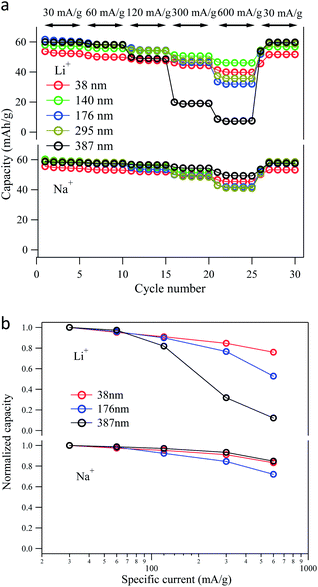
To investigate the rate capability of the NiFe–PBA particles, both the Li-ion and Na-ion insertion/extraction experiments were carried out at different specific currents from 30 mA g−1 (0.5 C) to 600 mA g−1 (10 C), as shown in Fig. 5. The high rate Li-ion insertion/extraction for the 387 nm particle exhibits a drastic decrease in the available capacity, down to 6 mA h g−1 with the specific current of 600 mA g−1. Only 10% of its original capacity was retained relative to a cycling rate of 30 mA g−1. The poor rate capability of the 387 nm particle could be ascribed to the large polarization incurred upon redox cycling, likely originating from the steep Li-ion concentration gradient in the NiFe–PBA particles.8 On the other hand, the rate capability of the Li-ion cycling is significantly improved by reducing the particle size. The remaining discharge capacity at 600 mA g−1 was 31 mA h g−1 for the 176 nm particle, increasing to 40 mA h g−1 for the 38 nm particle. This result can be attributed to the short Li-ion diffusion length on the timescales of the faster cycling, so the large surface area and surface-to-volume ratio of the smaller particles enables higher Li-ion intercalation capacity.23–25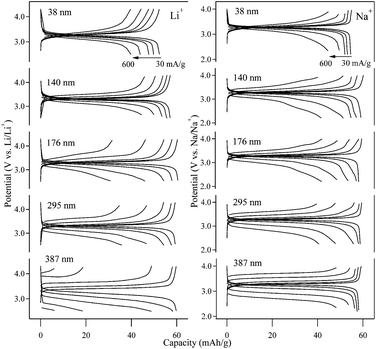 | ||
| Fig. 5 Charge and discharge curves of NiFe–PBA at various rates for Li+ (left) and Na+ (right). The specific current was varied from 30 to 600 mA g−1. | ||
In contrast to Li-ion intercalation, the rate capability of the 387 nm particles upon Na-ion cycling remains relatively high, even for the high charge–discharge speeds. A capacity of 48 mA h g−1, which is 80% of the low-rate capacity, was retained at the highest cycling rate of 600 mA g−1. The excellent rate capability signals fast Na-ion diffusion26 in the NiFe–PBA lattice. At the same time, decreasing the particle size doesn't result in higher Na-ion storage capacity at high cycling rate. The discharge capacity at 600 mA g−1 was 42 mA h g−1 for the 176 nm particle sample and 45 mA h g−1 for the 38 nm particles, indicating that rate of Na-ion diffusion in the NiFe–PBA particles is not the capacity-limiting factor under the applied experimental conditions.
Discussion
Generally, the size and crystallinity of coordination polymer nanoparticles can be controlled by varying the synthetic conditions including the concentration of the precursors and their mixing rate, solvent mixtures, temperature, or the addition of surfactants.27–32 For Prussian blue analogue particles, the number of nucleation sites generally determines particle sizes13,19,20,33 and samples of less than 300 nm were successfully synthesized by varying the precursor's concentrations and the speed of their addition. By taking advantage of the reactivity of the terminal cyanides of the [Fe(CN)6]3− building block at the surface of the particles, difficulty in making particles greater than 300 nm was overcome by using previously synthesized NiFe–PBA particles as seeds for further precipitation.19,20 In general, the syntheses of the NiFe–PBA nanoparticles resulted in well-formed cubic shapes and uniform sizes.At the cycling rate of 30 mA g−1, Na+ intercalation with particles of all five sizes and Li+ intercalation with particles smaller than 295 nm show no polarization in the charge–discharge curves. That is, high energy efficiency with less than 0.05 V difference in the voltage plateaus between the charge and discharge process is achieved. It can be deduced that except for the Li-ion cycling with the 387 nm particles, a uniform concentration profile is achieved for both Li-ion and Na-ion insertion/extraction, indicating that ionic diffusion is not the rate determining step under the applied experimental conditions. Similar to previous alkaline ion battery studies with aqueous electrolytes reported by Wessells et al.,9,34 the NiFe–PBA usually displays a narrow voltage hysteresis in the charge–discharge curve upon Na-ion or K-ion intercalation, due to its open framework structure and the fast diffusion of ions between the solid and solution states as well as within the lattice. In contrast to the Na-ion intercalation, a relatively large voltage hysteresis is observed for the case of Li-ion intercalation with the 387 nm particle sample, which is evidence for a heterogeneous ion concentration upon charging–discharging. This behavior can be explained by the accumulation of the Li-ions closer to the surface and incomplete transport of ions to the interior of the larger particles. Higher kinetic barriers to Li-ion desolvation at the electrolyte–particle interface and transport through the lattice are likely both contributing factors.22,26
It is apparent from the charge–discharge curves that the mean Fe2+/3+ redox potential for Na-ion cycling is higher than that for Li-ion cycling by 0.3 V, which is in agreement with the previous observation of the increase in redox potential for the insertion of heavier alkaline ions.9,35,36 In general, the redox potential, E, is determined by the chemical potential, μA, of the inserted material, as shown in eqn (1):
 | (1) |
Fig. 6 plots the available capacity at different specific currents for the range of NiFe–PBA particles sizes as well as the normalized capacity for three selected sizes. For Na+ intercalation, when the particle size is smaller than 387 nm and the rate of the insertion/extraction is slower than 600 mA g−1, the rate capability is not dominated by ion diffusion. The series resistance in the cell, which includes the resistance of the electrolytes, the interfacial charge transfer resistance and the electronic resistance of the electrode, may all contribute to the IR drop and slightly reduce the available capacity at higher rates.38 For Li-ion insertion/extraction high rates are observed for all five particle sizes, although the available capacity at high cycling rate is highly dependent on the particle size due to the slow kinetics of Li-ion diffusion in the PBA lattice. By decreasing the particle size, the surface area is increased allowing a more uniform concentration profile within the particle and a greater discharge capacity.15 Nevertheless, for both Li+ and Na+ intercalation, excellent cycle stability is observed over the first 30 charge–discharge cycles.
The maximum observed capacity for NiFe–PBA is ca. 60 mA h g−1 for both Li-ion and Na-ion cycling, consistent with the reported theoretical value of the NiFe–PBA and previous observations for other Prussian blue analogues,7,12 corresponding to reduction of all of the accessible Fe3+ centers. However, for the smallest particles, the maximum capacity, taken as the capacity as slow cycle speeds (Fig. 4), is somewhat lower, deviating from trends observed for other alkali ion insertion compounds for which increases in storage capacity and ion solubility are observed for smaller particles.18,23 On the other hand, the reduced capacity of the smallest NiFe–PBA falls in line with other studies whereby the physical response of PBA nanoparticles deviates from the bulk when chemical differences present at the surface begin to become important. Relative to the bulk properties, changes in magnetic response, rates of linkage isomerism, oxidation states and counter ion content have previously been observed for particles in the 30 nm size regime and smaller.39–41 These changes have been attributed to the many more degrees of freedom available to coordination polymer networks to reduce surface energies, including stabilizing different oxidation states and changing metal ion coordination environments. A significant peak at 2102 cm−1 in the infrared spectrum associated with the cyanide stretch of Fe2+–CN–Ni2+ pairs in the NiFe–PBA becomes more prominent with decreasing particle size (Fig. S2†), consistent with chemical changes at the surface. The lower maximum capacity, seen for both Li-ion and Na-ion insertion, is intrinsic to the small particles and is most likely attributable to structural differences at the particle surface and the enhanced surface-to-volume ratio of the smallest particles. However, it should be observed that even though the maximum capacity is reduced for small particles, there are some conditions for which the small particles enhance performance. With fast Li-ion cycling, for which the maximum capacity is not achieved for any particle size, higher capacity is observed for the small particles (Fig. 5 and 6) because the shorter diffusion lengths allow access to a higher percentage of the material.
Conclusions
The study demonstrates the influence of particle size on the alkali ion storage capabilities of a bimetallic cyanide-bridged coordination polymer. A maximum discharge capacity of ca. 60 mA h g−1 is achieved upon both Li+ and Na+ cycling for the larger particles, which slightly reduces for the smallest particles. Na-ion intercalation shows excellent rate capability regardless of the particle size. Under the conditions explored in this study, there appears to be little or no advantage to employing smaller particles for Na-ion storage. In contrast, the rate of Li-ion diffusion begins to limit the capacity at high cycle rates for the larger particles. Under all conditions studied, the NiFe–PBA system remains quite stable over many charge–discharge cycles, further demonstrating its potential utility as a cathode material in electrochemical energy storage schemes.Acknowledgements
This work was financially supported, in part, by the U.S. National Science Foundation through grant DMR-1005581 and DMR-1405439 (D.R.T.). The authors thank the University of Florida Major Analytical Instrumentation Center (MAIC) for access to the electron microscopy and EDS analysis. M.O. was supported by a KAKENHI on Innovative Areas (“Coordination Programming” Area 2107) from MEXT, Japan. M.O. was also supported by the Industrial Technology Research Grant Program in 2010 from the New Energy and Industrial Development Organization (NEDO), Japan.Notes and references
- J.-M. Tarascon and M. Armand, Nature, 2001, 414, 359 CrossRef CAS PubMed.
- Y. Sun, Z. Chen, H. Noh, D. Lee, H. Jung, Y. Ren, S. Wang, C. S. Yoon, S. Myung and K. Amine, Nat. Mater., 2012, 11, 942 CrossRef CAS PubMed.
- B. Dunn, H. Kamath and J.-M. Tarascon, Science, 2011, 334, 928 CrossRef CAS PubMed.
- Z. Yang, J. Zhang, M. Kintner-Meyer, X. Lu, D. Choi, J. P. Lemmon and J. Liu, Chem. Rev., 2011, 111, 3577 CrossRef CAS PubMed.
- B. L. Ellis, K. T. Lee and L. F. Nazar, Chem. Mater., 2010, 22, 691 CrossRef CAS.
- C. D. Wessells, R. A. Huggins and Y. Cui, Nat. Commun., 2011, 2, 550 CrossRef PubMed.
- M. Okubo, D. Asakura, Y. Mizuno, J.-D. Kim, T. Mizokawa, T. Kudo and I. Honma, J. Phys. Chem. Lett., 2010, 1, 2063 CrossRef CAS.
- M. Okubo, D. Asakura, Y. Mizuno, T. Kudo, H. Zhou, A. Okazawa, N. Kojima, K. Ikedo, T. Mizokawa and I. Honma, Angew. Chem., Int. Ed., 2011, 50, 6269 CrossRef CAS PubMed.
- C. D. Wessells, S. V. Peddada, R. A. Huggins and Y. Cui, Nano Lett., 2011, 11, 5421 CrossRef CAS PubMed.
- Y. Lu, L. Wang, J. Cheng and J. B. Goodenough, Chem. Commun., 2012, 48, 6544 RSC.
- L. Wang, Y. Lu, J. Liu, M. Xu, J. Cheng, D. Zhang and J. B. Goodenough, Angew. Chem., Int. Ed., 2013, 52, 1964 CrossRef CAS PubMed.
- Y. Mizuno, M. Okubo, K. Kagesawa, D. Asakura, T. Kudo, H. Zhou, K. Oh-ishi, A. Okazawa and N. Kojima, Inorg. Chem., 2012, 51, 10311 CrossRef CAS PubMed.
- D. Asakura, C. H. Li, Y. Mizuno, M. Okubo, H. Zhou and D. R. Talham, J. Am. Chem. Soc., 2013, 135, 2793 CrossRef CAS PubMed.
- C. A. Barbero, Phys. Chem. Chem. Phys., 2005, 7, 1885 RSC.
- Y. Guo, J. Hu and L. Wan, Adv. Mater., 2008, 20, 2878 CrossRef CAS.
- Y. Wang and G. Cao, Adv. Mater., 2008, 20, 2251 CrossRef CAS.
- M. Okubo, Y. Mizuno, H. Yamada, J. Kim, E. Hosono, H. Zhou, T. Kudo and I. Honma, ACS Nano, 2010, 4, 741 CrossRef CAS PubMed.
- M. Wagemaker, W. J. H. Borghols and F. M. Mulder, J. Am. Chem. Soc., 2007, 129, 4323 CrossRef CAS PubMed.
- M. F. Dumont, E. S. Knowles, A. Guiet, D. M. Pajerowski, A. Gomez, S. W. Kycia, M. W. Meisel and D. R. Talham, Inorg. Chem., 2011, 50, 4295 CrossRef CAS PubMed.
- L. Catala, D. Brinzei, Y. Prado, A. Gloter, O. Stéphan, G. Rogez and T. Mallah, Angew. Chem., Int. Ed., 2009, 48, 183 CrossRef PubMed.
- R. Martínez-Garcia, E. Reguera, J. Balmaseda, G. Ramos and H. Yee-Madeira, Powder Diffr., 2004, 19, 284 CrossRef.
- Y. Mizuno, M. Okubo, E. Hosono, T. Kudo, H. Zhou and K. Oh-ishi, J. Phys. Chem. C, 2013, 117, 10877 CAS.
- M. Wagemaker and F. M. Mulder, Acc. Chem. Res., 2013, 46, 1206 CrossRef CAS PubMed.
- M. Okubo, E. Hosono, J.-D. Kim, M. Enomoto, N. Kojima, T. Kudo, H. Zhou and I. Honma, J. Am. Chem. Soc., 2007, 129, 7444 CrossRef CAS PubMed.
- J. Maier, Nat. Mater., 2005, 4, 805 CrossRef CAS.
- P. G. Bruce, Solid State Electrochemistry, Cambridge University Press, 1997 Search PubMed.
- C. Julien, J. P. Pereira-Ramos and A. Momchilov, New Trends in Intercalation Compounds for Energy Storage, Springer, Netherlands, 2002 Search PubMed.
- B. Zhan, M. A. White, M. Lumsden, J. Mueller-Neuhaus, K. N. Robertson, T. S. Cameron and M. Gharghouri, Chem. Mater., 2002, 14, 3636 CrossRef CAS.
- F. Shiba, R. Fujishiro, T. Kojima and Y. Okawa, J. Phys. Chem. C, 2012, 116, 3394 CAS.
- A. Kumar, S. M. Yusuf and J. V. Yakhmi, Appl. Phys. A: Mater. Sci. Process., 2010, 99, 79 CrossRef CAS PubMed.
- S. Vaucher, J. Fielden, M. Li, E. Dujardin and S. Mann, Nano Lett., 2002, 2, 225 CrossRef CAS.
- J. Larionova, Y. Guari, C. Sangregorio and C. Guerin, New J. Chem., 2009, 33, 1177 RSC.
- D. Brinzei, L. Catala, C. Mathonière, W. Wernsdorfer, A. Gloter, O. Stephan and T. Mallah, J. Am. Chem. Soc., 2007, 129, 3778 CrossRef CAS PubMed.
- C. D. Wessells, S. V. Peddada, M. T. McDowell, R. A. Huggins and Y. Cui, J. Electrochem. Soc., 2012, 159, A98 CrossRef CAS PubMed.
- J. W. McCargar and V. D. Neff, J. Phys. Chem., 1988, 92, 3598 CrossRef CAS.
- A. B. Bocarsly and S. Sinha, J. Electroanal. Chem., 1982, 140, 167 CrossRef CAS.
- K. R. Dunbar and R. A. Heintz, Progress in Inorganic Chemistry, John Wiley & Sons, Inc., 1996, p. 2007 Search PubMed.
- M. Okubo, C. H. Li and D. R. Talham, Chem. Commun., 2014, 50, 1353 RSC.
- D. M. Pajerowski, F. A. Frye, D. R. Talham and M. W. Meisel, New. J. Phys., 2007, 9, 222 CrossRef.
- M. F. Dumont, O. N. Risset, E. S. Knowles, T. Yamamoto, D. M. Pajerowski, M. W. Meisel and D. R. Talham, Inorg. Chem., 2013, 52, 4494 CrossRef CAS PubMed.
- M. J. Andrus, Y. M. Calm, E. S. Knowles, M. F. Dumont, K. A. Abboud, M. W. Meisel and D. R. Talham, Polyhedron, 2013, 64, 289 CrossRef CAS PubMed.
Footnote |
| † Electronic supplementary information (ESI) available: Figures of the room temperature powder X-ray diffraction patterns of the 140 nm particle sample and IR spectra of NiFe–PBA of five different particle size samples. See DOI: 10.1039/c4ra03296a |
| This journal is © The Royal Society of Chemistry 2014 |

