Dynamics under confinement: torsional dynamics of Auramine O in a nanocavity†
Prabhat K. Singh*,
Aruna K. Mora,
Sushant Murudkar and
Sukhendu Nath
Radiation & Photochemistry Division, Bhabha Atomic Research Centre, Trombay, Mumbai 400 085, India. E-mail: prabhatk@barc.gov.in; prabhatsingh988@gmail.com; Fax: +91-22-25505151
First published on 28th July 2014
Abstract
The effect of confinement on the ultrafast torsional relaxation dynamics of a well-known ultrafast molecular rotor (UMR) and a recently reported amyloid fibril sensor, Auramine O (AuO), is investigated inside the nanocavity of a novel cyclodextrin derivative, sulphobutylether β-cyclodextrin (SBE-β-CD), using sub-pisosecond fluorescence upconversion spectroscopy. The nanocavity of SBE-β-CD induces a significant increase in the emission intensity and results in a slower transient decay trace of Auramine O when compared to the native β-CD. Detailed analysis of the time-resolved emission spectral features shows that the time-dependent changes in both the mean frequency and the width of the emission spectra are considerably slower as compared to bulk water and native β-CD, which suggests that the excited state torsional dynamics of AuO has been significantly affected in the nanocavity of SBE-β-CD. This effect on the torsional dynamics has been attributed to the perturbation of the water structure inside the nanocavity of SBE-β-CD which suppresses the ability of fast collective solvent reorientation motion to promote the excited-state torsional relaxation of Auramine O. The effect of ionic strength of the medium is invoked to analyze the contribution of electrostatic interactions towards the binding of AuO with SBE-β-CD and is corroborated well by computation of electrostatic potentials for the host molecules. The results also suggest that the hydrophobic interaction provided by the SBE-β-CD is larger than the native β-CD.
Introduction
Ultrafast molecular rotors (UMR) are a special class of fluorescent probe molecules which are endowed with the ability to twist around a single bond constituting a very efficient non-radiative channel in their excited state. This twisting motion in the excited state renders this class of molecules virtually non-emissive in low viscosity solvents but when this twisting motion is impeded by the friction of the surrounding microenvironment such as increased micro-viscosity, it leads to an increase in the emission yield of the molecule. This sensitivity towards the microscopic friction forms the basis for this class of molecules to function as viscosity sensors.1 Apart from sensing the micro-viscosity, when coupled with a specific recognition group molecular rotors can be a target for specific sites in biological systems and can thus provide information about the immediate surrounding microenvironment. Therefore ultrafast molecular rotors are emerging as sensitive reporters for the micro-viscosity of different biological and chemical environments.2–6Auramine O (AuO) is a well-known member of this family which has been very recently reported to detect amyloid fibrils,7 a filamentous form of the protein aggregates responsible for several neurodegenerative disorder such as Alzheimer's disease and Parkinson's disease.8 AuO is almost non-fluorescent in bulk water but in the presence of amyloid fibrils a dramatic enhancement in emission intensity of AuO takes place. It has been established in previous studies carried out in molecular liquids that upon electronic excitation of AuO in solution, the phenyl rings undergo a barrierless rotation to form a non-emissive state of charge transfer character.9–11 The relaxed excited state then goes back to the ground state. This large amplitude torsional motion is impeded by medium friction which makes the excited-state reaction rate very sensitive to the viscosity of the environment. The emission quantum yield has been shown to vary linearly with the solvent viscosity.12 The excited state dynamics of AuO measured through its time resolved emission spectra was modeled by Glassbeek and coworkers as a barrierless diffusive motion of the phenyl groups on an excited state potential energy surface formed through coupling of an emissive locally excited state and a non-emissive charge transfer state.11 Although with the exception in the case of bulk water where the solvation dynamics appeared to control the torsional rate,13,14 this diffusive model proposed by Glassbeek and coworkers was quite successful to account for the effect of viscosity on the torsional rate in a variety of media ranging from molecular solvents such as alcohols to complex confined environments like reverse micelle.11,14–17
Amyloid fibrils which are insoluble protein or polypeptide aggregates represent very complex biological media offering a wide multitude of local non-covalent interactions such as electrostatic, hydrogen bonding and hydrophobic interaction.18 In view of the fact that AuO has been recently shown to be very sensitive to the formation of amyloid fibrils, it becomes very relevant to study the excited state dynamics of AuO in somewhat simpler biomimetic confined environments, in particular, the ones which offer possibility of multiple non-covalent interactions. Knowledge of the molecular dynamics of AuO on the excited state potential energy surface in such biomimetic confined environment is essential to understand the mechanism responsible for their amyloid fibril sensing ability as well as sensing other biomolecules like DNA and enzymes.
An important example of such a confined media is sulfobutylether-β-cyclodextrin (Captisol or SBE-β-CD, Scheme 1) which is a polyanionic β-cyclodextrin derivative with a sodium sulfonate salt separated from the lipophilic cavity by a butyl ether spacer group. Natural cyclodextrins (CDs) are macrocyclic molecules which comprise of elementary glucopyranose units and possess a hydrophobic cavity of varying size depending on the number of glucopyranose units.19,20 The sulfobutylether substituent in SBE-β-CD enhances complexation by providing an extended hydrophobic cavity and an extremely hydrophilic exterior surface as compared to native β-CD.21,22 In addition it also provides improved solubility in water and better toxicity profile as compared to native β-CD.23 The derivative known as SBE-β-CD is an FDA approved pharmaceutical stabilizer and currently used in five commercially approved injectable products.23 Although there are a few literature reports that primarily focus on the structural information on the host–guest complexes of some potential drug molecules with the SBE-β-CD,22–24 to the best of our knowledge, there is no report on the molecular dynamics of the guest molecule in the ultrafast time regime in this potential lipophilic nanocavity.
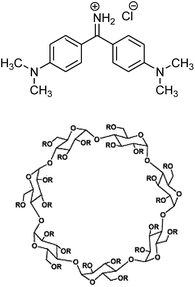 | ||
| Scheme 1 Molecular structure of Auramine O and sulphobutylether-β-cyclodextrin. R = (H)21−n or (CH2)4-SO3Na)n where n = 6.2–7.1, CAPTISOL®. | ||
In this paper, we examine the effect of confinement of nanocavity of the SBE-β-CD on the ultrafast torsional dynamics of AuO using femtosecond fluorescence upconversion technique which is uniquely suited to reveal the information on the excited state dynamics in the sub-ps time regime. Detailed analysis of the temporal evolution of the emission spectral features which includes mean frequency, width of the emission spectra (FWHM) and integrated area under the emission spectra has been carried out and compared with that reported in bulk water and native β-CD. The effect of ionic strength of the medium is also performed to analyse the effect of electrostatic interaction towards the binding of AuO with SBE-β-CD.
Results and discussion
Ground state absorption measurements
Ground state absorption spectra of AuO were recorded in water and in the presence of various concentrations of macrocyclic host SBE-β-CD and are shown in Fig. 1. AuO shows characteristic absorption maxima at 368 nm and 431 nm in water which corresponds to the transition from the ground state to the second and first excited electronic state respectively.12 On addition of SBE-β-CD to the aqueous solution of AuO, a small but gradual reduction in AuO absorbance with a bathochromic shift of ∼10 nm in the long wavelength absorption maximum was observed. Absorption spectral changes displayed a distinct isobestic point at 381 nm and 439 nm which is suggestive of complexation equilibrium between the free and bound form of AuO. The observed bathochromic shift in the absorption spectra for the dye in SBE-β-CD could be due to the hydrophobic effect inside SBE-β-CD cavity. A small but definitive red shift (∼4 nm) has been observed for the dye in the native β-CD.25 Besides hydrophobic effect, the observed bathochromic shift can also be ascribed to the electrostatic interaction between the cationic Auramine O and the anionic sulphobutyl ether group of SBE-β-CD. Similar bathochromic shift has been observed for the AuO in polyanionic DNA solution26 and SDS micelle14 which offers potential sites for the electrostatic interaction with AuO. The contribution of electrostatic interaction towards the binding of AuO with SBE-β-CD has been confirmed by employing the effect of ionic strength of the solution on the photophysical properties of the AuO–SBE-β-CD complex (see later).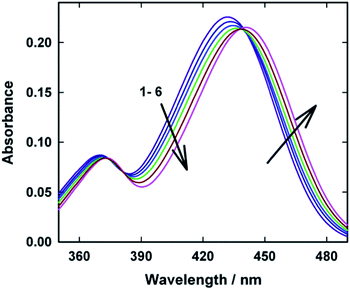 | ||
| Fig. 1 Ground-state absorption spectra of Auramine-O at different SBE-β-CD concentrations: (1) 0.0, (2) 2.5, (3) 5.0, (4) 10.0, (5) 22.0, (6) 110.0 μM. | ||
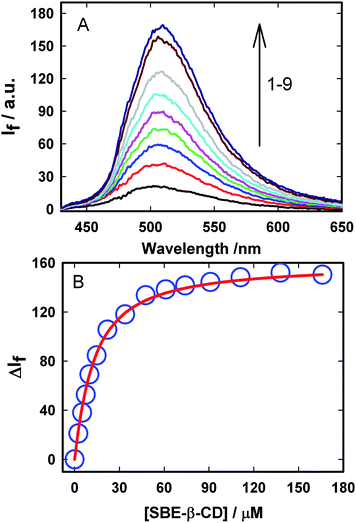
In order to evaluate the strength of binding and also the stoichiometric compositions of the inclusion complexes, the variation in the fluorescence intensity of the AuO with the gradually varying SBE-β-CD concentration was analyzed using the 1![[thin space (1/6-em)]](https://www.rsc.org/images/entities/char_2009.gif) :
:![[thin space (1/6-em)]](https://www.rsc.org/images/entities/char_2009.gif) 1 complexation model which gave satisfactory fitting to the experimental results. In the experimental solution, keeping the total dye concentration [AuO]0 the same, the observed steady-state fluorescence intensity If at any concentration of the host SBE-β-CD can be expressed as,27,28
1 complexation model which gave satisfactory fitting to the experimental results. In the experimental solution, keeping the total dye concentration [AuO]0 the same, the observed steady-state fluorescence intensity If at any concentration of the host SBE-β-CD can be expressed as,27,28
 | (1) |
 | (2) |
 | (3) |
The binding constant (Keq) for AuO with SBE-β-CD as obtained from the nonlinear fitting of the titration curve in Fig. 2B using the eqn (2) was thus estimated to be 9.8 ± 0.5 × 10⁴ M−1. The high value of Keq indicates a very strong interaction of the AuO with the nanocavity of the SBE-β-CD. On the contrary, the binding constant for the complexation of AuO with native β-cyclodextrin is reported to be 197 M−1.29 These values suggest that the interaction of AuO with the anionic SBE-β-CD is much stronger as compared to the native β-CD. This difference in binding strength can be ascribed to the additional electrostatic interaction with SBE-β-CD owing to the presence of anionic sulfonato group together with the effect of butyl ether group which extends the hydrophobic cavity of CD leading to stronger association of the cationic AuO with SBE-β-CD.
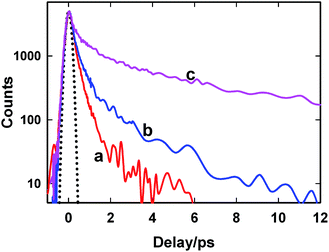
At the emission maximum (500 nm), AuO displays a bi-exponential decay behaviour in bulk water whereas in the presence of SBE-β-CD, the decay kinetics becomes tri-exponential in nature. The longest component (τ3) arises only in the presence of SBE-β-CD and can be assigned to the bound form of the dye in the nanocavity whereas the shorter component (τ1) remains invariant in the presence of host which is possibly due to the free AuO in the solution. The intermediate component (τ2) is slightly lengthened in the presence of host as compared to bulk water. This might possibly be a convoluted response of both the slow component of bulk water and faster component of complex which could not be separated here. It is quite obvious from Fig. 3 and Table 1 that the torsional relaxation in the excited state of AuO is significantly hindered in the nanocavity of SBE-β-CD as compared to marginal slowdown in the native β-CD. These results are in agreement to steady-state emission measurements and binding constant values which suggest that the association of AuO with SBE-β-CD is much stronger as compared to the native β-CD. Due to such a strong association of the AuO with SBE-β-CD cavity the torsional dynamics in the excited state of AuO is significantly hindered.
| Sample | τ1/ps | A1 | τ2/ps | A2 | τ3/ps | A3 |
|---|---|---|---|---|---|---|
| Water | 0.12 | 0.37 | 0.35 | 0.63 | ||
| Native β-CD (10 mM) | 0.17 | 0.61 | 1.3 | 0.39 | ||
| SBE-β-CD (110 μM) | 0.12 | 0.07 | 0.99 | 0.20 | 8.25 | 0.74 |
| SBE-β-CD + 7.5 mM NaCl | 0.10 | 0.13 | 1.05 | 0.17 | 7.39 | 0.70 |
| SBE-β-CD + 390 mM NaCl | 0.08 | 0.18 | 0.72 | 0.23 | 6.7 | 0.59 |
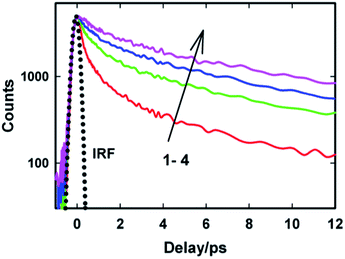
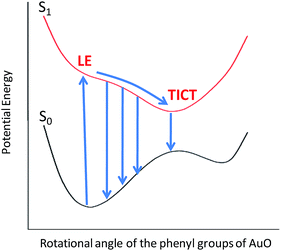
To gain more detailed insights into the fluorescence decay dynamics of AuO in the nanocavity of SBE-β-CD, we measured the fluorescence decay kinetics at a range of wavelengths covering the entire emission spectrum. Fluorescence transient decays for AuO in the presence of SBE-β-CD at some representative emission wavelengths are shown in the Fig. 4. It is evident from Fig. 4 that the transient fluorescence decays are strongly dependent on the monitoring emission wavelength. As the monitoring wavelength is moved from the blue edge to the red edge of the emission spectrum, the mean decay time gets longer. Previous time-resolved fluorescence upconversion measurements of AuO have revealed such complex wavelength dependent decay kinetics in different media ranging from molecular solvents like alcohol to complex environment of reverse micelle.11,14,17 This wavelength dependent decay kinetics has been attributed to the torsional motion of the phenyl groups on a barrierless excited state potential energy surface. The excited state gradually changes its electronic properties as a function of the phenyl angle. At small angle it displays LE character with large oscillator strength while at larger angle it turns to TICT state with very low oscillator strength (Scheme 2). Thus the radiative decay constant of the resulting lower excited state become dependent on the phenyl bond twisting angle which leads to wavelength dependent decay of the excited state population. It has been shown that the rate of torsional relaxation is controlled by the viscosity in the case of more viscous and slowly relaxing solvents. However bulk water appears to present a different case where, to a first approximation, the torsional relaxation rate of AuO is controlled by aqueous solvation dynamics rather than solvent viscosity.14
The excited state dynamics is best viewed through the time-dependent emission spectra for which wavelength-dependent fluorescence decays were transformed to time-resolved emission spectra (TRES) following the procedure proposed by Maroncelli and Fleming.31 The resulting time-dependent spectral profiles are well fitted by the lognormal function (Fig. 5). From the lognormal function, different spectral parameters such as mean frequency (first moment), time-dependent integrated intensity and the spectral width can be calculated as a function of time. It is evident from Fig. 5 that a large reduction in the emission intensity takes place with time. The variation in the integrated area under the emission spectra (shown in the inset of Fig. 5) for AuO in SBE-β-CD is presented along with the one reported for bulk water and native β-CD.25 It is quite evident from Fig. 5 (inset) that the decrease in integrated area is reasonably slower in SBE-β-CD in comparison to bulk water and native β-CD. In a time window of 3 ps, the integrated intensity for water and native β-CD25 decays to <1% and ∼2.5% respectively whereas in the same time window, the integrated intensity is above 10% for SBE-β-CD. These large changes in the integrated area under the emission spectra for AuO in different media result from the ultrafast non-radiative torsional motion in the excited AuO molecule. The fact that the relatively slower reduction takes place in the integrated area of AuO in SBE-β-CD solution as compared to that in bulk water and native β-CD is a clear manifestation of the increased retardation in the torsional motion inside the SBE-β-CD cavity as compared to that in native β-CD. The slower torsional motion in SBE-β-CD cavity leads to the slow rate of transfer of population from the emissive locally excited state to the non-emissive charge transfer state. It is also evident from Fig. 5 that the emission spectra shows a gradual red shift with time. Fig. 6 shows the variation of mean frequency (first moment) of the spectrum with time. Thus a Stokes' shift of ∼1200 cm−1 has been observed for AuO in SBE-β-CD solution within 10 ps time following the photoexcitation. The observed dynamic Stokes' shift for AuO is reported to be due to the diffusive torsional motion of the phenyl group on a barrierless excited state potential energy surface which arises from the adiabatic coupling of the emissive locally excited state and the dark non-emissive charge transfer state. As the twisting proceeds, the excited state population moves along the barrier-less potential energy surface towards the lower energy leading to red shift with time.11,14,15,17 Such dynamic Stokes' shifts due to different intramolecular processes like bond-twisting, trans–cis isomerization etc. in the excited state have been reported for different chemical systems.30,32–36 Thus, we infer that the observed dynamic Stokes' shift for AuO in SBE-β-CD nanocavity also originates from the intramolecular torsional relaxation process operative in the excited state of AuO which causes the lowering in energy of the excited electronic state from the high energy locally excited state to the low energy charge transfer state leading to dynamic Stokes' shift.
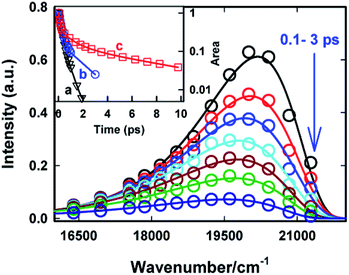 | ||
| Fig. 5 Time-resolved emission spectra (TRES) of Auramine-O in 110 μM SBE-β-CD solution at different times. The circles are the experimental data points and the solid lines are the experimental data points and the solid lines are the lognormal fit to the data points. Inset: the variation in area under the emission curve (normalized to 1 at 50 fs) with time. (a) Bulk water25 (b) native β-CD25 and (c) SBE-β-CD. The symbols are the data points and the solid line is just connecting the data points (the data for water and native β-CD is reproduced from ref. 25 with permission). | ||
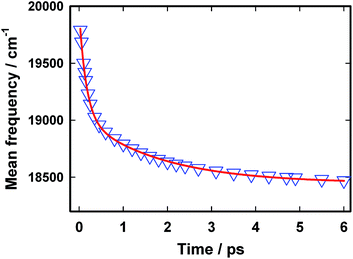 | ||
| Fig. 6 The variation in mean frequency with time for Auramine O in 110 μM SBE-β-CD solution. The triangles represent the data points and the solid line is a bi-exponential fit to the data points. | ||
The temporal profile for the dynamic Stokes' shift is well described by a bi-exponential decay function with a fast component of 0.16 ps (60%) and a relatively slow component of 1.8 ps (40%). The shorter time constant obtained in the present case is very close to that obtained in the case of bulk water14 and is possibly due to the free AuO present in the solution whereas the slow component of 1.8 ps can be assigned to the AuO which are associated with the nanocavity of SBE-β-CD. It is to be noted that although a nominal slowdown of the temporal decay of mean frequency for the AuO in native β-CD has been reported in literature25 but even in that case entire Stokes' shift dynamics is complete within 1 ps whereas in the case of SBE-β-CD the Stokes' shift dynamics has a slow component of 1.8 ps which dominates the decay beyond 1 ps and continues upto 10 ps. Thus the Stokes' shift dynamics which is a manifestation of torsional motion of the phenyl group in the barrier-less excited state potential energy surface in AuO is significantly hindered in the SBE-β-CD as compared to the native β-CD and leads to a comparatively slower decrease in energy of the excited-state on the potential energy surface in the presence of SBE-β-CD compared to native β-CD.
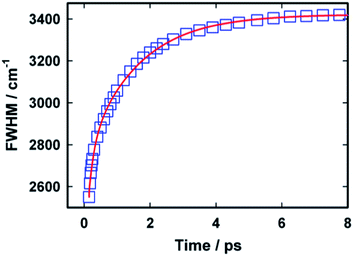
Fig. 7 presents the variation in the width (full width at half maximum) of the time dependent emission spectra with time. It is evident from the figure that width of the spectra gradually increases with time. The model used for describing the relaxation dynamics of AuO always predicts an increase in the width of the spectra with time and has been experimentally observed for AuO in several medium including bulk water and reverse micelles.15 It has also been observed that the growth in the width of the spectra follows a similar kinetics as that of the dynamic Stokes' shift.15 In our case the variation in the width for AuO in SBE-β-CD follows a bi-exponential kinetics in contrast to the mono-exponential kinetics observed in case of bulk water. The time constants obtained in case of SBE-β-CD are 0.17 ps (44%) and 1.55 ps (56%). The shorter time constant obtained in this case is very close to the shorter component observed for the dynamic Stokes' shift and is possibly due to the free AuO present in water. Further the slow component in this case is also very similar to the slow component observed for the dynamic Stokes' shift and thus this longer component is assigned to originate from the inclusion complex of AuO with SBE-β-CD.
It was suggested previously that the excited state reorganisation of AuO is coupled with the solvation dynamics in case of bulk water,14 and the perturbed water structure at the surfactant–water interface was found to affect the rate of excited state torsional relaxation of AuO at surfactant–water interface.14 Thus it is logical to imagine that the slow reaction dynamics of AuO in SBE-β-CD nanocavity could be a manifestation of perturbed water structure in the nanocavity. Solvation dynamics in bulk water is driven by collective reorganisation of the H-bond network,37 so a significant slowdown of the torsional dynamics of AuO in SBE-β-CD cavity is indicative of a significant perturbation of the H-bond network inside the nanocavity. Important information regarding the water structure can be obtained from the molecular dynamics simulation of these systems. Although a direct MD simulation of the water structure in SBE-β-CD cavity is not available, an atomistic MD simulation of aqueous solution of β-CD and its substituted derivatives would be very relevant here.38 These calculations reveal that the substitution of –OH group strongly influences the dynamical properties of water, in particular those inside the cavities. It has been shown that the translational and reorientational mobility of cavity water is severely diminished with substitution of –OH group of β-CD. Reorientational dynamics of the cavity water in the tri-methyl substituted β-CD derivative was shown to be 4–5 times slower compared to unsubstituted β-CD.38 The enhanced degree of confinement with the increased degree of substitution of –OH group was also evident from the estimation of average structural relaxation time of cyclodextrin–water (CW) hydrogen bonds and the water–water (WW) hydrogen bonds in the cavity. Average structural relaxation time for CW hydrogen bonds 〈τCWC〉 formed by cavity water molecules in substituted β-CD are 3–4 times longer than the unsubstituted β-CD and is an order of magnitude slower than the bulk water. Interestingly the structural relaxation time, 〈τwwC〉 of hydrogen bonds formed by the cavity water molecules in unsubstituted β-CD is similar to that of bulk water but the substitution leads to slowdown of the structural relaxation time by a factor of 4–6. Thus in a nutshell these simulations suggest that the enhanced degree of confinement of the cavity water molecules due to substitution of –OH group of β-CD has a stronger influence on the dynamics of these water molecules and the relaxation time scales of hydrogen bonds formed by them.38 Further, the presence of sulphonato group is also expected to perturb the water structure on the exterior of the nanocavity. A detailed simulation by Bruce and co-workers on the relevant SDS-water external interface, which also bears a sulphonated head group, revealed a strong perturbation of the orientational dynamics of water molecules at the external surface specially the first shell which is directly interacting with the sulphonated head group.39,40 Thus, it is suggested that the perturbation in the water structure inside the nanocavity of SBE-β-CD suppresses the ability of fast collective solvent reorientation motion to promote the excited state reaction of AuO and leads to significant slowdown of the torsional dynamics in the nanocavity of SBE-β-CD.
Effect of ionic strength
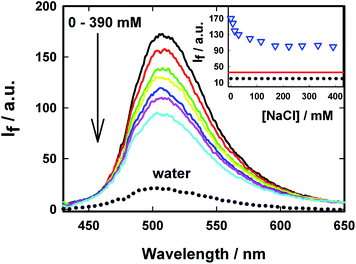
Several non-covalent intermolecular interactions can contribute towards the binding of a guest molecule to a supramolecular host. As the host in the present case is anionic due to the presence of sulphonated groups (SBE-β-CD) and the guest (AuO) is cationic, it is highly probable that electrostatic interaction between the anionic SBE-β-CD and the cationic AuO will also contribute towards the strengthening of the association of the guest with the host. To examine this argument, we have investigated the effect of ionic strength of the medium on the complexation of AuO with SBE-β-CD. Fig. 8 shows the variation of emission spectra of AuO–SBE-β-CD complex in the presence of various concentrations of sodium chloride. It is observed that the emission intensity gradually decreases with increase in the concentration of salt in the solution and levels off at 100 mM of sodium chloride and remains constant beyond that. It can also be seen that the emission intensity never reaches the level observed in bulk water. The decrease in the emission intensity in the presence of salt can be ascribed to the decrease in the equilibrium association constant between the host and the guest because the increase in the ionic strength of the solution is expected to weaken the electrostatic interaction between the host and the guest. However the fact that it never reaches the bulk water behaviour suggests that along with the electrostatic interaction the hydrophobic interaction with the cavity of SBE-β-CD is also a major contributor towards the binding of AuO with SBE-β-CD. It may be reasonable to assume that in the presence of 390 mM NaCl, the remaining emission intensity from the AuO–SBE-β-CD complex is mostly an outcome of hydrophobic interaction. It would be interesting to compare this emission intensity with the AuO in presence of native β-CD in absence of salt. On comparison it turns out that this emission intensity is still much larger compared to AuO with same concentration of native β-CD without salt. This suggests that the hydrophobic interaction in SBE-β-CD is stronger than the native β-CD. This can be ascribed to the presence of butyl ether groups which extend the hydrophobic cavity of SBE-β-CD as compared to native β-CD and results in more efficient complexation with the former.To corroborate the steady-state emission measurement we also made ground state absorption measurements for the AuO–SBE-β-CD complex in presence of sodium chloride. Fig. 9 shows the ground state absorption spectra of AuO–SBE-β-CD complex in absence and presence of sodium chloride. The absorption spectrum of AuO in bulk water has also been shown for comparison. It was stated previously that the absorption maximum is red shifted by 10 nm on complexation with SBE-β-CD but on addition of salt, the absorption maximum moves towards that of bulk water however it does not reach the situation observed in bulk water. At the highest concentration of the salt studied here (390 mM NaCl) the absorption maximum appears at ∼437 nm which is intermediate between that of AuO in bulk water and the AuO–SBE-β-CD complex. This observation is in agreement with the steady-state emission measurements which also show that the addition of salt never leads to complete recovery of the situation prevailing in bulk water.
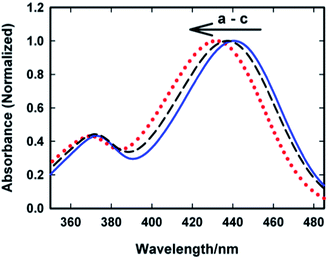 | ||
| Fig. 9 Ground-state absorption spectra of Auramine-O in (a) 110 μM SBE-β-CD (solid blue line) (b) in 110 μM SBE-β-CD with 390 mM sodium chloride (black dashed line) and (c) in water (dotted red). | ||
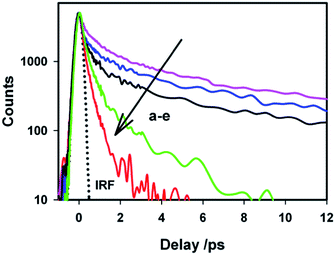
To understand the effect of ionic strength on the excited state dynamics of AuO in SBE-β-CD cavity, we also carried out excited state emission lifetime measurements for AuO–SBE-β-CD complex in presence of salt by monitoring the transient at their emission maximum (500 nm). Fig. 10 shows the transient decay traces for the AuO–SBE-β-CD complex in absence and presence of varying concentration of sodium chloride. The transient decay trace in the bulk water has been also shown for comparison. It is observed that transient decay trace for the AuO–SBE-β-CD complex becomes gradually faster with increase in the salt concentration. The fitted parameters for the decay traces have been presented in Table 1. It is evident from Table 1 that the contribution of the faster components (τ1 and τ2) increases whereas the contribution of the slower component (τ3) decreases with increase in the concentration of the salt in the solution. This is attributed to the weakening of the complexation in the presence of salt. It also becomes obvious that the transient decay trace does not reach the situation observed in bulk water. This is in accordance with the ground state absorption and steady-state emission measurements in presence of salt. It can be further observed that the transient decay trace for AuO in SBE-β-CD even in presence of salt (390 mM) is still slower than the AuO in native β-CD suggesting that SBE-β-CD provides a stronger hydrophobic interaction as compared to native β-CD. This is in line with steady-state emission measurements. These observations imply that multiple interactions with the host such as both electrostatic interaction and hydrophobic interaction contributes towards the stronger binding of AuO with the SBE-β-CD nanocavity. The stronger binding eventually leads to a large retardation of the phenyl group rotation in the excited state resulting in increased emission quantum yield and emission lifetimes as compared to native β-CD which binds to the cationic AuO with a relatively much weaker hydrophobic interaction.
To understand the interaction of AuO with the host better, we have computed the interaction energy (ΔH) for the complexation of AuO with native β-CD, SBE-β-CD (anionic) and SBE-β-CD (neutral) at the semiempirical PM3 level. For this purpose initially the structures of AuO, native β-CD, SBE-β-CD (neutral) and SBE-β-CD (anionic) were optimized. Subsequently the structures of 1![[thin space (1/6-em)]](https://www.rsc.org/images/entities/char_2009.gif) :
:![[thin space (1/6-em)]](https://www.rsc.org/images/entities/char_2009.gif) 1 complex of AuO with all the hosts were optimized with various input geometries by placing the host along the AuO molecule. From the optimized parameters, the interaction energies of the 1
1 complex of AuO with all the hosts were optimized with various input geometries by placing the host along the AuO molecule. From the optimized parameters, the interaction energies of the 1![[thin space (1/6-em)]](https://www.rsc.org/images/entities/char_2009.gif) :
:![[thin space (1/6-em)]](https://www.rsc.org/images/entities/char_2009.gif) 1 complexation of AuO with native β-CD, SBE-β-CD (neutral) and SBE-β-CD (anionic) is estimated to be 17.1, 64.9 and 197.9 kcal mol−1 respectively. The interaction energy obtained for the AuO–β-CD complex is comparable to the value reported previously for the β-CD inclusion complexes.41,42 The higher value of interaction energy for the SBE-β-CD (neutral) in comparison to native β-CD might be attributed to the additional hydrophobic interaction owing to the presence of butyl ether group in neutral SBE-β-CD as compared to native β-CD. The higher host–guest interaction energy for the anionic SBE-β-CD in comparison to neutral SBE-β-CD suggests the presence of additional electrostatic interaction between anionic SBE-β-CD and cationic AuO. This is further supported by the computation of electrostatic potential surfaces for the β-CD and SBE-β-CD. ESP surfaces (Fig. 11B) illustrates that the exterior of the SBE-β-CD surface is significantly negative, as expected. Further the interior of the SBE-β-CD cavity is also found to be more negative as compared to the native β-CD. This clearly explains the strong affinity of SBE-β-CD for the cationic AuO. Thus these calculations support our experimental finding that the complexation of AuO with SBE-β-CD is stronger compared to native β-CD owing to additional hydrophobic and electrostatic interaction.
1 complexation of AuO with native β-CD, SBE-β-CD (neutral) and SBE-β-CD (anionic) is estimated to be 17.1, 64.9 and 197.9 kcal mol−1 respectively. The interaction energy obtained for the AuO–β-CD complex is comparable to the value reported previously for the β-CD inclusion complexes.41,42 The higher value of interaction energy for the SBE-β-CD (neutral) in comparison to native β-CD might be attributed to the additional hydrophobic interaction owing to the presence of butyl ether group in neutral SBE-β-CD as compared to native β-CD. The higher host–guest interaction energy for the anionic SBE-β-CD in comparison to neutral SBE-β-CD suggests the presence of additional electrostatic interaction between anionic SBE-β-CD and cationic AuO. This is further supported by the computation of electrostatic potential surfaces for the β-CD and SBE-β-CD. ESP surfaces (Fig. 11B) illustrates that the exterior of the SBE-β-CD surface is significantly negative, as expected. Further the interior of the SBE-β-CD cavity is also found to be more negative as compared to the native β-CD. This clearly explains the strong affinity of SBE-β-CD for the cationic AuO. Thus these calculations support our experimental finding that the complexation of AuO with SBE-β-CD is stronger compared to native β-CD owing to additional hydrophobic and electrostatic interaction.
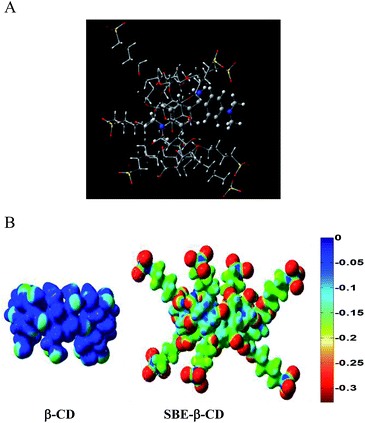 | ||
Fig. 11 (A) Optimized geometry for the AuO–SBE-β-CD 1![[thin space (1/6-em)]](https://www.rsc.org/images/entities/char_2009.gif) : :![[thin space (1/6-em)]](https://www.rsc.org/images/entities/char_2009.gif) 1 complex. (B) Electrostatic surface potentials calculated for native β-CD and sulfobutyl ether-β-CD. 1 complex. (B) Electrostatic surface potentials calculated for native β-CD and sulfobutyl ether-β-CD. | ||
Conclusions
The excited state torsional relaxation dynamics of Auramine O has been investigated inside the nanocavity of a novel cyclodextrin derivative, sulfobutylether β-CD (SBE-β-CD) using the femtosecond fluorescence upconversion spectroscopy. AuO forms a 1![[thin space (1/6-em)]](https://www.rsc.org/images/entities/char_2009.gif) :
:![[thin space (1/6-em)]](https://www.rsc.org/images/entities/char_2009.gif) 1 inclusion complex with the SBE-β-CD with a strong affinity (Keq = 9.8 × 10⁴ M−1) as compared to native β-CD (Keq = 197 M−1) and this difference has been ascribed to the additional electrostatic interaction along with stronger hydrophobic interaction of AuO with the former. This strong inclusion complexation affects the excited state torsional relaxation dynamics to a significant extent leading to a large emission enhancement of AuO in presence of SBE-β-CD as compared to native β-CD. The transient decay trace was also found to be significantly slowed down in case of SBE-β-CD as compared to native β-CD. The analysis of temporal evolution of emission spectra reveals the presence of dynamic Stokes' shift as well as variation in the spectral width with time. The decay of the mean frequency, growth of the spectral width and the decay of the integrated area under the emission spectra is found to be slower for AuO in the nanocavity of SBE-β-CD as compared to bulk water and the native β-CD. These observations substantiate the distinct effect of confinement on the excited state torsional relaxation dynamics of AuO inside the nanocavity of SBE-β-CD. The perturbation of water structure inside the nanocavity has been suggested to be the reason behind the slow torsional dynamics of AuO. The effect of the ionic strength of the medium is introduced to decipher the effect of electrostatic interaction from the hydrophobic interaction and the results suggest that the hydrophobic interaction with the SBE-β-CD is much stronger than the native β-CD which has been ascribed to the presence of butyl ether groups that extends the hydrophobic cavity of the cyclodextrin and leads to improved binding. This is further supported by the computation of interaction energy of the complexes and the electrostatic surface potential of the host molecules. Although the emission enhancement obtained for AuO in the case of SBE-β-CD is reasonably less than obtained in case of amyloid fibrils, these results imply that beside other factors operative in the AuO–amyloid fibril system, hydrophobic and electrostatic interactions could be the one that is mainly responsible for the observed fluorescence enhancement in the fibrillar system. Further, in view of the application of SBE-β-CD in the drug formulation these results become relevant to the behavior of many drug molecules with a similar structure in the nanocavity in the very short time scale.
1 inclusion complex with the SBE-β-CD with a strong affinity (Keq = 9.8 × 10⁴ M−1) as compared to native β-CD (Keq = 197 M−1) and this difference has been ascribed to the additional electrostatic interaction along with stronger hydrophobic interaction of AuO with the former. This strong inclusion complexation affects the excited state torsional relaxation dynamics to a significant extent leading to a large emission enhancement of AuO in presence of SBE-β-CD as compared to native β-CD. The transient decay trace was also found to be significantly slowed down in case of SBE-β-CD as compared to native β-CD. The analysis of temporal evolution of emission spectra reveals the presence of dynamic Stokes' shift as well as variation in the spectral width with time. The decay of the mean frequency, growth of the spectral width and the decay of the integrated area under the emission spectra is found to be slower for AuO in the nanocavity of SBE-β-CD as compared to bulk water and the native β-CD. These observations substantiate the distinct effect of confinement on the excited state torsional relaxation dynamics of AuO inside the nanocavity of SBE-β-CD. The perturbation of water structure inside the nanocavity has been suggested to be the reason behind the slow torsional dynamics of AuO. The effect of the ionic strength of the medium is introduced to decipher the effect of electrostatic interaction from the hydrophobic interaction and the results suggest that the hydrophobic interaction with the SBE-β-CD is much stronger than the native β-CD which has been ascribed to the presence of butyl ether groups that extends the hydrophobic cavity of the cyclodextrin and leads to improved binding. This is further supported by the computation of interaction energy of the complexes and the electrostatic surface potential of the host molecules. Although the emission enhancement obtained for AuO in the case of SBE-β-CD is reasonably less than obtained in case of amyloid fibrils, these results imply that beside other factors operative in the AuO–amyloid fibril system, hydrophobic and electrostatic interactions could be the one that is mainly responsible for the observed fluorescence enhancement in the fibrillar system. Further, in view of the application of SBE-β-CD in the drug formulation these results become relevant to the behavior of many drug molecules with a similar structure in the nanocavity in the very short time scale.
Experimental section
Auranine O (AuO) was purchased from Sigma-Aldrich as the chloride salt and was purified by several sublimation steps. Sulfobutylether-β-cyclodextrin (CAPTISOL®, average degree of sulfobutyl substitution: seven; average MW 2162) (SBE-β-CD) was kindly supplied by CyDex Pharmaceutical Inc. (La Jolla, California, USA). Sodium chloride was obtained from the Sigma-Aldrich. Nanopure water (conductivity less than 0.1 μS cm−1), from a Millipore Milli Q system, was used for all sample preparations. All measurements were carried out using freshly prepared solution of the dye in SBE-β-CD.Ground state absorption measurements were performed in JASCO spectrophotometer model V650. Steady-state fluorescence measurements were made in a Hitachi spectrofluorimeter, model F-4500. The measured spectra, F(λ), were in wavelength domain and were converted to frequency domain, I(![[small nu, Greek, macron]](https://www.rsc.org/images/entities/i_char_e0ce.gif) ), by using the following equation.43
), by using the following equation.43
I(![[small nu, Greek, macron]](https://www.rsc.org/images/entities/i_char_e0ce.gif) ) = λ2I(λ) ) = λ2I(λ)
| (4) |
Time-resolved fluorescence measurements were carried out using a femtosecond fluorescence upconversion instrument (FOG 100, CDP Inc. Russia) which has been described in detail elsewhere.44 Briefly, a second harmonic laser pulse at 410 nm after frequency doubling of the fundamental output of a Ti-sapphire oscillator (820 nm, 50 fs, 88 MHz) in a BBO crysal was used for the sample excitation. The fluorescence light collected from the sample was overlapped with the residual fundamental laser beam (gate beam) into the BBO crystal. The gate beam passes through an optical delay rail before mixing with the fluorescence in the BBO crystal. The upconverted signal was passed through a bandpass filter to cut the excitation and the gate beam and was then dispersed in a double monochromator. The instrument response function (IRF) was measured through the cross correlation of the excitation and the fundamental laser pulse. The IRF was found to have a Gaussian intensity profile with FWHM of 210 fs. For fluorescence lifetime measurements, polarization of the excitation laser beam was set to the magic angle (54.7°) with respect to the horizontally polarized gate pulse. Each decay was collected at least for 2–3 times to see the reproducibility of the measurements. Sample was taken into a rotating cell with optical path length of 1 mm to avoid the photodecomposition of the sample.
For spectrum reconstruction, fluorescence transients were recorded at 10 nm intervals across the steady-state emission spectrum. All these fluorescence transients were fitted with a multi-exponential function convoluted with the instrument response function using the iterative convolution method. Time-resolved emission spectra were reconstructed following the method proposed by Maroncelli and Fleming.31 Each reconstructed spectrum was fitted using the lognormal function of the following form.31
 | (5) |
The full width at half maximum (FWHM) of the emission spectra is related to the width parameter, w and the asymmetry parameter, b, by the following relation.31
 | (6) |
The decay traces are fitted with a multi-exponential function of the following form,
I(t) = I(0)∑αi![[thin space (1/6-em)]](https://www.rsc.org/images/entities/char_2009.gif) exp(−t/τi) exp(−t/τi)
| (7) |
All the quantum chemical calculations were performed using a set of Gaussian 03 programme.45 The structure of SBE-β-CD (anionic) was constructed by placing four and three anionic sulphobutylether group on the larger and smaller rim respectively of native β-CD. For constructing SBE-β-CD (neutral) anionic sulphobutylether groups were replaced by neutral sulphobutylether groups. The geometry of Auramine O, β-CD, SBE-β-CD (neutral) and SBE-β-CD (anionic) were optimised using semiempirical methods at the PM3 level. Single point energy calculation was performed at these optimized geometry with the Hartree–Fock (HF) method using 3-21G* basis set to provide the input for the calculation of Electrostatic surface potentials. The electostatic surface potential were obtained using the cubegen module of Gaussview 3.9 package. The relative potential values were projected onto the color coded form onto the isodensity surface by using the Gaussview 3.9 package. The interaction energy for the complexes were calculated at the semiempirical PM3 level.
Acknowledgements
The authors are thankful to Prof. A. Datta, Indian Institute of Technology, Powai for his help in quantum chemical calculations. The authors also thank Dr A. K. Pathak for many helpful discussions. The authors acknowledge Dr H. Pal, Dr D. K. Palit and Dr B. N. Jagtap for their constant encouragement and support during the course of this work.Notes and references
- M. A. Haidekker, M. Nipper, A. Mustafic, D. Lichlyter, M. Dakanali and E. A. Theodorakis, in Advanced Fluorescence Reporters in Chemistry and Biology I: Fundamentals and Molecular Design, ed. A. P. Demchenko, Springer-Verlag, Berlin, 2010, pp. 267–308 Search PubMed.
- S. Murudkar, A. K. Mora, P. K. Singh and S. Nath, Chem. Commun., 2012, 48, 5301–5303 Search PubMed.
- M. A. Haidekker and E. A. Theodorakis, Org. Biomol. Chem., 2007, 5, 1669–1678 Search PubMed.
- P. K. Singh, J. Sujana, A. K. Mora and S. Nath, J. Photochem. Photobiol., A, 2012, 246, 16–22 CrossRef CAS PubMed.
- M. A. Haidekker and E. A. Theodorakis, J. Biol. Eng., 2010, 4, 11 Search PubMed.
- P. K. Singh and S. Nath, J. Photochem. Photobiol., A, 2012, 248, 42–49 Search PubMed.
- N. Amdursky and D. Huppert, J. Phys. Chem. B, 2012, 116, 13389–13395 CrossRef CAS PubMed.
- F. Chiti and C. M. Dobson, Annu. Rev. Biochem., 2006, 75, 333–366 Search PubMed.
- P. Changenet, H. Zhang, M. J. van der Meer, M. Glasbeek, P. Plaza and M. M. Martin, J. Phys. Chem. A, 1998, 102, 6716–6721 Search PubMed.
- M. Glasbeek, H. Zhang and M. J. van der Meer, J. Mol. Liq., 2000, 86, 123–126 Search PubMed.
- M. J. van der Meer, H. Zhang and M. Glasbeek, J. Chem. Phys., 2000, 112, 2878–2887 CrossRef CAS PubMed.
- G. Oster and Y. Nishijima, J. Am. Chem. Soc., 1956, 78, 1581–1584 CrossRef CAS.
- Y. Hirose, H. Yui and T. Sawada, J. Phys. Chem. B, 2004, 108, 9070–9076 CrossRef CAS.
- M. Kondo, I. A. Heisler and S. R. Meech, J. Phys. Chem. B, 2010, 114, 12859–12865 CrossRef CAS PubMed.
- I. A. Heisler, M. Kondo and S. R. Meech, J. Phys. Chem. B, 2009, 113, 1623–1631 CrossRef CAS PubMed.
- M. Kondo, I. A. Heisler, J. Conyard, J. P. H. Rivett and S. R. Meech, J. Phys. Chem. B, 2009, 113, 1632–1639 Search PubMed.
- M. Kondo, I. A. Heisler and S. R. Meech, Faraday Discuss., 2010, 145, 185–203 RSC.
- R. Wetzel, S. Shivaprasad and A. D. Williams, Biochemistry, 2007, 46, 1–10 CrossRef CAS PubMed.
- R. Villalonga, R. Cao and A. Fragoso, Chem. Rev., 2007, 107, 3088–3116 CrossRef CAS PubMed.
- F. Hapiot, S. Tilloy and E. Monflier, Chem. Rev., 2006, 106, 767–781 CrossRef CAS PubMed.
- G. Mosher and D. O. Thompson, Complexation and cyclodextrins, Marcel Dekker, New York, 2002 Search PubMed.
- L. García-Río, M. Mendez, M. R. Paleo and F. J. Sardina, J. Phys. Chem. B, 2007, 111, 12756–12764 Search PubMed.
- S. Tongiani, T. Ozeki and V. J. Stella, J. Pharm. Sci., 2009, 98, 4769–4780 Search PubMed.
- C. Arama, C. Nicolescu, A. Nedelcu and C. Monciu, J. Inclusion Phenom. Macrocyclic Chem, 2011, 70, 421–428 CrossRef CAS.
- M. kondo, I. A. Heisler and S. R. Meech, J. Mol. Liq., 2012, 176, 17–21 CrossRef CAS PubMed.
- P. Gautam and A. Harriman, J. Chem. Soc., Faraday Trans., 1994, 90, 697–701 RSC.
- M. K. Singh, H. Pal, A. S. R. Koti and A. V. Sapre, J. Phys. Chem. A, 2004, 108, 1465–1474 Search PubMed.
- P. K. Singh, M. Kumbhakar, H. Pal and S. Nath, Phys. Chem. Chem. Phys., 2011, 13, 8008–8014 RSC.
- A. G. Mwalupindi, A. Rideau, R. A. Agbaria and S. M. Iwarner, Talanta, 1994, 41, 599–609 CrossRef CAS.
- P. K. Singh, M. Kumbhakar, H. Pal and S. Nath, J. Phys. Chem. B, 2010, 114, 2541–2546 Search PubMed.
- M. Maroncelli and G. R. Fleming, J. Chem. Phys., 1987, 86, 6221–6239 Search PubMed.
- U. Aberg, E. Akesson, J. L. Alvarez, I. Fedchenia and V. Sundstrom, Chem. Phys., 1994, 183, 269–288 CrossRef CAS.
- H. Chosrowjan, N. Mataga, N. Nakashima, Y. Imamaoto and F. Tokunaga, Chem. Phys. Lett., 1997, 270, 267–272 CrossRef CAS.
- P. K. Singh, M. Kumbhakar, H. Pal and S. Nath, J. Phys. Chem. B, 2010, 114, 5920–5927 CrossRef CAS PubMed.
- H. Kandori and H. Sasabe, Chem. Phys. Lett., 1993, 216, 126–172 CrossRef CAS.
- A. Yartsev, J. L. Alvarez, U. Aberg and V. Sundstrom, Chem. Phys. Lett., 1995, 243, 281–289 Search PubMed.
- E. T. J. Nibbering and T. Elsaesser, Chem. Rev., 2004, 104, 1887–1914 CrossRef CAS PubMed.
- M. Jana and S. Bandyopadhyay, Langmuir, 2009, 25, 13084–13091 CrossRef CAS PubMed.
- C. D. Bruce, M. L. Berkowitz, L. Perera and M. D. E. Forbes, J. Phys. Chem. B, 2002, 106, 3788–3793 Search PubMed.
- C. D. Bruce, S. Senapati, M. L. Berkowitz, L. Perera and M. D. E. Forbes, J. Phys. Chem. B, 2002, 106, 10902–10907 CrossRef CAS.
- C. Yan, Z. Xiu, X. Li, H. Teng and C. Hao, J. Inclusion Phenom. Macrocyclic Chem., 2007, 58, 337–344 CrossRef CAS.
- V. G. Avakyan, V. B. Nazarov, M. V. Alfimov and A. A. Bagaturyants, Russ. Chem. Bull., 1999, 48, 1833–1834 Search PubMed.
- R. A. Velapoldi and K. D. Mielenz, Standard Reference Materials: A fluorescence standard reference material: Quinine sulfate dihydrate, Nat. Bur. Stand. (US) Spec. Publ., 1980, pp. 260–264 Search PubMed.
- P. K. Singh, S. Nath, A. C. Bhasikuttan, M. Kumbhakar, J. Mohanty, S. K. Sarkar, T. Mukherjee and H. Pal, J. Chem. Phys., 2008, 129, 114504 Search PubMed.
- M. J. Frisch, G. W. Trucks, H. B. Schlegel, et al., Gaussian, Inc., Wallingford, CT, 2004.
Footnote |
| † Electronic supplementary information (ESI) available. See DOI: 10.1039/c4ra03324h |
| This journal is © The Royal Society of Chemistry 2014 |

