Al3+ selective coumarin based reversible chemosensor: application in living cell imaging and as integrated molecular logic gate†
Deblina Sarkara,
Arindam Pramanikb,
Sujan Biswasa,
Parimal Karmakarb and
Tapan Kumar Mondal*a
aDepartment of Chemistry, Jadavpur University, Kolkata-700032, India. E-mail: tkmondal@chemistry.jdvu.ac.in
bDepartment of Life Science and Biotechnology, Jadavpur University, Kolkata-700-032, India. E-mail: pkarmakar_28@yahoo.co.in
First published on 30th June 2014
Abstract
An efficient coumarin based fluorescent ‘turn-on’ receptor (H2L) for the detection of Al3+ has been synthesized following simple Schiff base condensation of 4-hydroxy-3-acetylcoumarin with 2-amino-4-methylphenol. The receptor H2L shows about 21 fold increase in fluorescence intensity upon addition of Al3+ than in the case of other metals. The limit of detection is 0.39 μM. H2L is efficient in detecting Al3+ in the intracellular region of human cervical cancer cells and also exhibits an INHIBIT logic gate with Al3+ and EDTA as chemical inputs by monitoring both the absorption as well as emission mode. Theoretical calculations (DFT and TDDFT) are applied to interpret the sensing mechanism of the synthesized receptor.
Introduction
Aluminium being the third most abundant element in the earth's crust1 has tremendous utility in the food packaging industry, electrical industry, food processing, water purification and clinical drugs, etc.2 However free Al3+ formed from leaching due to acid rain can be fatal to growing plants.3 Al3+ has neurotoxic activities4 and been identified as a major cause of Alzheimer's disease5 and Parkinson's disease.6 Moreover Al3+ is also biologically very toxic causing osteomalacia, breast cancer and also intoxication in haemodialysis patients.7 According to WHO, the permissible weekly intake of Al3+ should not exceed 7 mg Kg−1 body weight.8 Thus detection of Al3+ in environmental and biological samples have gained a lot of importance.9 Among the several detection techniques of Al3+,10 fluorescence technique is popularly used due to its simplicity in operation, high sensitivity, rapidity and non-destructive nature.11 Till date, various ‘turn-on’ fluorescent chemosensors have been reported where the basis fluorophore used are hydrazone, pyrollidine, 8-hydroxyquinoline, oxazoline, imidazoline etc.12 Recently, Goswami et al. reported a molecular switch for Al3+ based on spiropyran platform.13 Very few Al3+ sensor based on coumarin framework has been reported so far but most of them suffer from the problem of cost of starting material, irreversibility, low limit of detection.14 However in our present work we report herein a coumarin based chemosensor for the detection of Al3+ which has excellent selectivity, very low limit of detection and can be synthesized easily using a very economically cheap route. On top of that the developed sensor is reversible i.e. in presence of EDTA the receptor (H2L) gets completely free from H2L–Al3+ complex and hence can be used over again. Gradual addition of Al3+ (10 μM) to the receptor H2L (10 μM) in MeOH–H2O, 1![[thin space (1/6-em)]](https://www.rsc.org/images/entities/char_2009.gif) :
:![[thin space (1/6-em)]](https://www.rsc.org/images/entities/char_2009.gif) 1, v/v (at 25 °C) shows an excellent fluorescence emission intensity enhancement of 21 fold. Again H2L represents an INHIBIT logic gate with Al3+ and EDTA as inputs through both the absorption and emission mode.15 The receptor H2L can also act as Al3+ sensor in living cells. Further theoretical calculation using DFT/B3LYP method has been used to interpret the sensing mechanism as well as electronic structure of the synthesized receptor H2L.
1, v/v (at 25 °C) shows an excellent fluorescence emission intensity enhancement of 21 fold. Again H2L represents an INHIBIT logic gate with Al3+ and EDTA as inputs through both the absorption and emission mode.15 The receptor H2L can also act as Al3+ sensor in living cells. Further theoretical calculation using DFT/B3LYP method has been used to interpret the sensing mechanism as well as electronic structure of the synthesized receptor H2L.
Results and discussion
Synthesis and spectral characterisation
Synthetic route towards H2L involves a very facile and economically cheap route using Schiff base condensation of 3-acetyl-4-hydroxycoumarin with 2-amino-4-methylphenol in 1![[thin space (1/6-em)]](https://www.rsc.org/images/entities/char_2009.gif) :
:![[thin space (1/6-em)]](https://www.rsc.org/images/entities/char_2009.gif) 1 molar ratio in methanolic medium under refluxing condition (Scheme 1).
1 molar ratio in methanolic medium under refluxing condition (Scheme 1).
IR spectrum taken in KBr disk shows stretching at 1710 cm−1 corresponding to lactone C![[double bond, length as m-dash]](https://www.rsc.org/images/entities/char_e001.gif) O, the keto C
O, the keto C![[double bond, length as m-dash]](https://www.rsc.org/images/entities/char_e001.gif) O and C
O and C![[double bond, length as m-dash]](https://www.rsc.org/images/entities/char_e001.gif) C appears at 1619 cm−1 and 1571 cm−1 respectively. 1H NMR spectra are recorded in CDCl3 which shows band at around δ 15.43 which is due to the hydrogen bonded NH proton (Fig. S1†). This peak vanishes in the H2L–Al3+ complex indicating co-ordination to the metal centre through N donating site in the enol form. The aromatic protons in H2L appear as expected in the region δ 8.06–6.90. The –OH proton appears as a singlet at δ 5.95. The –COCH3 protons appear at δ 2.65 as singlet and the Ph-CH3 appear at δ 2.32. In the H2L–Al3+ complex the –OH peak also vanishes indicating co-ordination to Al3+ using O centre (Fig. S1†). All aromatic protons appear at a bit downfield position compared to that of H2L, which can be clearly explained due to the co-ordination of Al3+ with H2L. Mass spectrum shows m/z peak corresponding to Na+[H2L] at 332.1 along with a peak at 310.1 corresponding to H+[H2L] for H2L (Fig. S2†). For H2L–Al3+ complex the strong peak at 419.3 correspond to Na[Al(L-2H)NO3]+ along with a weak peak at 437.3 corresponding to Na+[Al(L-2H)(NO3)(H2O)] species (Fig. S3†) supporting 1
C appears at 1619 cm−1 and 1571 cm−1 respectively. 1H NMR spectra are recorded in CDCl3 which shows band at around δ 15.43 which is due to the hydrogen bonded NH proton (Fig. S1†). This peak vanishes in the H2L–Al3+ complex indicating co-ordination to the metal centre through N donating site in the enol form. The aromatic protons in H2L appear as expected in the region δ 8.06–6.90. The –OH proton appears as a singlet at δ 5.95. The –COCH3 protons appear at δ 2.65 as singlet and the Ph-CH3 appear at δ 2.32. In the H2L–Al3+ complex the –OH peak also vanishes indicating co-ordination to Al3+ using O centre (Fig. S1†). All aromatic protons appear at a bit downfield position compared to that of H2L, which can be clearly explained due to the co-ordination of Al3+ with H2L. Mass spectrum shows m/z peak corresponding to Na+[H2L] at 332.1 along with a peak at 310.1 corresponding to H+[H2L] for H2L (Fig. S2†). For H2L–Al3+ complex the strong peak at 419.3 correspond to Na[Al(L-2H)NO3]+ along with a weak peak at 437.3 corresponding to Na+[Al(L-2H)(NO3)(H2O)] species (Fig. S3†) supporting 1![[thin space (1/6-em)]](https://www.rsc.org/images/entities/char_2009.gif) :
:![[thin space (1/6-em)]](https://www.rsc.org/images/entities/char_2009.gif) 1 complex formation.
1 complex formation.
Cation sensing studies of H2L
![[thin space (1/6-em)]](https://www.rsc.org/images/entities/char_2009.gif) :
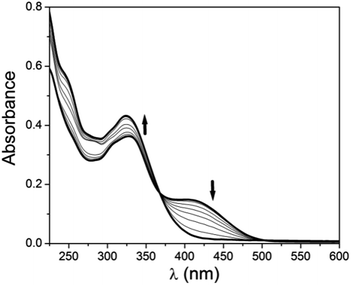
:![[thin space (1/6-em)]](https://www.rsc.org/images/entities/char_2009.gif) 1, v/v MeOH–H2O using HEPES buffered solution at pH = 7.2. Gradual addition of Al3+ (10 μM) shows a slight red shift of this band to 330 nm and a new band appears at 414 nm. Distinct isosbestic point appears at 369 nm (Fig. 1). This formation of new band at 414 nm indicates the co-ordination of the receptor to Al3+. Interestingly when to this solution 10 μM EDTA solution is gradually added the band at 414 nm again gets depressed with the formation of new band at 326 nm (Fig. 2). This clearly indicates that the synthesized receptor H2L shows reversibility in binding with Al3+. In presence of EDTA, Al3+ gets free from the receptor, thus it can again be used for the detection of Al3+. UV-Vis spectrum of H2L is also studied in presence of other metals i.e. Na+, K+, Ca2+, Mg2+, Mn2+, Fe3+, Cr3+, Co2+, Ni2+, Cu2+, Cd2+ and Hg2+ but no significant changes are observed except for Zn2+ and Cu2+ (Fig. S4†). The change in colour of H2L in presence of Al3+ compared to other metals is also visible under naked eye (Fig. S5†).
1, v/v MeOH–H2O using HEPES buffered solution at pH = 7.2. Gradual addition of Al3+ (10 μM) shows a slight red shift of this band to 330 nm and a new band appears at 414 nm. Distinct isosbestic point appears at 369 nm (Fig. 1). This formation of new band at 414 nm indicates the co-ordination of the receptor to Al3+. Interestingly when to this solution 10 μM EDTA solution is gradually added the band at 414 nm again gets depressed with the formation of new band at 326 nm (Fig. 2). This clearly indicates that the synthesized receptor H2L shows reversibility in binding with Al3+. In presence of EDTA, Al3+ gets free from the receptor, thus it can again be used for the detection of Al3+. UV-Vis spectrum of H2L is also studied in presence of other metals i.e. Na+, K+, Ca2+, Mg2+, Mn2+, Fe3+, Cr3+, Co2+, Ni2+, Cu2+, Cd2+ and Hg2+ but no significant changes are observed except for Zn2+ and Cu2+ (Fig. S4†). The change in colour of H2L in presence of Al3+ compared to other metals is also visible under naked eye (Fig. S5†).
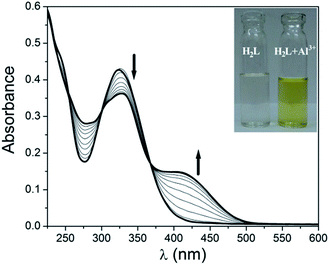 | ||
Fig. 1 Change in UV-Vis spectrum of H2L (10 μM) upon gradual addition of 10 μM Al3+ in 1![[thin space (1/6-em)]](https://www.rsc.org/images/entities/char_2009.gif) : :![[thin space (1/6-em)]](https://www.rsc.org/images/entities/char_2009.gif) 1, v/v MeOH–H2O. Inset shows the visual effect of addition of Al3+ to H2L in ambient light. 1, v/v MeOH–H2O. Inset shows the visual effect of addition of Al3+ to H2L in ambient light. | ||
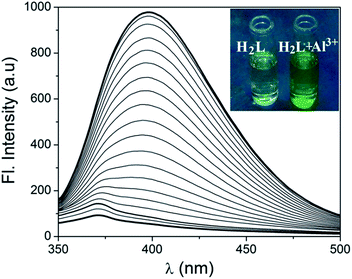 | ||
Fig. 3 Change in emission spectrum of H2L (10 μM) upon gradual addition of 10 μM Al3+ 1![[thin space (1/6-em)]](https://www.rsc.org/images/entities/char_2009.gif) : :![[thin space (1/6-em)]](https://www.rsc.org/images/entities/char_2009.gif) 1, v/v MeOH–H2O. Inset shows the visual effect of addition of Al3+ to H2L under UV light. 1, v/v MeOH–H2O. Inset shows the visual effect of addition of Al3+ to H2L under UV light. | ||
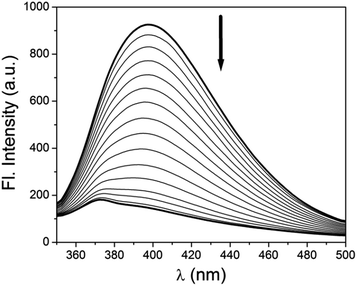 | ||
Fig. 4 Change in emission spectrum of H2L–Al3+ (10 μM) upon gradual addition of EDTA (10 μM) in 1![[thin space (1/6-em)]](https://www.rsc.org/images/entities/char_2009.gif) : :![[thin space (1/6-em)]](https://www.rsc.org/images/entities/char_2009.gif) 1, v/v MeOH–H2O. 1, v/v MeOH–H2O. | ||
Jobs plot of emission intensity shows a maxima in the plot corresponds to ∼0.5 mole fraction indicating 1![[thin space (1/6-em)]](https://www.rsc.org/images/entities/char_2009.gif) :
:![[thin space (1/6-em)]](https://www.rsc.org/images/entities/char_2009.gif) 1 complex formation of H2L with Al3+ (Fig. S6†). From emission spectral change, limit of detection of the chemosensor for Al3+ is determined using the equation LOD = K × SD/S where SD is the standard deviation of the blank solution and S in the slope of the calibration curve (Fig. S7†). The limit of detection for Al3+ is 0.393 μM from fluorescent spectral titration. This result clearly demonstrates that the chemosensor is highly efficient in sensing Al3+ even in very minute level. From fluorescent spectral titration the association constant of H2L with Al3+ is found to be 4.8 × 10⁵ and stoichiometry of the reaction n = 1.17 indicating 1
1 complex formation of H2L with Al3+ (Fig. S6†). From emission spectral change, limit of detection of the chemosensor for Al3+ is determined using the equation LOD = K × SD/S where SD is the standard deviation of the blank solution and S in the slope of the calibration curve (Fig. S7†). The limit of detection for Al3+ is 0.393 μM from fluorescent spectral titration. This result clearly demonstrates that the chemosensor is highly efficient in sensing Al3+ even in very minute level. From fluorescent spectral titration the association constant of H2L with Al3+ is found to be 4.8 × 10⁵ and stoichiometry of the reaction n = 1.17 indicating 1![[thin space (1/6-em)]](https://www.rsc.org/images/entities/char_2009.gif) :
:![[thin space (1/6-em)]](https://www.rsc.org/images/entities/char_2009.gif) 1 complex formation (Fig. S8†).
1 complex formation (Fig. S8†).
Fluorescence emission intensity of H2L (10 μM) is studied in presence of other metals i.e. Na+, K+, Ca2+, Mg2+, Mn2+, Fe3+, Cr3+, Co2+, Ni2+, Cu2+, Cd2+ and Hg2+ (10 μM) in MeOH–H2O (1![[thin space (1/6-em)]](https://www.rsc.org/images/entities/char_2009.gif) :
:![[thin space (1/6-em)]](https://www.rsc.org/images/entities/char_2009.gif) 1, v/v, pH = 7.2) but there is hardly any increase in emission intensity of H2L (Fig. 5). Then to these solutions Al3+ is added which then shows an obvious fluorescent enhancement (Fig. S9†). Thus the synthesized receptor H2L is highly efficient in detection of Al3+ even in presence of other metals and thus it can detect Al3+ in biological or environmental samples where other metals usually co-exist with Al3+.
1, v/v, pH = 7.2) but there is hardly any increase in emission intensity of H2L (Fig. 5). Then to these solutions Al3+ is added which then shows an obvious fluorescent enhancement (Fig. S9†). Thus the synthesized receptor H2L is highly efficient in detection of Al3+ even in presence of other metals and thus it can detect Al3+ in biological or environmental samples where other metals usually co-exist with Al3+.
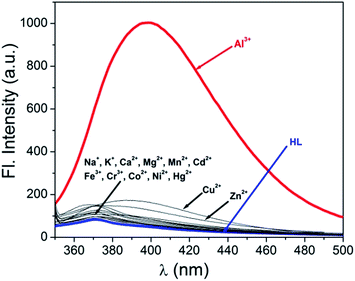 | ||
Fig. 5 Change in emission spectrum of H2L (10 μM) upon addition of Na+, K+, Ca2+, Mg2+, Mn2+, Fe3+, Cr3+, Al3+, Co2+, Ni2+, Cu2+, Cd2+ and Hg2+ (10 μM) in MeOH–H2O (1![[thin space (1/6-em)]](https://www.rsc.org/images/entities/char_2009.gif) : :![[thin space (1/6-em)]](https://www.rsc.org/images/entities/char_2009.gif) 1, v/v, pH = 7.2). 1, v/v, pH = 7.2). | ||
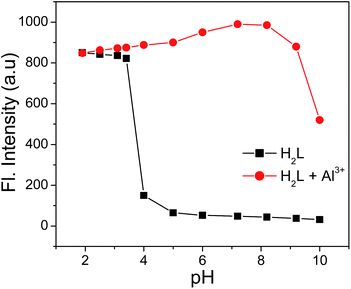
The effect of pH on the emission intensity of the receptor (H2L) in absence and presence of Al3+ is studied. In case of H2L there is hardly any change in fluorescence intensity in the pH range 5–10 (Fig. 6). Below pH 5 sharp increase in fluorescence intensity is observed due to protonation of imine N and hydroxy O atoms preventing the excited state intramolecular proton transfer (ESIPT) process, which is responsible for the quenching of fluorescence intensity.16 On addition of 1.2 equivalents of Al3+ the fluorescence intensity remains almost unchanged in the pH < 4, while there is a sharp increase in fluorescence intensity in the pH range 5–8. But, on further increase in pH fluorescence intensity drops drastically due to the formation of Al(OH)3 at pH > 8. Thus the receptor (H2L) is efficient in detection of Al3+ in the biologically relevant pH range (6.0–7). However at low pH values (pH < 4) receptor tends to combine with protons and hence becomes ineffective in detection of Al3+.
Electronic structure and sensing mechanism
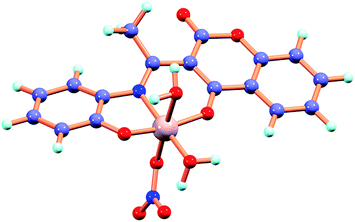
To interpret the electronic structure of H2L geometry optimization has been performed by DFT/B3LYP method in singlet ground state (S0) and first excited state (S1) by TDDFT/B3LYP method. The potential energy scans (Fig. S10†) in S0 state reveals that the keto form is more stable by an amount of energy of 7.308 kcal mol−1 than the corresponding enol form which is consistent with the X-ray structure of this type of molecules.17 The geometry of H2L–Al3+ has been optimized and the energy minimized structures are shown in Fig. 7. In the complex the chemosensor H2L binds to Al3+ through two phenolic-O atoms and imine-N. In an octahedral geometric environment other three coordination site are satisfied by NO3− and two water molecules and the proposed geometry is supported by mass spectral analysis of H2L–Al3+ complex. Contour plot of selected molecular orbitals of H2L and its complex with Al3+ are given in Fig. S11 and S12† respectively. The HOMO–LUMO gap of H2L is significantly decreased from 4.17 eV to 2.82 eV in Al3+ complex.To interpret the changes in electronic spectra TDDFT calculation by DFT/B3LYP method has been carried out in MeOH. The intense band at 326 nm for chemosensor H2L corresponds to HOMO → LUMO transition (Table 1). The new band at 414 nm along with peak at 330 nm for Al3+ complex correspond to HOMO → LUMO and HOMO-1 → LUMO transitions respectively.
| Compds. | Excitation | λexcitation (nm) | Oscillator strength (f) | λexpt. (nm) |
|---|---|---|---|---|
| H2L | HOMO → LUMO | 353 | 0.3188 | 326 |
| H2L–Al3+ | HOMO → LUMO | 430 | 0.3151 | 414 |
| HOMO-1 → LUMO | 343 | 0.3139 | 330 |
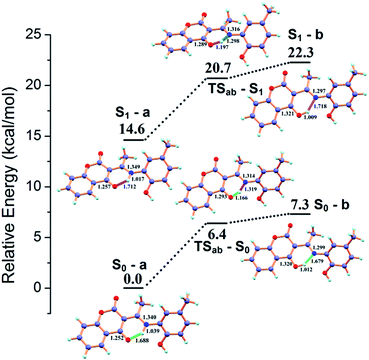
In the absence of Al3+, H2L shows a weak emission band centered around 371 nm. Upon gradual addition of Al3+, the receptor H2L shows an excellent fluorescence intensity enhancement of 21 fold and a new emission band appears at 398 nm. To interpret whether the excited state intramolecular proton transfer (ESIPT)16 is responsible for the quenching of fluorescence intensity for H2L, theoretical calculations are carried out. The possible intramolecular proton transfer process both in ground (S0) and excited (S1) state have been considered (Fig. 8). The energy difference between S0 and S1 states is only 14.63 kcal mol−1 and the hydrogen transfer can proceed very easily both in ground and excited state with a energy barrier of 6.42 and 6.10 kcal mol−1 respectively. Thus DFT calculations suggest that H2L exists in the form of S0-a and S1-a in the ground- and excited state respectively. The hydrogen transfer takes place easily both in ground and excited state resulting in quenching of fluorescence for H2L. On coordination with Al3+ this ESIPT process is inhibited resulting in fluorescence intensity enhancement.
Application as logic function
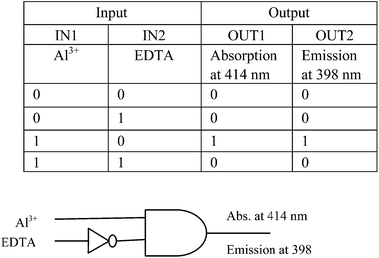
Arithmetic operations performed by several combination of logic gates are widely implemented in semiconductor technology18 as well as for computation in nano scale level.19 Several molecular function systems20 are reported recently. Now molecular logic function was studied with our synthesized chemosensor H2L along with Al3+ as well as the chelating agent EDTA as inputs. As discussed earlier absorption band at 414 nm emerged in presence of Al3+ and again in presence of EDTA the absorption band at 414 nm decreased along with decrease in emission band at 398 nm. Thus with two inputs as Al3+ and EDTA, H2L has the ability to exhibit INHIBIT function via both absorption as well as emission output. Only when Al3+ is present the absorption as well as emission at 414 nm and 398 nm respectively is 1 while the values of all other functions are 0. Actually it represents an AND gate with an inverter21 in one of its input. Thus the absorption change at 414 nm and emission change at 398 nm with Al3+ as well as EDTA as inputs can be interpretated as a monomolecular circuit showing an INHIBIT logic function (Fig. 9).Biological application study
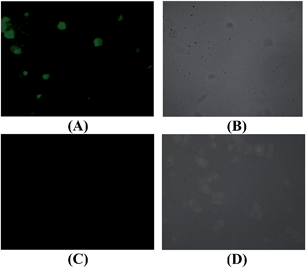
To explore the biological application of the synthesized receptor H2L, Human cancer cell line HeLa are treated with the receptor and receptor–Al3+ complex separately for 24 h. The cells are able to take up both the receptor as well as Al3+. The cells treated with ligand at a dose of 10 μM have a slight green fluorescence at a range of 370 nm. This clearly indicates that the receptor has some autofluorogenic properties when applied to biological systems. Upon addition of equimolar Al3+ (10 μM), increase in intensity of fluorescence emission is observed (Fig. 10). Thus the synthesized receptor H2L has the potential for live cell imaging and can be used in detection of Al3+ in the intracellular region.HeLa cells are treated with Al3+, H2L and H2L–Al3+ complex at various concentrations (5 μM–80 μM). But it is observed that H2L has slight effect on survivability of cells at higher dosage (40 μM) (Fig. 11).
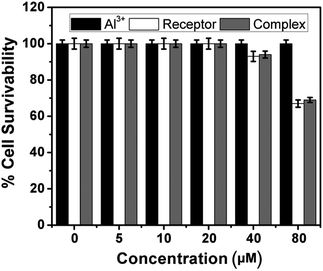 | ||
| Fig. 11 MTT assay of Al3+, H2L and H2L–Al3+ complex on HeLa cells. (p > 0.05 as compared with respective controls). | ||
Experimental
Material and methods
4-Hydroxycoumarin and 2-amino-4-methylphenol were purchased from Aldrich. All other organic chemicals and inorganic salts were available from commercial suppliers and used without further purification.Elemental analysis was carried out in a 2400 Series-II CHN analyzer, Perkin Elmer, USA. HRMS mass spectra were recorded on Waters (Xevo G2 Q-TOF) mass spectrometer. Infrared spectra were taken on a RX-1 Perkin Elmer spectrophotometer with samples prepared as KBr pellets. Electronic spectral studies were performed on a Perkin Elmer Lambda 25 spectrophotometer. Luminescence property was measured using Perkin Elmer LS 55 fluorescence spectrophotometer at room temperature (298 K). NMR spectra were recorded using a Bruker (AC) 300 MHz FTNMR spectrometer in CDCl3.
The luminescence quantum yield was determined using carbazole as reference with a known ϕR of 0.42 in MeCN. The complex and the reference dye were excited at the same wavelength, maintaining nearly equal absorbance (∼0.1), and the emission spectra were recorded. The area of the emission spectrum was integrated using the software available in the instrument and the quantum yield is calculated according to the following equation:
| ϕS/ϕR = [AS/AR] × [(Abs)R/(Abs)S] × [ηS2/ηR2]. |
Here, ϕS and ϕR are the luminescence quantum yield of the sample and reference, respectively. AS and AR are the area under the emission spectra of the sample and the reference respectively.
(Abs)S and (Abs)R are the respective optical densities of the sample and the reference solution at the wavelength of excitation, and ηS and ηR are the values of refractive index for the respective solvent used for the sample and reference.
Synthesis of 3-(1-(2-hydroxy-5-methylphenylimino) ethyl)-4-hydroxy-2H-chromen-2-one (H2L)
3-Acetyl-4-hydroxy-2H-chromen-2-one (L)22 (0.184 g, 0.9 mmol) and 2-amino-4-methylphenol (0.111 g, 0.9 mmol) were refluxed for 6 hours in methanolic medium. Excess solvent was evaporated under reduced pressure and then dissolved in dichoromethane which is then further subjected to silica gel (60–120 mesh) column chromatographic separation. The desired light yellow solid product was obtained by elution with 20% ethylacetate–petether (v/v) mixture. Yield was, 0.243 g, 88%.Anal. Calc. for C18H15NO4 (H2L): calc. (%) C 6.89, H 4.89, N 4.53. Found (%), C 6.97, H 4.91, N 4.51. IR data (KBr, cm−1): 1710 ν(lactone C![[double bond, length as m-dash]](https://www.rsc.org/images/entities/char_e001.gif) O); 1619 ν(keto C
O); 1619 ν(keto C![[double bond, length as m-dash]](https://www.rsc.org/images/entities/char_e001.gif) O), 1571 ν(C
O), 1571 ν(C![[double bond, length as m-dash]](https://www.rsc.org/images/entities/char_e001.gif) C). 1H NMR data (CDCl3, 300 MHz): δ 15.44 (1H, s), 8.05 (1H, d, J = 7.5 Hz), 7.57 (1H, t, J= 7.1 Hz), 7.24–7.21 (2H, m), 7.09(1H, d, J = 8.27 Hz), 6.94–6.90 (2H, m), 5.95 (1H, s), 2.65 (3H, s), 2.51 (3H, s).
C). 1H NMR data (CDCl3, 300 MHz): δ 15.44 (1H, s), 8.05 (1H, d, J = 7.5 Hz), 7.57 (1H, t, J= 7.1 Hz), 7.24–7.21 (2H, m), 7.09(1H, d, J = 8.27 Hz), 6.94–6.90 (2H, m), 5.95 (1H, s), 2.65 (3H, s), 2.51 (3H, s).
General method for UV-Vis and fluorescence titration
Stock solution of the receptor H2L (10 μM) in [(MeOH–H2O), 1![[thin space (1/6-em)]](https://www.rsc.org/images/entities/char_2009.gif) :
:![[thin space (1/6-em)]](https://www.rsc.org/images/entities/char_2009.gif) 1, v/v] (at 25 °C) using HEPES buffered solution at pH = 7.2 was prepared. The solution of the guest cations using their chloride salts in the order of 100 μM were prepared in deionized water. Solutions of various concentrations containing host and increasing concentrations of cations were prepared separately. The spectra of these solutions were recorded by means of UV-Vis methods. EDTA solution of 100 μM was added to the same solution where Al3+ was added gradually to H2L and UV spectra recorded. The spectra of all these solutions were also recorded by means of fluorescence methods.
1, v/v] (at 25 °C) using HEPES buffered solution at pH = 7.2 was prepared. The solution of the guest cations using their chloride salts in the order of 100 μM were prepared in deionized water. Solutions of various concentrations containing host and increasing concentrations of cations were prepared separately. The spectra of these solutions were recorded by means of UV-Vis methods. EDTA solution of 100 μM was added to the same solution where Al3+ was added gradually to H2L and UV spectra recorded. The spectra of all these solutions were also recorded by means of fluorescence methods.
Job's plot by fluorescence method
A series of solutions containing H2L (10 μM) and Al(NO3)3 (10 μM) were prepared in such a manner that the sum of the total metal ion and H2L volume remained constant (4 mL). MeOH–H2O (1![[thin space (1/6-em)]](https://www.rsc.org/images/entities/char_2009.gif) :
:![[thin space (1/6-em)]](https://www.rsc.org/images/entities/char_2009.gif) 1, v/v) was used as solvent at pH 7.2 using HEPES buffer. Job's plots were drawn by plotting ΔF versus mole fraction of Al3+ [ΔF = change of intensity of the emission spectrum at 398 nm (for Al3+) during titration and Xg is the mole fraction of the guest in each case].
1, v/v) was used as solvent at pH 7.2 using HEPES buffer. Job's plots were drawn by plotting ΔF versus mole fraction of Al3+ [ΔF = change of intensity of the emission spectrum at 398 nm (for Al3+) during titration and Xg is the mole fraction of the guest in each case].
In vitro cell imaging
Computational method
All calculations were carried out at the B3LYP24 level using Gaussian 09 software.25 The 6-311G(d) basis set was assigned for the elements. All the ground state (S0) stationary points were fully optimized at the B3LYP/6-311G(d) and the excited states at TD-B3LYP/6-311G(d) method.26,27 Vertical electronic excitations based on B3LYP optimized geometries were computed using the time-dependent density functional theory (TDDFT) formalism28 in methanol using conductor-like polarizable continuum model (CPCM).29Conclusions
Thus we have successfully developed a new coumarin based reversible chemosensor for the selective detection of Al3+ over other metal ions. Fluorescence intensity enhancement of 21 fold upon addition of 10 μM Al3+ to H2L (10 μM) is observed. More importantly the developed chemosensor can also detect Al3+ in the intracellular region of human cervical cancer cells. H2L can also function as an INHIBIT logic gate with Al3+ and EDTA as inputs.Acknowledgements
Financial supports received from the Department of Science and Technology, New Delhi, India is gratefully acknowledged. D. Sarkar is thankful to CSIR, New Delhi, India, S. Biswas is thankful to UGC, New Delhi for fellowship. A. Pramanik is thankful to DBT, India for his fellowship.Notes and references
- W. S. Miller, L. Zhuang, J. Bottema, A. J. Wittebrood, P. De Smet, A. Haszler and A. Vieregge, Mater. Sci. Eng., A, 2000, 280, 37 CrossRef CAS; R. E. Doherty, Environ. Forensics, 2000, 1, 83 CrossRef; G. Ciardelli and N. Ranieri, Water Res., 2001, 35, 567 CrossRef.
- M. G. Sont, S. M. White, W. G. Flamm and G. A. Burdock, Regul. Toxicol. Pharmacol., 2001, 33, 66 CrossRef PubMed; N. W. Bavlor, W. Egan and P. Richman, Vaccine, 2002, 20, S18 CrossRef; J. Exley, J. Inorg. Biochem., 2005, 99, 1747 CrossRef PubMed.
- E. Delhaize and P. R. Ryan, Plant Physiol., 1995, 107, 315 CAS.
- D. R. Crapper McLachlan, W. J. Lukiw and T. P. A. Kruck, Environ. Geochem. Health, 1990, 12, 103 CrossRef CAS PubMed.
- T. P. Flaten, Brain Res. Bull., 2001, 55, 187 CrossRef CAS; J. R. Walton, Curr. Inorg. Chem., 2012, 2, 19 CrossRef.
- J. R. Walton, NeuroToxicology, 2006, 27, 385 CrossRef CAS PubMed.
- G. C. Woodson, Bone, 1998, 22, 695 CrossRef CAS; P. D. Darbre, J. Inorg. Biochem., 2005, 99, 1912 CrossRef PubMed; G. D. Fasman, Coord. Chem. Rev., 1996, 149, 125 CrossRef.
- B. Valeur and I. Leray, Coord. Chem. Rev., 2000, 205, 3 CrossRef CAS.
- Y. Kawanishi, K. Kikuchi, H. Takakusa, S. Mizukami, Y. Urano, T. Higuchi and T. Nagano, Angew. Chem., Int. Ed., 2000, 112, 3580 CrossRef CAS; S. Deo and H. A. Godwin, J. Am. Chem. Soc., 2000, 122, 174 CrossRef; Z. Rengel and W. H. Zhang, New Phytol., 2003, 159, 295 CrossRef; E. Àlvarez, M. L. Fernández-Marcos, C. Monterroso and M. J. Fernández-Sanjurjo, For. Ecol. Manage., 2005, 211, 227 CrossRef PubMed.
- M. Ahmad and R. Narayanaswamy, Talanta, 1995, 42, 1337 CrossRef CAS; S. Saito, J.-I. Shimidzu, K. Yoshimoto, M. Maeda and M. Aoyama, J. Chromatogr., A, 2007, 1140, 230 CrossRef PubMed; S. Murko, R. Milačič and J. Ščančar, J. Inorg. Biochem., 2007, 101, 1234 CrossRef PubMed.
- D. T. Quang and J. S. Kim, Chem. Rev., 2010, 110, 6280 CrossRef CAS PubMed; H. Kobayashi, M. Ogawa, R. Alford, P. L. Choyke and Y. Urano, Chem. Rev., 2010, 110, 2620 CrossRef PubMed.
- M. P. Manuel-Vez and M. Garcia-Vargas, Talanta, 1994, 41, 1553 CrossRef CAS; D. Maity and T. Govindaraju, Chem. Commun., 2010, 46, 4499 RSC; Y. Zhao, Z. Lin, H. Liao, C. Duan and Q. Meng, Inorg. Chem. Commun., 2006, 9, 966 CrossRef PubMed; A. Jeanson and V. Bereau, Inorg. Chem. Commun., 2006, 9, 13 CrossRef PubMed; R. Patil, A. Moirangthem, R. Butcher, N. Singh, A. Basu, K. Tayade, U. Fegade, D. Hundiwale and A. Kuwar, Dalton Trans., 2014, 2895 RSC.
- S. Goswami, K. Aich, S. Das, A. K. Das, D. Sarkar, S. Panja, T. K. Mondal and S. Mukhopadhyay, Chem. Commun., 2013, 49, 10739 RSC.
- M. Arduini, F. Felluga, F. Mancin, P. Rossi, P. Tecilla, U. Tonellato and N. Valentinuzzi, Chem. Commun., 2003, 1606 RSC; S. Guha, S. Lohar, A. Sahana, A. Banerjee, D. A. Safin, M. G. Babashkina, M. P. Mitoraj, M. Bolte, Y. Garcia, S. K. Mukhopadhyay and D. Das, Dalton Trans., 2013, 10198 RSC.
- S. Wang, G. Men, L. Zhao, Q. Hou and S. Jiang, Sens. Actuators, B, 2010, 145, 826 CrossRef CAS PubMed.
- A. J. Moghadam, R. Omidyan, V. Mirkhani and G. Azimi, J. Phys. Chem. A, 2013, 117, 718 CrossRef CAS PubMed; Z. Wang, D. M. Friedrich, C. C. Ainsworth, S. L. Hemmer, A. G. Joly and M. R. Beversluis, J. Phys. Chem. A, 2001, 105, 942 CrossRef; I. Presiado, Y. Erez, R. Gepshtein and D. Huppert, J. Phys. Chem. C, 2010, 114, 3634 Search PubMed; F. Wua, L. Ma, S. Zhanga, Y. Genga, J. Lüa and X. Chenga, Chem. Phys. Lett., 2012, 519–520, 141 CrossRef PubMed.
- A. Brahmia, T. B. Ayed and R. B. Hassen, Acta Crystallogr., Sect. E: Struct. Rep. Online, 2013, 69, o1296 CAS; T. Shibahara, M. Takahashi, A. Maekawa and H. Takagi, Acta Crystallogr., Sect. E: Struct. Rep. Online, 2010, 66, o429 Search PubMed.
- M. L. P. Tan, H. C. Chin, L. L. Lim, W. S. Wong, E. L. M. Su and C. F. Yeong, Sci. Adv. Mater., 2014, 6, 569 CrossRef CAS PubMed; Y. Ha, K. Everaerts, M. C. Hersam and T. J. Marks, Acc. Chem. Res., 2014, 47, 1019 CrossRef PubMed.
- G. Jiang, Y. Song, X. Guo, D. Zhang and D. Zhu, Adv. Mater., 2008, 20, 2888 CrossRef CAS; S. K. Garai, Opt. Commun., 2014, 313, 441 CrossRef PubMed; J. Zhang, R. Laflamme and D. Suter, Phys. Rev. Lett., 2012, 109, 100503 CrossRef.
- W. Zhou, J. Li, X. He, C. Li, J. Lv, Y. Li, S. Wang, H. Liu and D. Zhu, Chem.–Eur. J., 2008, 14, 754 CrossRef CAS PubMed; D. Zhang, Q. Zhang, J. Su and H. Tian, Chem. Commun., 2009, 1700 RSC; G. Zong and G. Lu, Chin. J. Chem., 2009, 67, 157 Search PubMed.
- A. P. de Silva and N. D. McClenaghan, Chem.–Eur. J, 2002, 8, 4935 CrossRef CAS; M. Ikeda, T. Tanida, T. Yoshii, K. Kurotani, S. Onogi, K. Urayama and I. Hamachi, Nat. Chem., 2014, 6, 511 CrossRef PubMed; Y. Fu, Q. Feng, X. Jiang, H. Xu, M. Li and S. Zang, Dalton Trans., 2014, 43, 5815 RSC; D. C. Magri, M. C. Fava and C. J. Mallia, Chem. Commun., 2014, 50, 1009 RSC; S. Wang, G. Men, L. Zhao, Q. Hou and S. Jiang, Sens. Actuators, B, 2010, 145, 826 CrossRef PubMed.
- N. Hamdi, C. Fischmeister, M. C. Puerta and P. Valerga, Med. Chem. Res., 2011, 20, 522 CrossRef CAS.
- L. Shi, C. Tang and C. Yin, Biomaterials, 2012, 33, 7594 CrossRef CAS PubMed.
- A. D. Becke, J. Chem. Phys., 1993, 98, 5648 CrossRef CAS PubMed; C. Lee, W. Yang and R. G. Parr, Phys. Rev. B: Condens. Matter Mater. Phys., 1988, 37, 785 CrossRef; D. Andrae, U. Haeussermann, M. Dolg, H. Stoll and H. Preuss, Theor. Chim. Acta, 1990, 77, 123 CrossRef.
- M. J. Frisch, G. W. Trucks, H. B. Schlegel, G. E. Scuseria, M. A. Robb, J. R. Cheeseman, G. Scalmani, V. Barone, B. Mennucci, G. A. Petersson, H. Nakatsuji, M. Caricato, X. Li, H. P. Hratchian, A. F. Izmaylov, J. Bloino, G. Zheng, J. L. Sonnenberg, M. Hada, M. Ehara, K. Toyota, R. Fukuda, J. Hasegawa, M. Ishida, T. Nakajima, Y. Honda, O. Kitao, H. Nakai, T. Vreven, J. A. Montgomery, Jr, J. E. Peralta, F. Ogliaro, M. Bearpark, J. J. Heyd, E. Brothers, K. N. Kudin, V. N. Staroverov, R. Kobayashi, J. Normand, K. Raghavachari, A. Rendell, J. C. Burant, S. S. Iyengar, J. Tomasi, M. Cossi, N. Rega, J. M. Millam, M. Klene, J. E. Knox, J. B. Cross, V. Bakken, C. Adamo, J. Jaramillo, R. Gomperts, R. E. Stratmann, O. Yazyev, A. J. Austin, R. Cammi, C. Pomelli, J. W. Ochterski, R. L. Martin, K. Morokuma, V. G. Zakrzewski, G. A. Voth, P. Salvador, J. J. Dannenberg, S. Dapprich, A. D. Daniels, Ö. Farkas, J. B. Foresman, J. V. Ortiz, J. Cioslowski, and D. J. Fox, Gaussian 09, Revision D.01, Gaussian, Inc., Wallingford, CT, 2009 Search PubMed.
- F. Furche and R. Ahlrichs, J. Chem. Phys., 2002, 117, 7433 CrossRef CAS PubMed.
- G. Scalmani, M. J. Frisch, B. Mennucci, J. Tomasi, R. Cammi and V. Barone, J. Chem. Phys., 2006, 124, 1s CrossRef PubMed.
- R. Bauernschmitt and R. Ahlrichs, Chem. Phys. Lett., 1996, 256, 454 CrossRef CAS; R. E. Stratmann, G. E. Scuseria and M. J. Frisch, J. Chem. Phys., 1998, 109, 8218 CrossRef PubMed; M. E. Casida, C. Jamorski, K. C. Casida and D. R. Salahub, J. Chem. Phys., 1998, 108, 4439 CrossRef PubMed.
- V. Barone and M. Cossi, J. Phys. Chem. A, 1998, 102, 1995 CrossRef CAS; M. Cossi and V. Barone, J. Chem. Phys., 2001, 115, 4708 CrossRef PubMed; M. Cossi, N. Rega, G. Scalmani and V. Barone, J. Comput. Chem., 2003, 24, 669 CrossRef PubMed.
Footnote |
| † Electronic supplementary information (ESI) available: Association constant determination, detection limit determination, 1H NMR, HRMS, UV-Vis titration spectra of HL with different metal ions etc. See DOI: 10.1039/c4ra04318a |
| This journal is © The Royal Society of Chemistry 2014 |


