
Fragment based electronic structural analysis of L-phenylalanine using calculated ionization spectroscopy and dual space analysis†
Feng Wang* and
Aravindhan Ganesan‡
*
Molecular Model Discovery Laboratory, Department of Chemistry and Biotechnology, Faculty of Sciences, Engineering and Technology, Swinburne University of Technology, Hawthorn, Melbourne, Victoria 3122, Australia. E-mail: fwang@swin.edu.au; aganesan@daad-alumni.de
First published on 5th November 2014
Abstract
Two sets of amino acid-containing fragment schemes, the alanine/benzene scheme and the glycine/toluene scheme, are employed to study the electronic structure of an aromatic amino acid, L-phenylalanine (Phe). The calculated ionization energies (IEs) and the theoretical momentum distributions (TMDs) of the valence orbitals for the related molecules are analyzed to reveal the intra-molecular interactions through the fragments-in-molecules scheme. Density functional theory (DFT) based and Green function based quantum mechanical calculations as well as available experimental measurements are used in this study. It is found that the strong chemical bonding character of Phe seems to appear in the middle valence region of 11–20 eV, which largely shows the dependency of the fragment schemes. The valence energy region of 14 < IE < 20 eV in Phe is dominated by the glycine/toluene scheme, whereas the valence space of 11 < IE < 14 eV is dominated by the alanine/benzene scheme. The innermost valence space (i.e. IE > 20 eV) and the outermost valence space (i.e. the frontier orbitals) are less affected by the fragment schemes. These observations are confirmed using combined information on the position and momentum spaces in dual space analysis (DSA).
Introduction
L-Phenylalanine (Phe), an essential aromatic amino acid, exhibits a multitude of bio-functional roles and receives significant attention in both theoretical and experimental studies.1–20 Like other amino acids, Phe takes a neutral structure in the gas phase presenting a number of low energy conformers.7,10,16,21,22 However, with the presence of even a few water molecules, Phe takes a zwitterion form.21,23–25 In its chemical structure as shown in Fig. 1, Phe consists of three different functional groups, i.e., a carboxyl (–COOH), an amino (–NH2) and a phenyl ring, joining through the C(α)–C(β) bridge. The most popular conformer of Phe in the gas phase is stabilized by a hydrogen bond (H-bond) network.3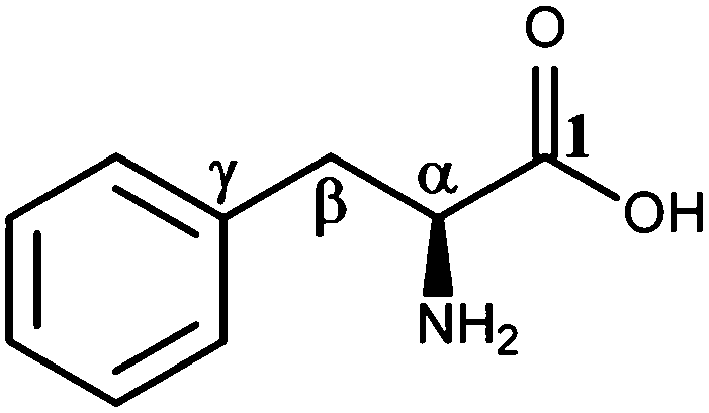 | ||
| Fig. 1 Chemical structure of Phe and its nomenclatures. | ||
Orientations of the functional groups connected at the α-carbon (C(α)), which together form the moiety of amino acid, play a vital role in structure–properties of Phe. Our recent ab initio molecular dynamics study21 reveals that the intra-molecular H-bonds between the carboxyl and amino group in Phe is important for stabilizing the micro-hydrated Phe–Cu2+ complexes.21 Similarly, an earlier data mining study also identified the amide–phenyl interactions in Phe as an essential factor to stabilize the protein residues over large conformational spaces.26 As a result, studies of electronic structures and the intra-molecular mechanisms of Phe can be useful to understand the complex structures and the associated properties.
A large number of studies on the electronic properties of Phe has been reported using a variety of theoretical and experimental methods. For example, photoemission spectroscopy (PES),18,27–31 near edge X-ray absorption fine structure (NEXAFS) spectroscopy,32,33 electron energy loss spectroscopy (EELS),17 etc. It is reported5 that the N1s core level spectra of Phe is an indicator of the conformer population. Similarly, the valence PES spectra of Phe and other aromatic amino acids have also been reported previously.18,27–31 However, the assignment of the first ionization energy (IE) to the highest occupied molecular orbital (HOMO) remains controversial. For example, Cannington and Ham30 reported this energy of Phe as 9.4 eV, while Campbell and colleagues27,31 presented with a broad peak between 8–10 eV in the photoelectron spectrum of Phe. In their initial study, Campbell et al.31 indicated that the first IE energy of Phe could correspond to the nitrogen lone pair appearing at 8.5 eV, which is also supported by the photoionization study by Vorsa et al.34 Nevertheless, in their later study,27 this energy of Phe was reassigned as a joint contribution from the nitrogen lone pair and the π orbitals from the phenyl group. Such the assignment was supported by a later XPS study,18 which assigns the first IE of Phe at 9.5 eV to the contributions of π1, π2 and the nitrogen lone pair. The experimental study also suggested the orbital characters of several valence orbitals in Phe.18 A recent theoretical study by Close,15 however, assigns the first IE energy to only π orbital contributions of Phe.
Confident assignment and thorough understanding of the valence binding energy spectrum of Phe in gas phase needs significant theoretical support. The measured spectra of Phe in the valence space remain congested without being fully resolved, even with high-resolution synchrotron sourced spectrometers. Theoretical calculations are, therefore, necessary to provide details for the entire valence region of the molecule and to relate the spectral features with its electronic structure, as described in our previous studies.12,14,35–41 In addition, interpretation of the measured valence binding energy spectra of molecules needs detailed information of the orbital energies (positions of the spectral lines) as well as the orbital distributions, which are the results of quantum mechanical calculations. In a recent review, Wang and Ahmed42 reiterated the importance of theoretical calculations to help experimental measurements as well as to suggest new experiments. As a result, the dual space analysis (DSA)43 is applied in this study to further our understanding on the electronic structures of molecules, such as Phe, through their amino acid contained fragments, their energies (in position space) and orbitals (in momentum space).
The atoms-in-molecules (AIM) model44,45 and fragment-in-molecules (FIM) model46,47 are well known in chemistry. The FIM model has remained particularly useful in the interpretation of photoelectron spectra of organic molecules.46,47 The (FIM) model is less adopted in chemistry for molecules such as DNA bases; however, it is good model for the class of amino acid-contained molecules (peptides and dipeptides, for example) that exhibit the nature of building blocks of life. As a result, it is very important to obtain the information of fragments, their interactions and their roles to the properties of the target molecules in this class of biomolecules. The structure–property (functionality) relationship inspires innovation in rational design of functional materials such as drugs, chemical sensors, organic dyes and electronics materials.13,22,42 The present study aims to reveal electronic structures and intra-molecular interactions of Phe using the FIM model. Phe can be assembled by a number of fragments, among which are two most useful fragmentation schemes containing amino acids. That is, the alanine/benzene (A/B) scheme and the glycine/toluene (G/T) scheme, as shown in Fig. 2. In our previous paper,12 the A/B fragmentation scheme (Scheme I) has been studied,12 which indeed showed the significant physical and chemical characters of the A/B fragment (i.e., alanine and benzene) of Phe. The present study will focus on the influence of the G/T scheme (Scheme II) fragments to Phe, and how it compares with that of the A/B scheme.
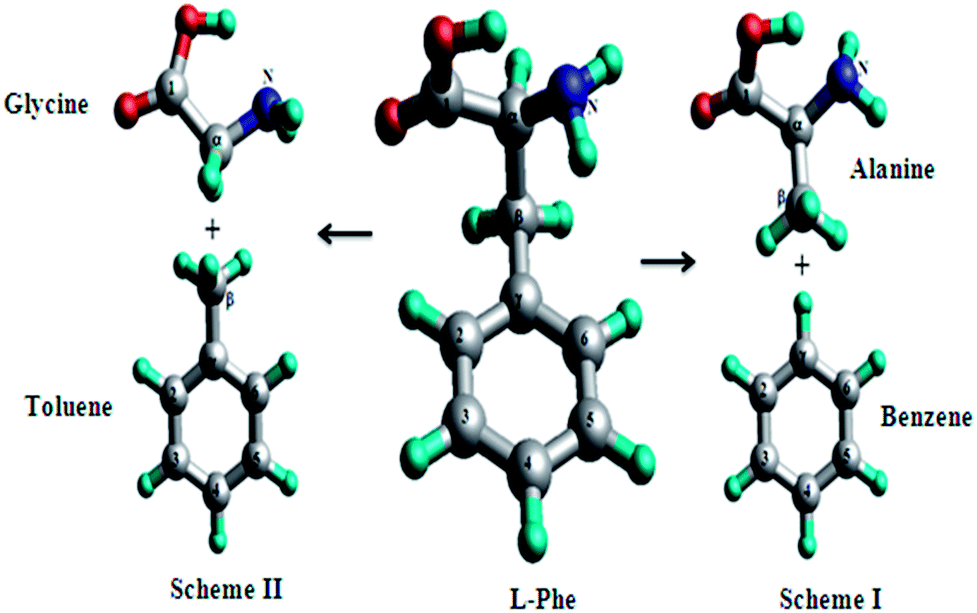 | ||
| Fig. 2 Optimized ground structures of L-Phe and its fragment schemes, alanine/benzene (A/B) scheme (Scheme I) and glycine/toluene (G/T) scheme (Scheme II). | ||
Computational details
For comparison and consistency, the same theoretical models which were used in our previous work12 are employed in the present study. Briefly, optimization calculations for the glycine and toluene (saturated by H atoms), as if they were free molecules, are based on the B3LYP/TZVP model. The core binding energy spectra of the molecules are calculated using the LB94/et-pVQZ//B3LYP/TZVP model and the ΔEKS method,48,49 respectively. The valence energies of the fragment molecules are calculated using the SAOP/et-pVQZ//B3LYP/TZVP and the OVGF/TZVP//B3LYP/TZVP models.50,51 Molecular orbitals of Phe, glycine and toluene, in coordinate space, which are produced using the B3LYP/TZVP model, are mapped into momentum space as theoretical momentum distributions (TMDs) in the dual space analysis (DSA).43 Computational chemistry packages such as G03 (ref. 52), G09 (ref. 53) and ADF54 are employed in the calculations.Results and discussion
Inner shell binding energy spectra and relaxation effects of Phe
No significant changes in geometries of Phe with respect to the fragments (saturated by hydrogen atoms), which were re-optimized for their minimum structures as if there were free molecules, are found (refer to ESI, SI. 1†). Fig. 3 compares the measured X-ray photoemission spectra (XPS) of Phe5 in the inner shell with simulated spectra using the LB94/et-pVQZ model and the ΔEKS method, respectively. In the simulated spectra, the full width at half maximum (FWHM) of 0.40 eV is employed in order to reproduce the experimental spectra5 as much as possible.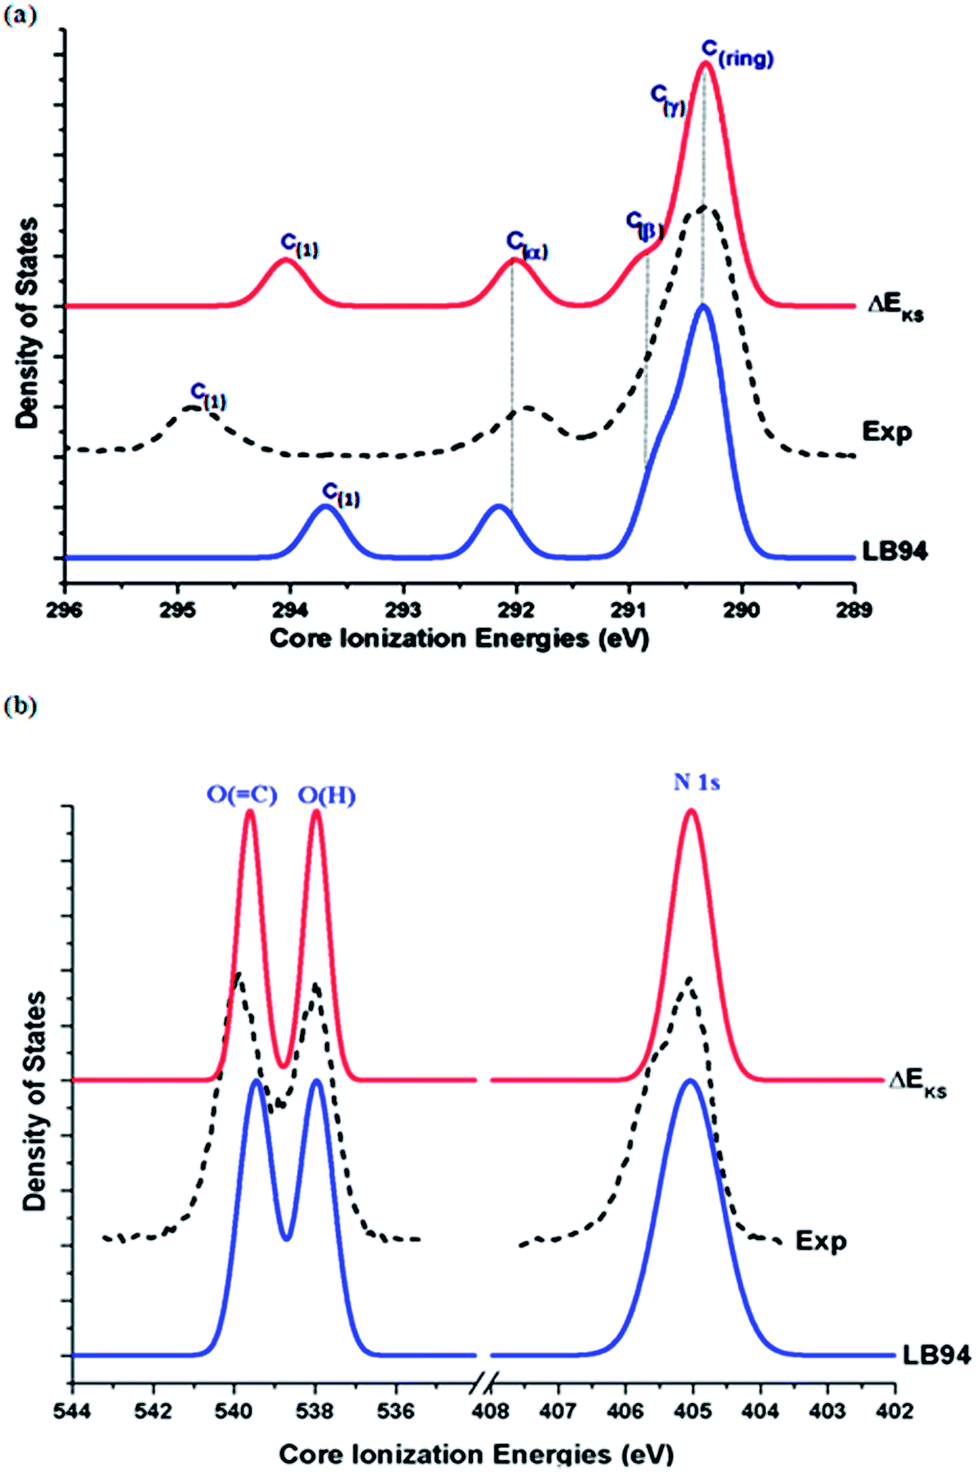 | ||
| Fig. 3 Comparison of the calculated and measured5 XPS for Phe in gas phase. (a) C1s, (b) N1s and O1s spectra. | ||
The agreement between the calculated and the measured XPS is very well. The calculated vertical C1s spectrum of Phe using the LB94 model has been shifted by −0.67 eV, whereas the ΔEKS calculated C1s spectrum is compared with the measurement directly without any shift. Such the global energy shift of the calculated vertical binding energies reduces certain systematic effects such as relaxation effects due to the LB94 model. The remarkable agreement between the calculated and the measured5 spectra indicates that the individual core hole state related relaxation is fairly small, which can be compensated by application of global energy shift to the spectra obtained using less expensive theoretical models such as LB94 in this study. Since the ionization process is a fast one, the vertical ionization process is a good approximation for the core ionization. The vertical IEs of Phe can be calculated using the LB94 model, which involves significantly less computation when comparing to the ΔEKS method.
The C1s XPS binding energy spectra of Phe are then assigned based on the calculations: the order of the binding energy is given by C(1) > C(α) > C(β) > C(γ) > C(ring). Such the order indicates that the chain carbons are more difficult to ionize and the carbonyl carbon atom (C(1)![[double bond, length as m-dash]](https://www.rsc.org/images/entities/char_e001.gif) O) is the most unlikely to be ionized. As a result, from energy point of view, the aromatic C–C bonds may break first followed by the bonds on the chain. The fact that the C(1)O carbon site possesses the largest IE is also supported by the O1s spectrum in the same figure (Fig. 3(b)). The O(C) peak possesses higher IE than the O(–H) site of Phe. While most of the C1s IEs are reproduced by the calculations well, the IE of this carbonyl carbon, C(1), shows a larger discrepancy between the measurement and calculations. The LB94 model tends to underestimate the C(1)(O) energy by 1.16 eV (after taking into account the energy shift of 0.67 eV), which is reduced to 0.81 eV if the ΔEKS method is employed. This indicates that the relaxation effects play a more significant role in this carbonyl carbon with a double bond.38 Larger IE discrepancies between theory and experiment of this carbonyl carbon site are also found in other amino acids.22,42,55
O) is the most unlikely to be ionized. As a result, from energy point of view, the aromatic C–C bonds may break first followed by the bonds on the chain. The fact that the C(1)O carbon site possesses the largest IE is also supported by the O1s spectrum in the same figure (Fig. 3(b)). The O(C) peak possesses higher IE than the O(–H) site of Phe. While most of the C1s IEs are reproduced by the calculations well, the IE of this carbonyl carbon, C(1), shows a larger discrepancy between the measurement and calculations. The LB94 model tends to underestimate the C(1)(O) energy by 1.16 eV (after taking into account the energy shift of 0.67 eV), which is reduced to 0.81 eV if the ΔEKS method is employed. This indicates that the relaxation effects play a more significant role in this carbonyl carbon with a double bond.38 Larger IE discrepancies between theory and experiment of this carbonyl carbon site are also found in other amino acids.22,42,55
Accurate calculations of the inner shell IEs of bio-molecules remain a challenge. Fig. 3(b) also compares the theoretical and the experimental N1s and O1s spectra of Phe. A smaller global energy shift of 0.71 eV (N1s) and 0.50 eV (O1s), respectively, are applied to the ΔEKS model, whereas the LB94 calculations require a larger energy shift of 1.35 eV for N1s and 3.61 eV for O1s, in order to reproduce the experimental spectra. In general, larger shifts with respect to the N1s and O1s spectra calculated using the LB94 model indicate larger relaxation effects at the higher energy region of the spectra, such as N1s and O1s. A small shoulder at the N1s peak of ca. 405.5 eV in the measured N1s spectrum of Phe can be due to the conformational effects of Phe,5 which is out of the scope of the present study. The ΔEKS method is more accurate in the inner shell than the vertical IEs, where the discrepancy between the calculations and the measurement is approximately <1 eV, due to the considerations of individual orbital relaxations. However, computational costs, convergence issues and laborious processes of calculating individual orbitals, must be taken into account while using the ΔEKS model for molecules with degenerate orbitals, such as benzene56,57 and larger molecules in general.
Valence binding energy spectra of Phe and fragment molecules
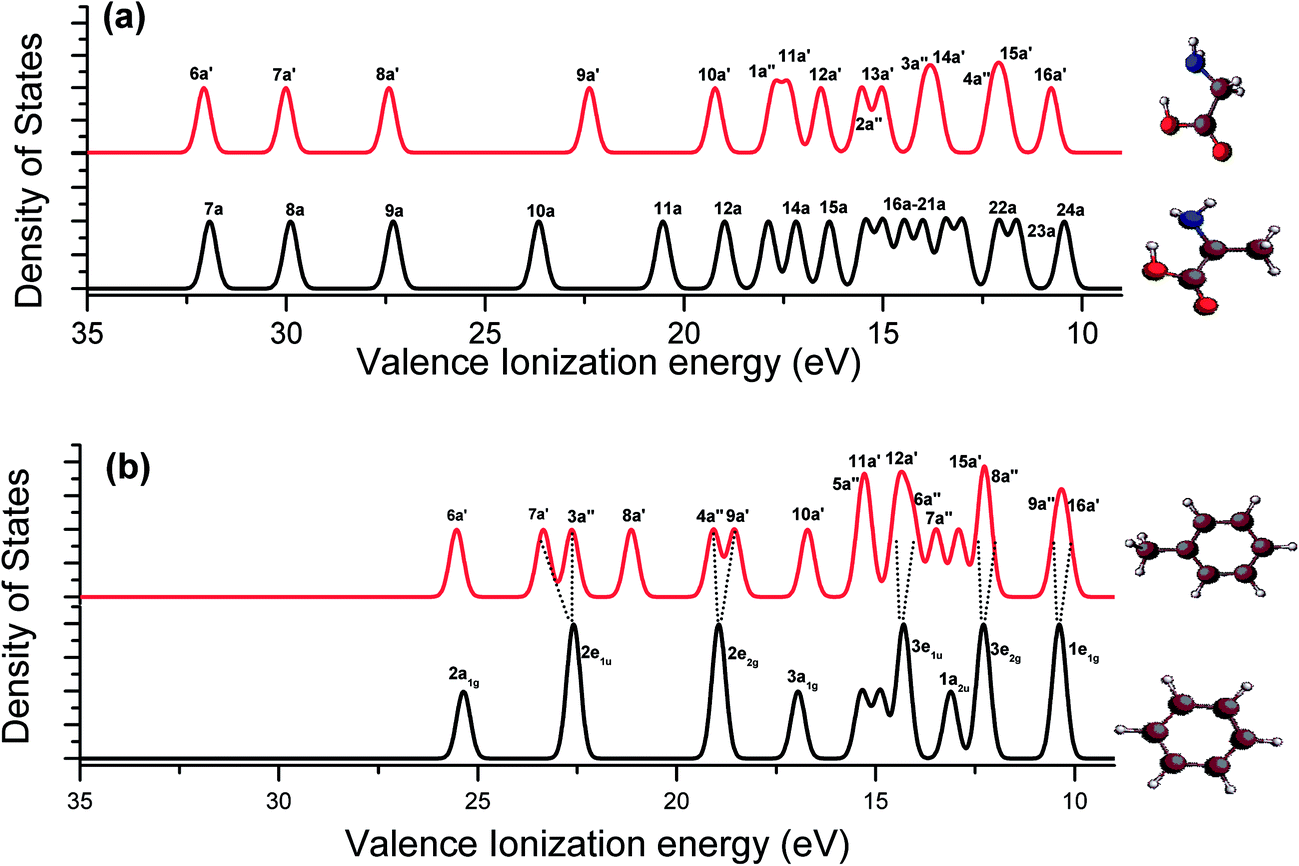
Phe can be considered as forming from two different amino acid contained fragment schemes, i.e., alanine/benzene (A/B) scheme (Scheme I) and glycine/toluene (G/T) scheme (Scheme II). The electronic ground states of Phe and the fragment molecules, i.e., glycine, alanine, benzene and toluene are all in closed shells. The ground state of glycine (X1A′) has 15 valence molecular orbitals (MOs), while 18 valence MOs each for the ground states of alanine (X1A) and toluene (X1A′). The ground state of benzene (X1A1g) contains five doubly degenerated (MOs) in its 15 occupied valence MOs. As a result, the ground state (X1A) of Phe contains 32 occupied valence MOs. Note that the fragments are saturated by hydrogen atoms.Table 1 compares the calculated valence vertical IEs of Phe and its fragment molecules in their ground electronic states. The DFT based SAOP/et-pVQZ and Green's function based OVGF/TZVP models along with the available measured IEs from literature58–62 are also given in this table. The spectroscopic pole strengths (ps) in the OVGF model for the outer valence IEs of the molecules are larger than 0.85 (except a very few MOs such as, 1a2u in benzene (0.81), 14a′ in toluene (0.84) and 37a in Phe (0.84)), indicating that the one-particle approximation is a good approximation. It has been shown12 that the OVGF model produced accurate IEs with good agreement with experimental measurement. For example, the calculated IE discrepancies from the measurement are only 0.07 eV, 0.59 eV and 0.03 eV, respectively, for the three 1e1g, 3e2g and 1a2u outermost orbitals in benzene, as shown in the table. Nevertheless, the OVGF model only produces the outer valence vertical IEs of molecules. To obtain IEs in the complete valence space, the SAOP model is, therefore, employed. With the exception of few frontier MOs, the SAOP model produces fairly accurate results for the entire valence MOs, whose ΔIEs against the experimental data are mostly <1 eV. The SAOP model slightly over estimated the IEs of few frontier orbitals in this study, as also the case in some previous studies.35,41,63 It is important to note that the experimental binding energies (i.e., IEs) themselves are averaged values, as the valence peaks in the experiments are mostly broad and congested. The calculated vertical IEs in Table 1 are for the global minimum conformers of the related molecules.
| Benzene (D6h)12 | Toluene (Cs) | Phenylalanine (Phe) | |||||||||
|---|---|---|---|---|---|---|---|---|---|---|---|
| Orbital | SAOPa | OVGFa (ps) | Expd | Orbital | SAOPb | OVGFa (ps) | Expc | Orbital | SAOPa | OVGFa (ps) | Exp |
| a Models, LB94/et-pVQZ; SAOP/TZ2P; OVGF/TZVP.b SAOP/et-pVQZ model.c Experimental values for benzene, toluene, alanine and glycine are from the reference, ref. 58, 66, 30 and 67, respectively.d Unresolved and unassigned intensities.30e Band intensity indicates other band(s) present, as well as π.30f Broad band encompassing several states.30 | |||||||||||
| 2a1g | 25.36 | 25.9 | 6a′ | 25.53 | 13a | 32 | |||||
| 2e1u | 22.59 | 22.5 | 7a′ | 23.35 | 14a | 29.95 | |||||
| 2e2g | 18.94 | 19.2 | 3a′′ | 22.64 | 15a | 27.26 | |||||
| 3a1g | 16.95 | 17.44 (0.85) | 16.9 | 8a′ | 21.14 | 16a | 25.65 | ||||
| 2b2u | 15.35 | 15.87 (0.87) | 15.5 | 4a′′ | 19.08 | 17a | 23.82 | ||||
| 1b1u | 14.88 | 14.84 (0.87) | 14.8 | 9a′ | 18.55 | 18a | 22.76 | ||||
| 3e1u | 14.3 | 14.41 (0.88) | 13.9 | 10a′ | 16.71 | 16.89 (0.86) | 19a | 22.42 | |||
| 1a2u | 13.11 | 12.33 (0.81) | 12.3 | 5a′′ | 15.36 | 15.18 (0.87) | 16.49 | 20a | 20.67 | ||
| 3e2g | 12.29 | 12.09 (0.90) | 11.5 | 11a′ | 15.22 | 15.40 (0.87) | 15.58 | 21a | 19.22 | ||
| 1e1g (HOMO) | 10.39 | 9.13 (0.90) | 9.2 | 12a′ | 14.49 | 14.48 (0.88) | 15.12 | 22a | 19.08 | ||
| 6a′′ | 14.31 | 14.23 (0.88) | 14.04 | 23a | 18.64 | ||||||
| 13a′ | 14.04 | 13.82 (0.90) | 13.9 | 24a | 17.73 | ||||||
| 7a′′ | 13.48 | 13.52 (0.90) | 13.29 | 25a | 16.85 | 17.23 (0.87) | |||||
| 14a′ | 12.92 | 11.94 (0.83) | 12.01 | 26a | 16.76 | 17.10 (0.90) | 16.5d | ||||
| 8a′′ | 12.31 | 11.82 (0.90) | 11.86 | 27a | 15.95 | 16.02 (0.90) | |||||
| 15a′ | 12.23 | 11.80 (0.90) | 11.45 | 28a | 15.59 | 15.56 (0.89) | |||||
| 9a′′ | 10.45 | 8.96 (0.90) | 9 | 29a | 15.37 | 15.61 (0.89) | |||||
| 16a′ (HOMO) | 10.22 | 8.70 (0.90) | 8.76 | 30a | 15.28 | 15.32 (0.90) | |||||
| Alanine12 | Glycine | 31a | 14.82 | 14.76 (0.90) | 14.9d | ||||||
| 7a | 31.93 | 6a′ | 32.07 | 34.3 | 32a | 14.42 | 14.43 (0.90) | ||||
| 8a | 29.89 | 7a′ | 30.01 | 32.3 | 33a | 14.38 | 14.17 (0.90) | ||||
| 9a | 27.31 | 8a′ | 27.42 | 28.3 | 34a | 14.02 | 13.69 (0.90) | 14.0d | |||
| 10a | 23.66 | 9a′ | 22.38 | 23.3 | 35a | 13.7 | 13.35 (0.90) | 13.4d | |||
| 11a | 20.53 | 10a′ | 19.22 | 20.2 | 36a | 13.18 | 12.74 (0.91) | ||||
| 12a | 18.98 | 1a′′ | 17.74 | 17.88 (0.90) | 17.6 | 37a | 13.03 | 12.22 (0.84) | |||
| 13a | 17.88 | 17.88 (0.90) | 11a′ | 17.36 | 18.31 (0.91) | 16.9 | 38a | 12.39 | 11.86 (0.91) | ||
| 14a | 17.19 | 17.97 (0.91) | 12a′ | 16.56 | 16.66 (0.91) | 16.6 | 39a | 12.35 | 11.72 (0.91) | ||
| 15a | 16.35 | 16.83 (0.90) | 16.6 | 2a′′ | 15.54 | 15.49 (0.90) | 15.8 | 40a | 12.06 | 10.80 (0.91) | |
| 16a | 15.45 | 15.61 (0.90) | 13a′ | 15.03 | 15.26 (0.91) | 15 | 41a | 11.59 | 10.96 (0.90) | 11.9e | |
| 17a | 14.99 | 15.51 (0.90) | 14a′ | 13.97 | 13.58 (0.91) | 14.4 | 42a | 10.66 | 9.61 (0.91) | ||
| 18a | 14.47 | 14.63 (0.91) | 14.8 | 3a′′ | 13.67 | 13.86 (0.92) | 13.7 | 43a | 10.55 | 9.03 (0.90) | 10.9e |
| 19a | 13.99 | 14.13 (0.92) | 4a′′ | 12.24 | 11.47 (0.91) | 12.2 | 44a (HOMO) | 10.35 | 8.80 (0.90) | 9.4f | |
| 21a | 13 | 13.21 (0.92) | 12.8 | 16a′ (HOMO) | 10.78 | 10.12 (0.92) | 10 | ||||
| 22a | 12.1 | 11.44 (0.91) | 12.1 | ||||||||
| 23a | 11.64 | 11.41 (0.90) | 11 | ||||||||
| 24a (HOMO) | 10.45 | 10.09 (0.91) | 9.85 | ||||||||
Fig. 4 compares our theoretical valence ionization spectra of Phe, calculated using the SAOP/et-pVQZ (bottom panel) and OVGF/TZVP (top panel) models, against a previous high resolution gas phase synchrotron radiation based experimental spectrum.18 The calculated valence binding energy spectra of Phe have been globally shifted such that their HOMO peaks align against the experimental first IE at 9.5 eV. The spectrum calculated using the OVGF model has been blue shifted by a ΔIE of 0.6 eV; whereas the energy shift of −0.95 eV has been applied to the SAOP spectrum. As it can be seen in the figure, the valence spectra produced using our theoretical models in this work match excellently against the measured spectrum. Indeed, the shapes and intensities of almost all the peaks in the experimental data have been accurately reproduced by our calculations. Both SAOP and OVGF present good correlation against the experiment in the region <18 eV; while the SAOP continues to present a good estimation of IEs in the inner valence space as well. Theoretically, the OVGF model produces only outer valence IEs. On the other hand, the SAOP model exhibits comparable accuracy with both OVGF calculation and the experiment in almost the entire valence space. This confirms that SAOP/et-pVQZ//B3LY/TZVP model is suitable for studying the valence ionization spectra of Phe and its' fragment molecules in this study. Moreover, our previous studies have also found this model to produce accurate IE values for amino acid fragments in this work, alanine and glycine.52
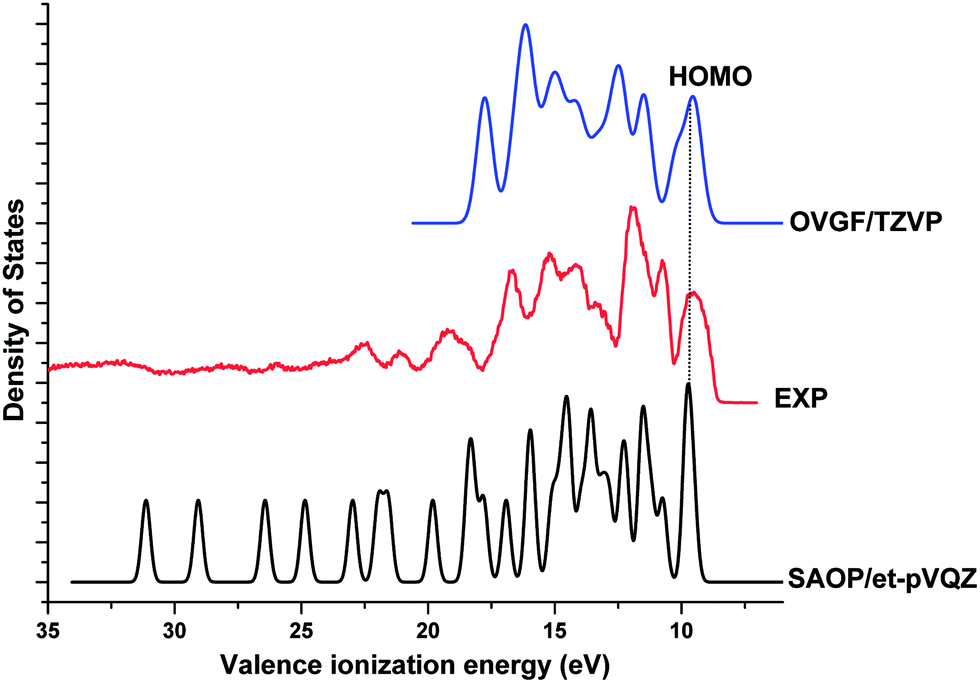 | ||
| Fig. 4 Comparison of the theoretical valence spectra of Phe calculated using SAOP/et-pVQZ (FWHM = 0.4 eV) and OVGF/TZVP (FWHM = 0.7 eV) against a previous experimental spectrum.18 | ||
It is known that Phe presents several low-lying conformations on the potential energy surface, which may be a cause to the congested IE spectra in measurements.3,5,30 This is also evidenced by a previous resonant two-photon ionization (R2PI) experiment,10 which indicates that the conformer related dependency on binding energies of the first IE could range from 8.80 to 9.15 eV with a variation as much as 0.35 eV.10 Furthermore, amino acids with complex side groups are likely to result in broader spectral peaks in their binding energy spectra as the orbital energies of these side chains (in the present case, phenyl) are usually comparable to main chain peaks. A fragment approach can be useful to resolve these issues.
Fig. 5 presents the calculated vertical valence binding energy spectra of glycine vs. alanine (a), and benzene vs. toluene (b), which differ by a methyl moiety. The spectra show that a few extra spectral peaks in alanine (a) and toluene (b) that are not present in the respective spectra of glycine and benzene can be the contributions from the methyl group. Our previous studies40,55 indicated that the valence MOs (11a, 12a, 19a and 20a) of alanine are the methyl signature orbitals, while the MOs within 12–16 eV present the fingerprint interactions of the aliphatic molecules53 (Fig. 5(a)). This is also true in the valence binding energy spectra of benzene and toluene in Fig. 5(b). The valence spectra of toluene present a few methyl related spectral peaks such as, 8a′, 12a′ and 7a′′, which do not exist in the binding energy spectra of benzene. Moreover, the five pairs of doubly degenerate valence MOs of benzene (D6h point group symmetry) split into five pairs of non-degenerate MOs in toluene (Cs point group symmetry). That is, 2e1u (benzene) → 7a′, 3a′′ (toluene); 2e2g → 4a′′, 9a′; 3e1u → 6a′′, 13a′; 3e2g → 15a′, 8a′′ and 1e1g → 9a′′, 16a′. Therefore, the information from the fragment molecules provides more details for the understanding of the binding energy spectrum and electronic structure of Phe.
 | ||
| Fig. 5 Comparison of vertical valence ionization spectra of (a) glycine vs. alanine; and (b) toluene vs. benzene. The SAOP model is employed. | ||
Fig. 6 compares the valence vertical binding energy spectra of Phe with respect to the fragment schemes, the A/B scheme and G/T scheme. All are calculated using the SAOP model (with an FWHM of 0.40 eV) as this model is able to calculate the complete valence space binding energies. A clear fragments-in-molecules picture pops up in the spectra of Phe in the figure. For example, the inner valence region (IEs > 20 eV) displays remarkable similarities in both the fragment schemes. The three innermost valence spectral peaks of Phe (13a–15a) are dominated by the amino acid moieties of alanine (7a–9a) and glycine (6a′–8a′), followed by a peak of Phe (16a), which is correlated with either benzene (2a1g) or toluene (6a′). The inner valence space is dominated by the less delocalized (localized) 2s orbitals of the non-hydrogen atoms of a molecule, providing a clear picture of the contribution. On the other hand, in the outermost valence region of Phe at ∼10 eV, this congested valence binding energy peak with contributions from orbitals 42a–44a of Phe is almost reproduced by superposition of either the doubly degenerated HOMO (1e1g) of benzene and the HOMO of alanine (24a),12 or the HOMO (16a′) and HOMO-1 (9a′′) of toluene as well as the HOMO of glycine (16a′). The spectral regions of IE < 11 eV (outer valence) and >20 eV (inner valence) in Phe show apparent similarities with the fragment characters, as if the fragments were free molecules. However, some of the peaks within these regions display contradicting correlations in the two fragment schemes. For example, the MO 17a of Phe is related to an aliphatic counterpart in the A/B scheme (i.e., MO 10a of alanine), while the same MO of Phe is correlated with a phenyl fragment (i.e., 7a′ of toluene) in the G/T scheme. Another example includes the 20a orbital of Phe, which is correlated with 11a of alanine in the A/B scheme, whereas with 8a′ of toluene in the alternate G/T scheme. The interactions in these MOs of Phe will be discussed further in the following orbital topology section.
 | ||
| Fig. 6 Comparison of the simulated vertical valence ionization spectra of (a) benzene–Phe–alanine and (b) toluene–Phe–glycine. | ||
Moreover, the middle region of the binding energy spectrum of Phe, that is, 20 eV > IE > 11 eV, displays characters of the Phe that are hardly produced using simple superposition of the spectra of its fragments. This spectral regime, therefore, indicates that the interactions among the fragments and the chemical bonding characters are unique to Phe. Similar trends were revealed by the valence binding energy spectra of some nucleosides.35 It suggests that the cluster of MOs concentrated in the middle valence energy region likely holds the key information about significant intra-molecular mechanisms of Phe, which are influenced differently by different fragment schemes.
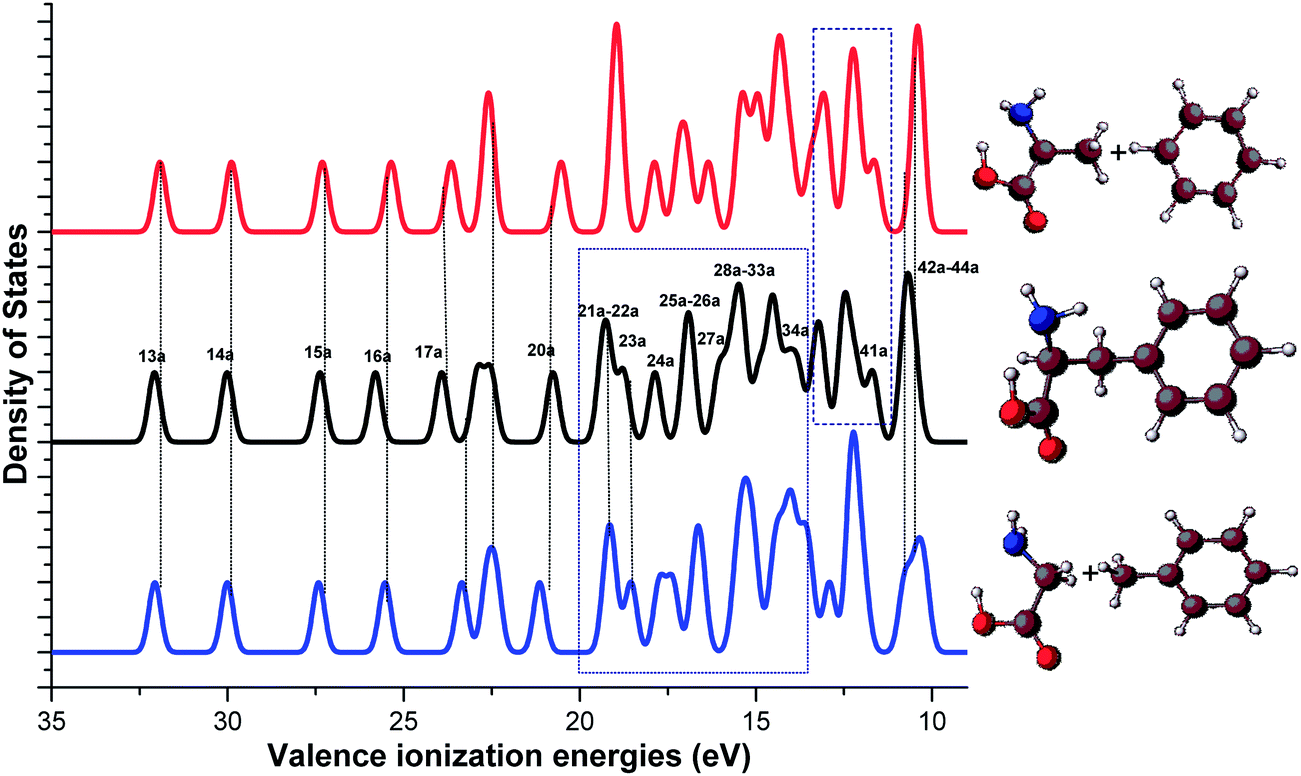
In order to further explore the valence electronic structures of Phe from the fragments-in-molecules schemes, synthetic binding energy spectra of Phe are produced by simple superposition of the spectra of the amino acids with their phenyl fragments, based on the A/B and G/T schemes. Fig. 7 compares the calculated Phe spectrum (in the middle panel) and the synthetic Phe spectra generated from alanine and benzene (in upper panel), and glycine and toluene (in the lower panel). This figure helps to unravel the mid-valence region of 20 eV > IE > 11 eV in Phe that complex due to strong intra-molecular interactions. Interestingly, this mid valence region in the spectra of Phe can be divided at 14 eV. That is, the valence spectral region of 14 eV–20 eV of Phe formed by MOs 21a–34a of Phe is almost the same as the synthetic spectrum generated from the G/T scheme. However, as noted previously,12 the peaks in the valence spectral region of Phe at 11–14 eV is very similar to the A/B synthetic spectrum. The findings indicate that the inner most (>20 eV) and the outer most (∼10 eV) valence regions of Phe are dominated by its functional groups; the lower energy band (11–14 eV) of the mid valence region receives dominant contributions from fragment interactions between alanine and benzene fragments, whereas the higher energy band (14–20 eV) are dominated by the interactions between glycine and toluene fragments. The fragments-in-molecules approach, therefore, serves as a very useful tool to understand the electronic structure and reaction mechanisms of Phe.
 | ||
| Fig. 7 Comparison of the calculated vertical valence ionization spectra of Phe (middle panel) with the synthetic spectra of alanine and benzene (upper panel), and (b) glycine and toluene (lower panel) fragment schemes. | ||
Valence orbital topologies
Detailed assignment of vertical valence binding energy spectra of Phe through its fragment schemes can be obtained through the study of their valence orbitals. Orbitals reveal electronic structural information of the ionization spectra and one-particle properties. In molecular orbital theory, information of valence orbital topology is useful as changes in the orbitals are indicators of chemical bonding.12 Fig. 8 displays the inner (a) and outer valence (b) orbital diagrams of the related fragments, in which the left side panel presents the orbital correlations in the A/B scheme, whereas the right side panel displays the correlation in the G/T scheme. In the figure, the solid lines correlate the Phe orbitals and its phenyl fragments, benzene or toluene, and the dot lines correlate the Phe orbitals with its amino acid fragments, alanine or glycine. Orbital correlations from both the phenyl and amino acid fragments are given as dashed lines.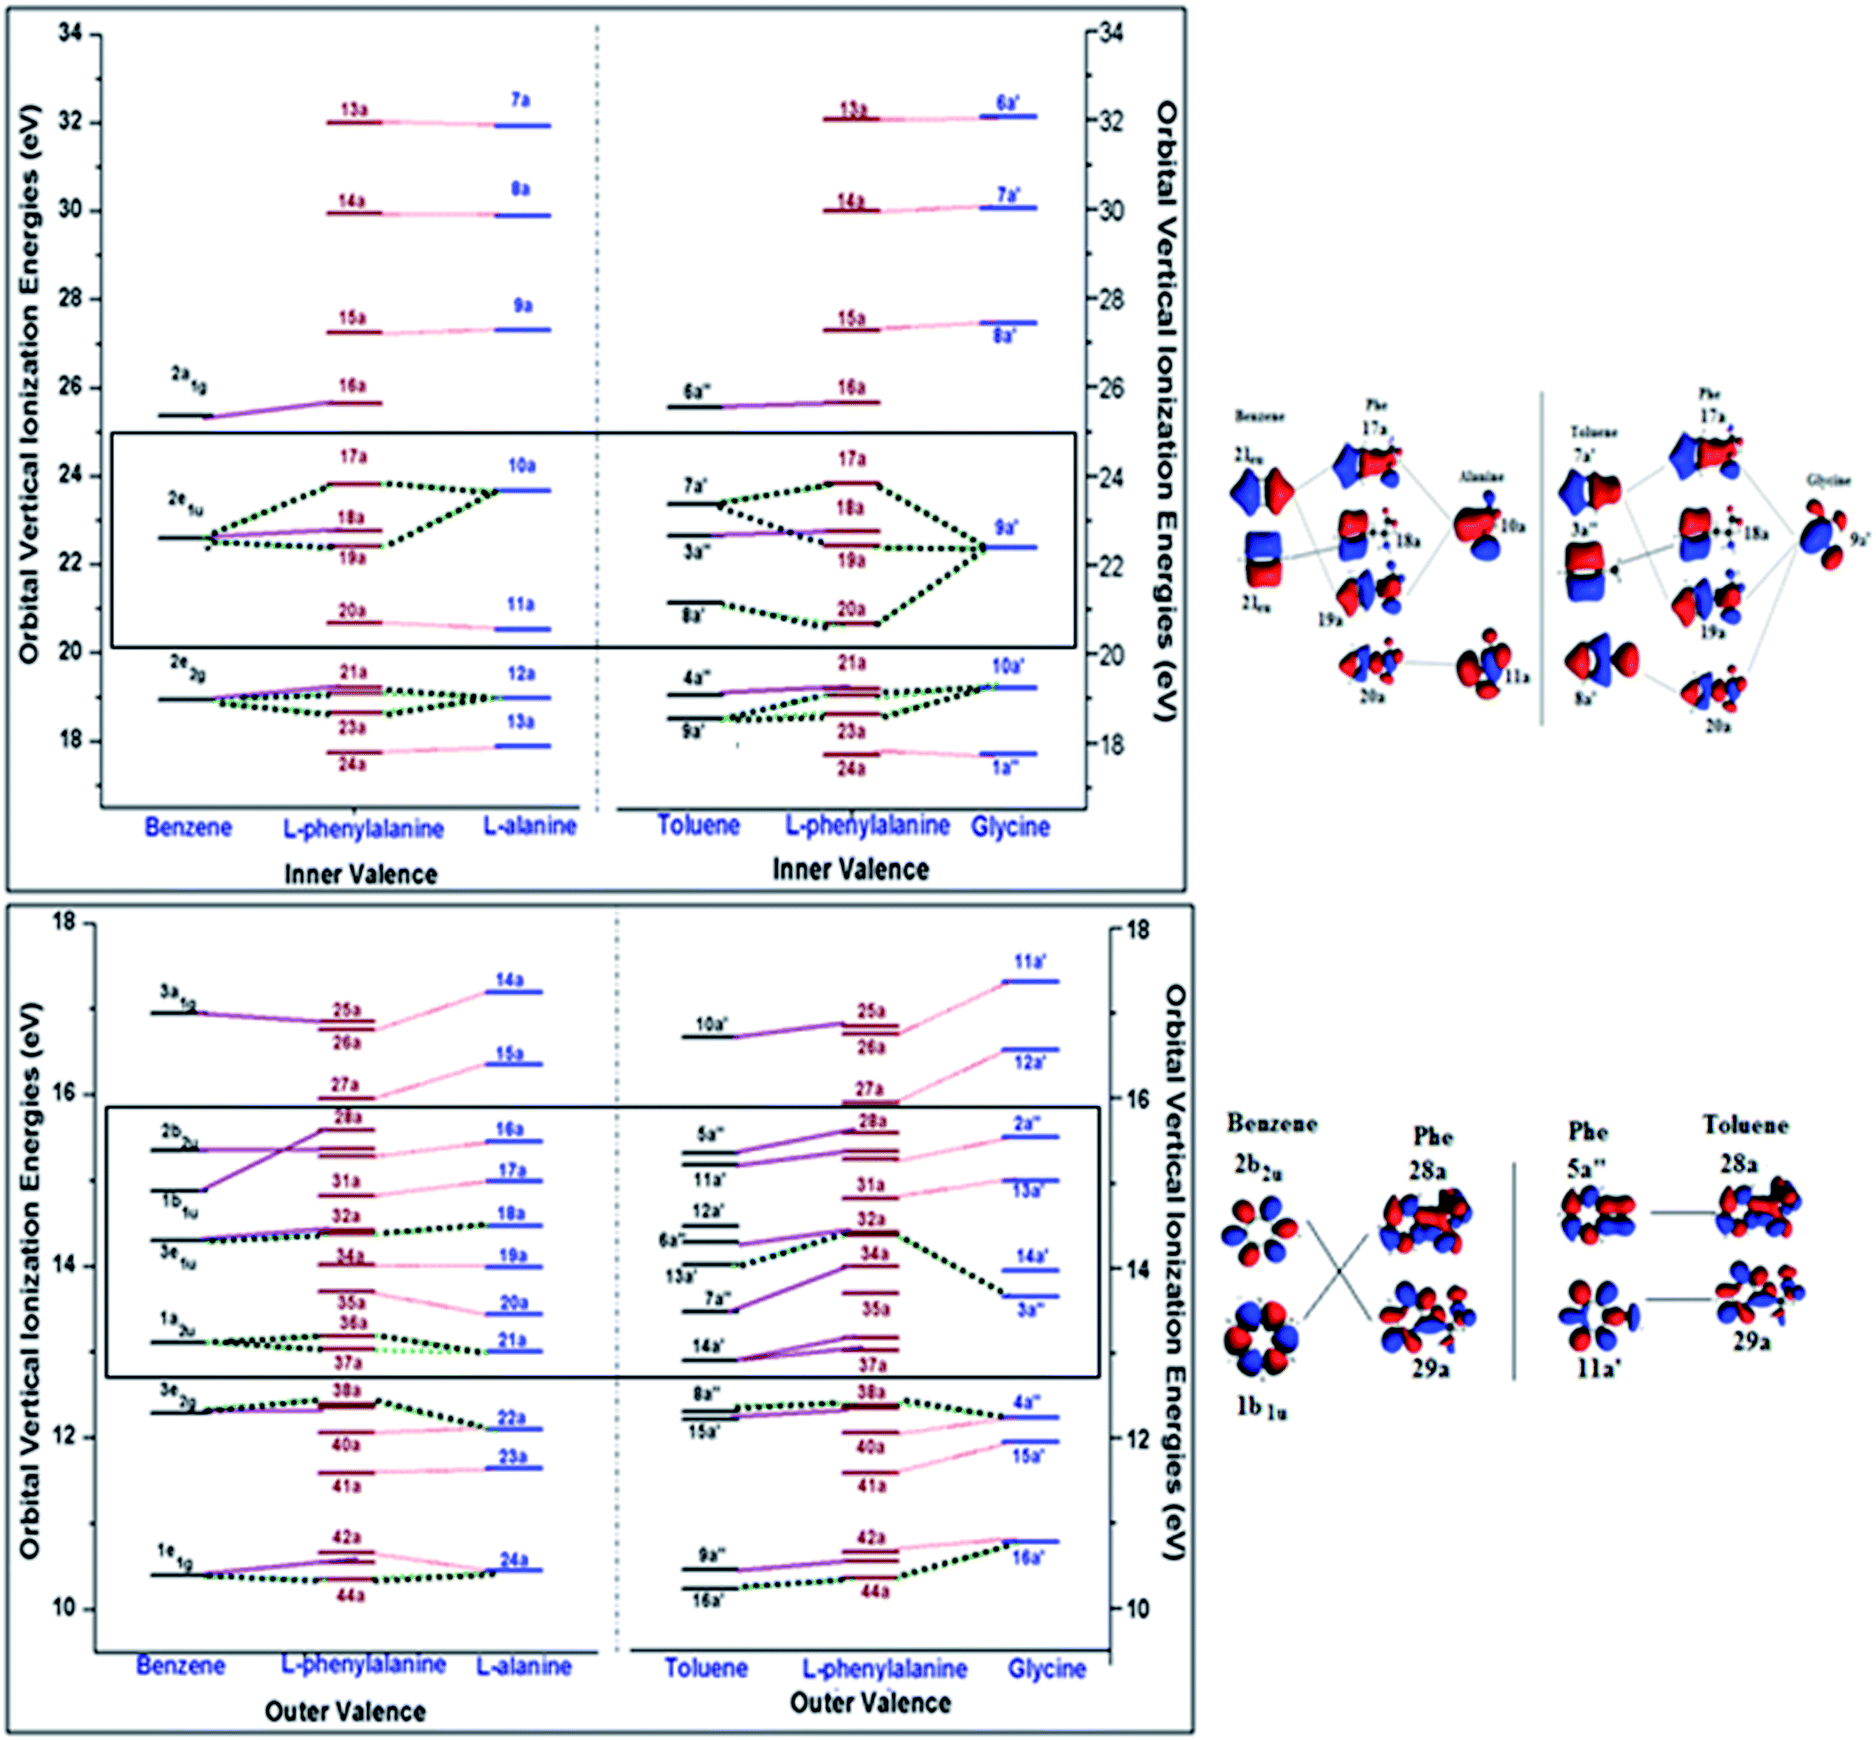 | ||
| Fig. 8 Valence orbital correlation diagrams of Phe with its fragment schemes: alanine/benzene and glycine/toluene in the (a) inner valence and (b) outer valence regions. | ||
Phe has the point group symmetry of C1 without any energy degenerate orbitals, so do the MOs of alanine (C1), glycine (Cs) and toluene (Cs). However, the high symmetry benzene (D6h) possesses five pairs of occupied doubly degenerate orbitals in its valence space, i.e., 1e1g, 3e2g, 3e1u, 2e2g and 2e1u, in which, two of the MOs (2e2g and 2e1u) appear in the inner valence and the other orbitals (1e1g, 3e2g and 3e1u) are in the outer valence region.12 It is noted in this diagram that the orbital correlations are not strictly on the one-to-one basis, since “free fragments” employed in the present study are molecules saturated by hydrogen atoms. Hence the orbital correlations are matched by their orbital characteristics of the molecules. Refer to ESI, SI. 2,† for correlated orbital diagrams of all the MOs of Phe and the fragment molecules.
Inner valence orbitals of a molecule are usually dominated by 2s orbitals of the component atoms. As a result, hydrogen atoms do not dominate these inner valence orbitals although it may affect those orbitals through interactions. The innermost valence orbitals in the energy region of IE > 24 eV clearly show a one-on-one correlation in both A/B and G/T schemes. For example, orbitals 13a, 14a and 15a of Phe are associated with the corresponding innermost MOs of alanine (7a, 8a and 9a) and glycine (6a′, 7a′ and 8a′). Those orbitals are dominated by the 2s orbital contributions from their carboxyl, hydroxyl and amino groups, respectively, of the amino acids. The next inner valence orbital of Phe is orbital 16a. It matches the 2a1g orbital of benzene and 6a′ orbital of toluene, indicating the apparent phenyl dominance. The orbitals below 24 eV in this figure are dominated by contributions from both fragment schemes, either A/B or G/T. For example, in the energy box of 20–24 eV in this figure, a doubly degenerate orbital of benzene (2e1u), together with the MO 10a of alanine fragment, contribute to three orbitals in Phe, such as 17a, 18a, 19a (Phe), which are shown in Fig. 8(a). Similar interactions are also seen in the G/T scheme, where the three MOs of Phe are related with two non-energy degenerate MOs of toluene (7a′ and 8a′) and the 9a′ MO of glycine. Nevertheless, the orbital 18a of Phe is solely dominated by the phenyl fragment, that is, benzene in the A/B scheme and toluene in the G/T scheme. Perhaps the most obvious fragment scheme dependent orbital pair of Phe is found in the MO 20a of Phe in Fig. 8(a), in which the contributions from the A/B scheme and G/T scheme are not the same. Orbital 20a of Phe concentrates on orbital 11a of alanine in the A/B scheme, whereas it is related with both a glycine MO (8a′) and a toluene MO (9a′) in the G/T scheme. As described in the zoomed-in orbital pictures in Fig. 8(a), it is clear that latter correlation is more reasonable since the C(β)–C(γ) interactions seen in the 20a MO of Phe is more close to the 8a′ of toluene. Thus, the contradicting correlations for 17a and 20a MOs of Phe in the valence spectra of A/B and G/T schemes in Fig. 6 arise from the strong intramolecular interactions between the amino-acid and phenyl fragments in Phe that are not captured from superposing the free fragment molecules. For the orbitals in the inner valence space with energy less than 20 eV in Fig. 7(a), the correlation patterns of the A/B and G/T schemes are the same.
In the outer valence energy region (Fig. 8(b)), the differences between the A/B and G/T schemes are largely focused in the formation of the MOs of Phe, except the region between approximately 12.5 eV and 16 eV (as marked by the box). The three doubly energy degenerate orbitals of benzene in the outer valence region are correlated to MOs in Phe, half of which also receive contributions from the amino acid fragment. For example, MOs, 33a, 38a and 44a of Phe are the results of the doubly degenerate orbitals of benzene and an orbital (18a, 22a and 24a) from alanine in the A/B scheme. The non-energy degenerate MOs of toluene in the G/T scheme provide useful information for the correlation in the A/B scheme and vice versa. Obviously, the A/B scheme provides a better correlation to the MOs of Phe in the energy region of this region of IE < 14.2 eV, which agrees with the findings in the previous section of vertical valence IEs of Phe, whereas the G/T scheme is a good description for the region of IE > 14 eV as evidenced by the vertical valence spectra of Phe given in Fig. 7. For instance, the MOs 28a and 29a of Phe at ∼15.4 eV have strong phenyl fragment dominance, however, they are more closely related with the toluene MOs (5a′′ and 11a′, respectively) than those from benzene (1b1u and 2b2u, respectively), due to the role of C(β)–C(γ) interactions in these MOs of Phe. Orbital pictures of these MOs are shown in Fig. 8(b). On the other hand, it is also noted that all MOs in the A/B scheme are correlated with the orbitals of Phe, whereas a couple of orbitals in the G/T scheme such as, orbital 35a in Phe, orbitals 12a′ in toluene and 14a′ in glycine, are unique in their orbital characters and are hardly related with other MOs. Such information will further be verified by combining the orbital features and momentum profiles of the molecules using the DSA approach43 in the next section.
Chemical bonding information from orbital TMDs
Position space analyses provide useful orbital information of the molecule and its chemical bonding. It suggests that the intra-molecular interactions of Phe using the A/B and G/T schemes. In order to further understand orbital based chemical bonding of Phe in a quantitative manner, in addition to the information from position space, the valence space information in momentum space is studied by means of DSA.43 Subtle quantitative orbital-based chemical bonding information of Phe can be revealed in momentum space. All the valence orbital theoretical momentum distributions (TMDs) of Phe and its fragments have been calculated and screened. As shown in our previous study,12 the TMDs of benzene calculated by our model12 were in excellent agreement against the earlier EMS measurements.64,65 Fig. 9(a)–(d) present the TMDs of selected valence orbitals from Phe and its fragment molecules, which display similar chemical bonding features. For instance, the TMDs of MOs 16a of Phe, 6a′′ of toluene and 2a1g of benzene are all dominated by the phenyl fragment and hence display similar distributions without node planes (s-like, Fig. 9(a)). The momentum spectra of these orbitals are almost identical, except the lower moment range <0.25 a.u., which can be attributed to the orbital contributions extending towards C(β) in toluene and Phe. Similarly, the TMDs of MO 39a of Phe is correlated with the MOs 3e2g of benzene and 15a′ of toluene based on their similar orbital features, those are strongly dominated by the p type interactions occurring in the ring. Similarities in the electron densities of these MOs are also reflected in their TMDs that present two ‘p’ like peaks (with nodal planes). The intensity of toluene in the region of ca. 0.5 a.u. is slightly higher than the others (Fig. 9(b)).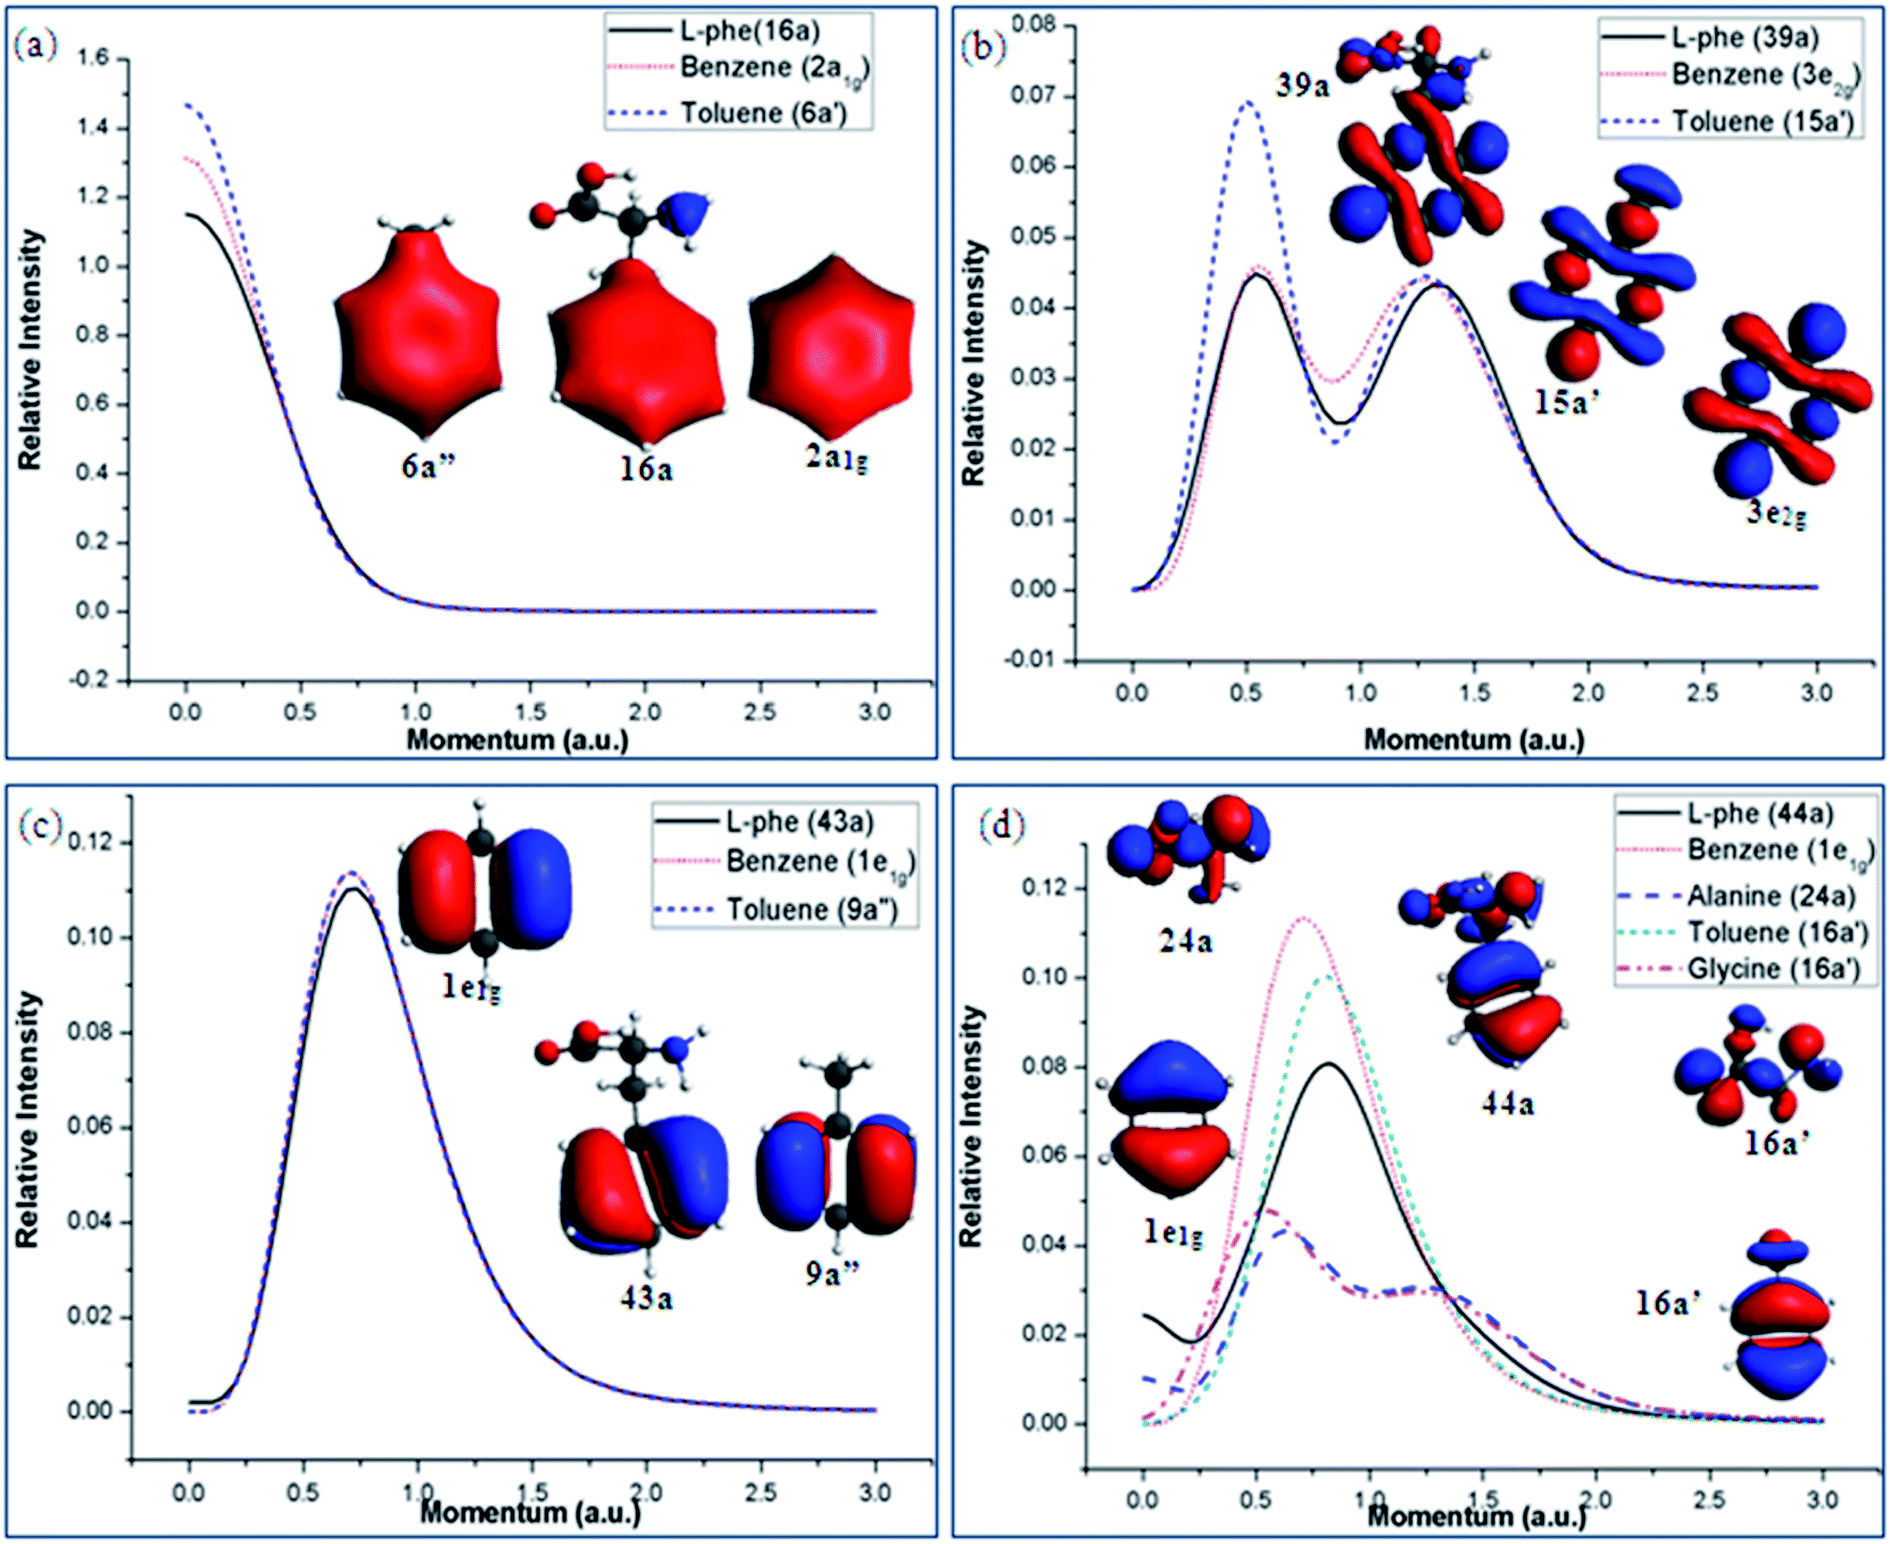 | ||
| Fig. 9 Selected valence orbital electron densities and TMDs of the Phe and its fragments showing related chemical bonding characteristics. | ||
The vertical valence spectra (in position space) in Fig. 6 and 7 reveal that the outermost or frontier MOs of Phe are little affected by the fragment schemes. This is verified by the orbital momentum spectra given in Fig. 9(c) and (d). In Fig. 9(c) the orbital densities of the io MOs of Phe (43a), toluene (9a′′) and benzene (degenerate 1e1g) display similar ‘π2’ natures and hence present almost identical bell shaped p-like momentum spectra. Fig. 9(d) reports the orbital densities and TMDs of HOMO in Phe (44a) and the fragment molecules. Despite similar TMDs in Phe and its phenyl fragments (1e1g of benzene and 16a′ of toluene), contributions from the HOMOs of the amino acids, orbital 24a of alanine and orbital 16a′ of glycine, show in the long range region of <0.5 a.u. and again prefers the A/B scheme. It suggests that the phenyl fragment is very active in the chemical bonding mechanisms of Phe, as found by many other biological studies. The dominance of amino acid components are focused in the lower momentum (long range) region of the HOMO TMD in Phe, indicating that the amino acids play a more important role in the long range interaction region.
The valence spectrum of Phe in Fig. 6 show that the synthetic spectrum from the G/T scheme matches better in the energy region of 14 eV < IE < 20 eV than the A/B scheme. Fig. 10 (a)–(d) presents the orbital TMDs of selected orbitals in this energy range. The TMDs of orbital 22a of Phe in Fig. 10(a) and (b) indeed show that this orbital is better produced by the 9a′ orbital of toluene and 10a′ of glycine in the G/T scheme rather than the A/B scheme, as the A/B scheme is unable to produce the TMDs in small momentum region of <0.5 eV. In Fig. 10(c), the TMDs of orbital 27a of Phe are compared with the TMDs of orbital 15a of alanine and orbital 12a′ of glycine. It is obvious that this orbital of Phe receives a dominant contribution from orbital 12a′ of glycine. In this case, the orbital TMDs of Phe displays a hybrid s–p distribution and with significant contributions from the orbital 12a′ of glycine in the lower momentum region <0.5 a.u. Orbital 29a of Phe is also closely correlated to the 11a′ orbital of toluene as indicated in Fig. 10(d). Other orbitals of Phe such as orbitals 38a and 40a are dominated by the A/B fragment scheme, which has been discussed previously.12 As a result, the Phe molecule can be considered by different fragment schemes, which in return, can serve as different channels upon dissociation.
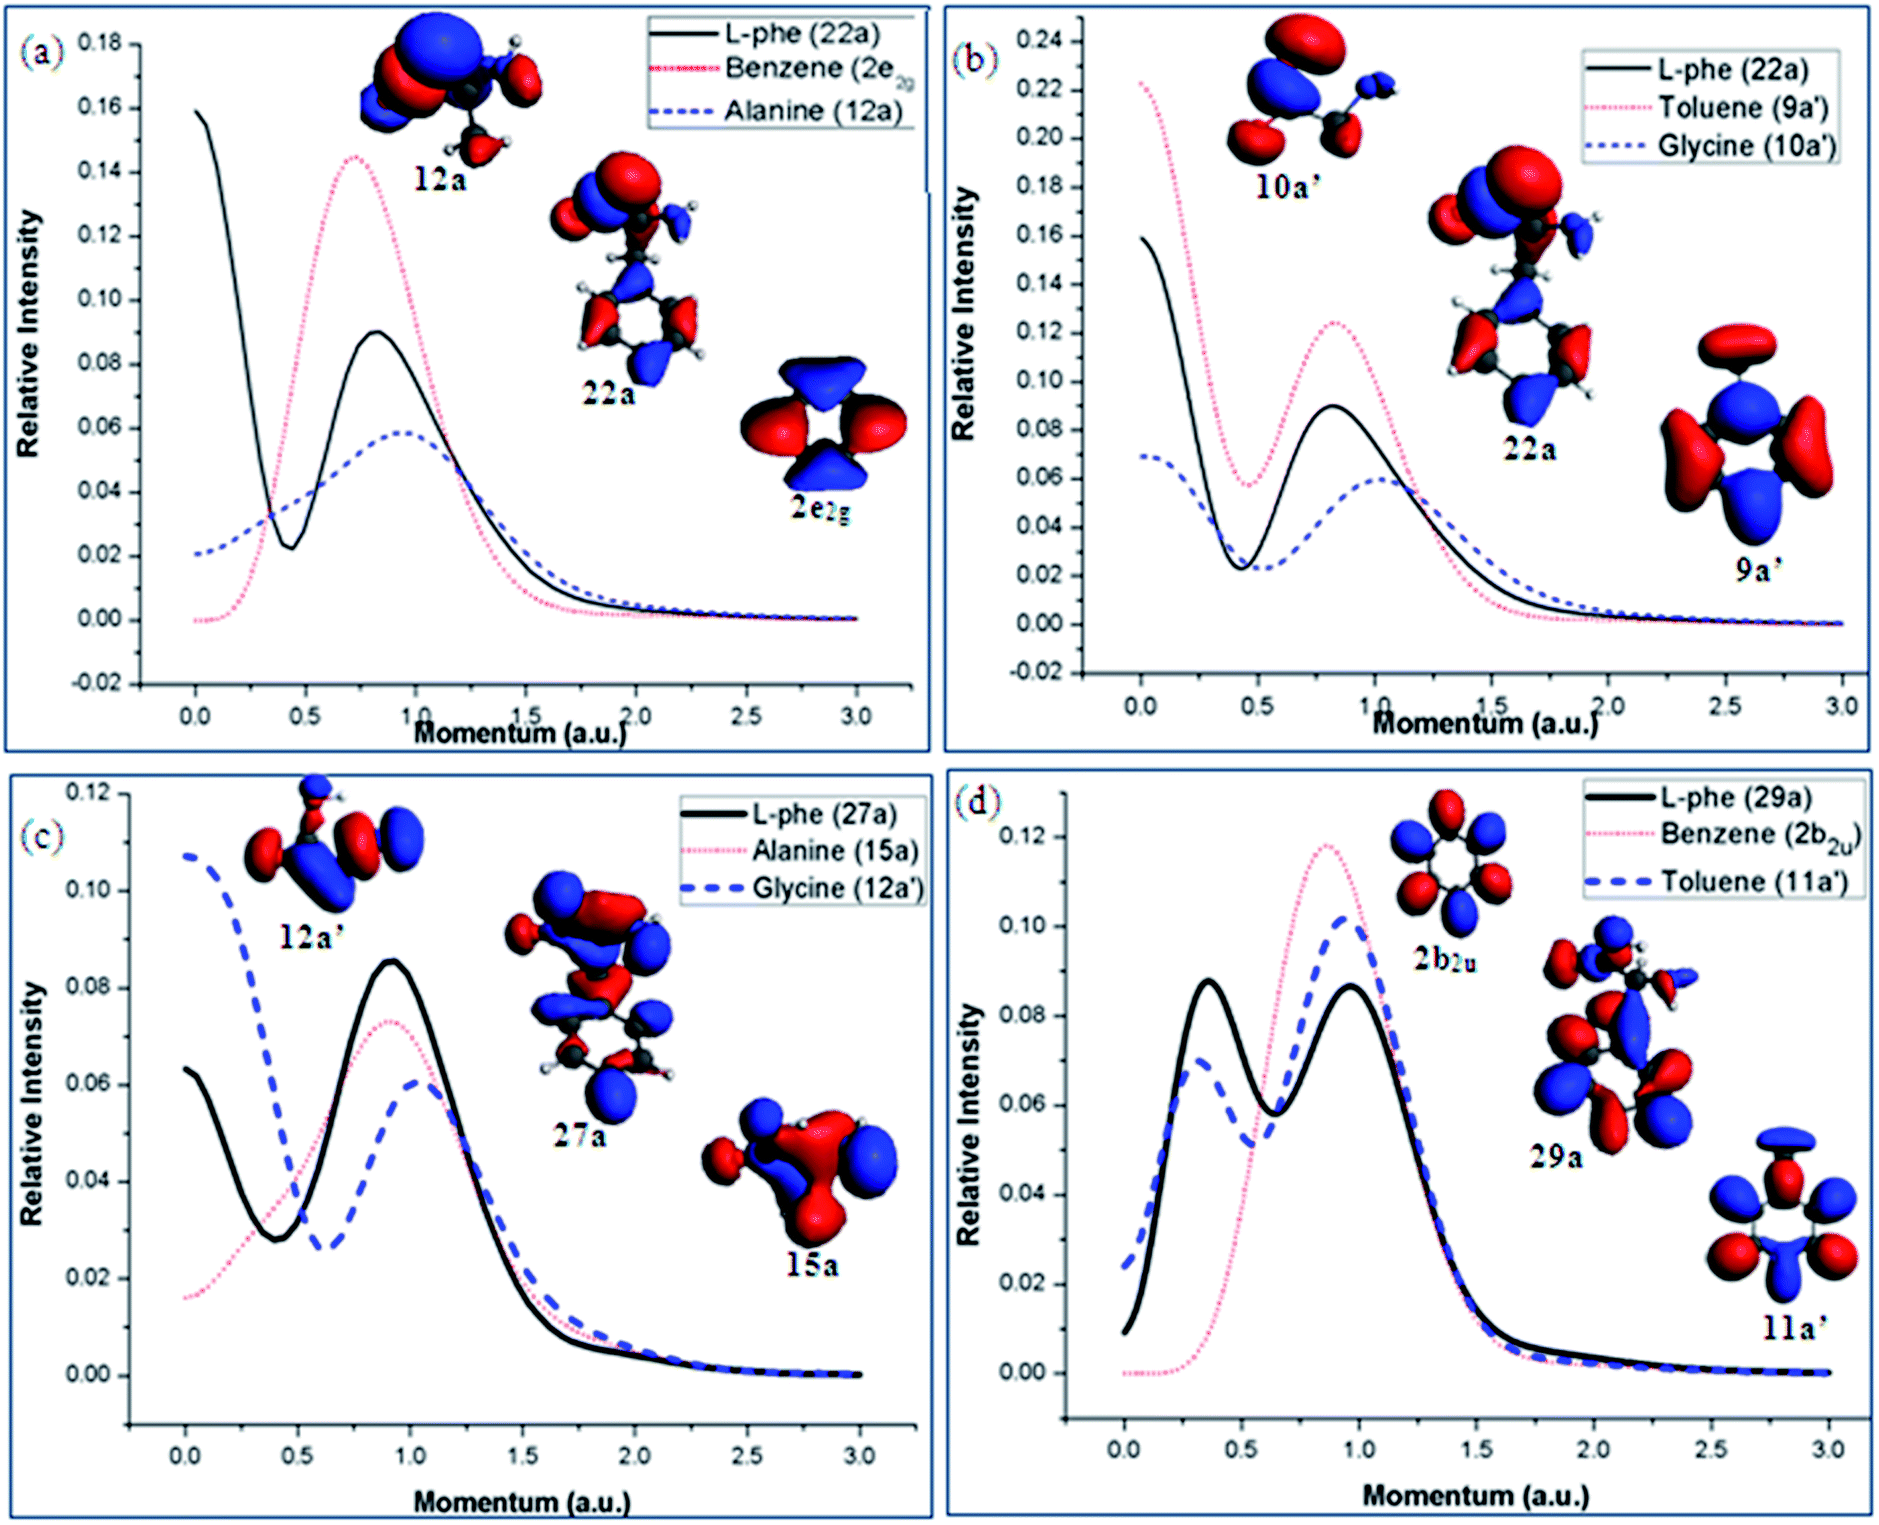 | ||
| Fig. 10 Orbital densities and TMDs of the selected valence MOs of Phe those are dominated by the G/T scheme in energy region of 14 eV < IE < 20 eV. | ||
Conclusions
The significance of fragments-in-molecule approach in deeper understanding of the electronic structure of phenylalanine (Phe) has been described using extensive correlated analyses of valence ionization energies and spectra (in position space) and orbitals (in momentum space). The electronic structure of Phe is studied using two sets of amino acid contained fragment schemes, the alanine/benzene (A/B scheme) scheme and the glycine/toluene scheme (G/T scheme) with focus on the latter scheme. Density functional theory (DFT) based and Green functional based quantum mechanical calculations are employed to calculate the binding energy spectra. In the core space, the ionization energies (IE) of Phe are calculated using vertical and ΔDFT methods. No significant differences (after shift) are obtained, indicating that the orbital relaxation effects have limited impact on the spectra. In the valence space, OVGF and SAOP models are employed to calculate the vertical spectra of Phe and its fragment molecules in the outer valence space and the complete valence space, respectively. The calculated spectra agree well with available experimental measurements.It is found that in valence space, the inner valence region (IE > 20 eV) and the outer valence region (IE < 11 eV) of Phe show less fragment scheme dependent characters. Both the A/B scheme and G/T scheme provide a good description of the binding energy spectrum of Phe. The strong chemical bonding character of Phe seems to appear in middle valence region of 11–20 eV, which largely shows the dependency of the fragment schemes. The valence energy region of 14 < IE < 20 eV in Phe is dominated by the G/T scheme, whereas the valence space of 11 < IE < 14 eV is dominated by the A/B scheme. These observations are confirmed using combined information in position and momentum space in dual space analysis (DSA). As a result, the ‘fragments-in-molecules’ approach can be helpful to understand the electronic structures and intra-molecular interactions of larger bio-molecules, thus implicating rational chemical design for potential applications.
Acknowledgements
The authors acknowledge the Australian Research Council (ARC) and Swinburne University of Technology for the Postgraduate Scholarship for AG. The National Computational Infrastructure (NCI) through Merit Allocation Scheme (MAS) and Swinburne Supercomputer Facilities are acknowledged for the supercomputing facilities. AG acknowledges the Australia Awards Endeavour Research Grant that supports his work at the Australian National University (ANU). AG also thanks Prof. Michelle Coote for her hospitality during his stay at ANU.References
- L. M. Ghiringhelli and L. Delle Site, J. Am. Chem. Soc., 2008, 130, 2634–2638 CrossRef CAS PubMed.
- A. Kaczor, I. D. Reva, L. M. Proniewicz and R. Fausto, J. Phys. Chem. A, 2006, 110, 2360–2370 CrossRef CAS PubMed.
- Z. Huang, W. Yu and Z. Lin, J. Mol. Struct.: THEOCHEM, 2006, 758, 195–202 CrossRef CAS PubMed.
- T. Hashimoto, Y. Takasu, Y. Yamada and T. Ebata, Chem. Phys. Lett., 2006, 421, 227–231 CrossRef CAS PubMed.
- W. Zhang, V. Carravetta, O. Plekan, V. Feyer, R. Richter, M. Coreno and K. C. Prince, J. Chem. Phys., 2009, 131, 035103–035111 CrossRef PubMed.
- S. J. Martinez Iii, J. C. Alfano and D. H. Levy, J. Mol. Spectrosc., 1992, 156, 421–430 CrossRef.
- L. C. Snoek, E. G. Robertson, R. T. Kroemer and J. P. Simons, Chem. Phys. Lett., 2000, 321, 49–56 CrossRef CAS.
- K. T. Lee, J. Sung, K. J. Lee, S. K. Kim and Y. D. Park, J. Chem. Phys., 2002, 116, 8251–8254 CrossRef CAS PubMed.
- K. T. Lee, J. Sung, K. J. Lee, S. K. Kim and Y. D. Park, Chem. Phys. Lett., 2003, 368, 262–268 CrossRef CAS.
- K. T. Lee, J. Sung, K. J. Lee, Y. D. Park and S. K. Kim, Angew. Chem., Int. Ed., 2002, 41, 4114–4117 CrossRef CAS.
- Y. Lee, J. Jung, B. Kim, P. Butz, L. C. Snoek, R. T. Kroemer and J. P. Simons, J. Phys. Chem. A, 2003, 108, 69–73 CrossRef.
- A. Ganesan, F. Wang and C. Falzon, J. Comput. Chem., 2011, 32, 525–535 CrossRef CAS PubMed.
- A. Ganesan and F. Wang, J. Chem. Phys., 2009, 131, 044321–044329 CrossRef PubMed.
- A. Ganesan, M. Brunger and F. Wang, Nucl. Instrum. Methods Phys. Res., Sect. A, 2010, 619, 143–146 CrossRef CAS PubMed.
- D. M. Close, J. Phys. Chem. A, 2011, 115, 2900–2912 CrossRef CAS PubMed.
- K. Y. Baek, M. Hayashi, Y. Fujimura, S. H. Lin and S. K. Kim, J. Phys. Chem. A, 2010, 114, 7583–7589 CrossRef CAS PubMed.
- G. Cooper, M. Gordon, D. Tulumello, C. Turci, K. Kaznatcheev and A. P. Hitchcock, J. Electron Spectrosc. Relat. Phenom., 2004, 137–140, 795–799 CrossRef CAS PubMed.
- O. Plekan, V. Feyer, R. Richter, M. Coreno and K. C. Prince, Mol. Phys., 2008, 106, 1143–1153 CrossRef CAS.
- S. Kalyaanamoorthy and Y.-P. P. Chen, J. Mol. Graphics Modell., 2013, 44, 44–53 CrossRef CAS PubMed.
- S. Kalyaanamoorthy and Y.-P. P. Chen, J. Comput. Chem., 2013, 34, 2270–2283 CrossRef CAS PubMed.
- A. Ganesan, J. Dreyer, F. Wang, J. Akola and J. Larrucea, J. Mol. Graphics Modell., 2013, 45, 180–191 CrossRef CAS PubMed.
- A. Ganesan, N. Mohammadi and F. Wang, RSC Adv., 2014, 4, 8617–8626 RSC.
- M. Remko, D. Fitz, R. Broer and B. Rode, J. Mol. Model., 2011, 1–12 Search PubMed.
- A. Rimola, L. Rodríguez-Santiago and M. Sodupe, J. Phys. Chem. B, 2006, 110, 24189–24199 CrossRef CAS PubMed.
- P. Rodziewicz and N. L. Doltsinis, ChemPhysChem, 2007, 8, 1959–1968 CrossRef CAS PubMed.
- G. Duan, V. H. Smith and D. F. Weaver, Int. J. Quantum Chem., 2002, 90, 669–683 CrossRef CAS.
- S. Campbell, E. M. Marzluff, M. T. Rodgers, J. L. Beauchamp, M. E. Rempe, K. F. Schwinck and D. L. Lichtenberger, J. Am. Chem. Soc., 1994, 116, 5257–5264 CrossRef CAS.
- K. Seki and H. Inokuchi, Chem. Phys. Lett., 1979, 65, 158–160 CrossRef CAS.
- P. H. Cannington and N. S. Ham, J. Electron Spectrosc. Relat. Phenom., 1979, 15, 79–82 CrossRef CAS.
- P. H. Cannington and N. S. Ham, J. Electron Spectrosc. Relat. Phenom., 1983, 32, 139–151 CrossRef CAS.
- S. Campbell, J. L. Beauchamp, M. Rempe and D. L. Lichtenberger, Int. J. Mass Spectrom. Ion Processes, 1992, 117, 83–99 CrossRef CAS.
- V. Carravetta, O. Plashkevych and H. Agren, J. Chem. Phys., 1998, 109, 1456–1464 CrossRef CAS PubMed.
- L. Yang, O. Plashkevytch, O. Vahtras, V. Carravetta and H. Agren, J. Synchrotron Radiat., 1999, 6, 708–710 CrossRef CAS PubMed.
- V. Vorsa, T. Kono, K. F. Willey and N. Winograd, J. Phys. Chem. B, 1999, 103, 7889–7895 CrossRef CAS.
- L. Selvam, V. Vasilyev and F. Wang, J. Phys. Chem. B, 2009, 113, 11496–11504 CrossRef CAS PubMed.
- A. Arachchilage, Y. Wang and F. Wang, Theor. Chem. Acc., 2011, 130, 965–979 CrossRef CAS PubMed.
- A. P. W. Arachchilage, F. Wang, V. Feyer, O. Plekan and K. C. Prince, J. Chem. Phys., 2010, 133, 174319 CrossRef PubMed.
- M. Ahmed, A. Ganesan, F. Wang, V. Feyer, O. Plekan and K. C. Prince, J. Phys. Chem. A, 2012, 116, 8653–8660 CrossRef CAS PubMed.
- C. T. Falzon and F. Wang, J. Chem. Phys., 2005, 123, 214307–214312 CrossRef PubMed.
- C. T. Falzon, F. Wang and W. Pang, J. Phys. Chem. B, 2006, 110, 9713–9719 CrossRef CAS PubMed.
- S. Saha, F. Wang, C. T. Falzon and M. J. Brunger, J. Chem. Phys., 2005, 123, 124315 CrossRef PubMed.
- F. Wang and M. Ahmed, Mol. Simul., 2014, 1–25 Search PubMed.
- F. Wang, J. Phys. Chem. A, 2003, 107, 10199–10207 CrossRef CAS.
- R. F. W. Bader, Atoms in Molecules: A Quantum Theory, Oxford University Press, Incorporated, 1994 Search PubMed.
- P. L. A. Popelier, Atoms in Molecules: An Introduction, Prentice Hall PTR, 2000 Search PubMed.
- V. S. Cherkasov and O. N. Vylegzhanin, J. Struct. Chem., 1979, 20, 666–669 CrossRef.
- Y. V. Chizhov, M. M. Timoshenko, V. I. Kleimenov, Y. A. Borisov, G. P. Zol'nikova, D. N. Kravtsov and I. I. Kritskaya, J. Struct. Chem., 1986, 27, 401–406 CrossRef.
- G. Cavigliasso and D. P. Chong, J. Chem. Phys., 1999, 111, 9485–9492 CrossRef CAS PubMed.
- Y. Takahata and D. P. Chong, J. Electron Spectrosc. Relat. Phenom., 2003, 133, 69–76 CrossRef CAS PubMed.
- O. V. Gritsenko, P. R. T. Schipper and E. J. Baerends, Chem. Phys. Lett., 1999, 302, 199–207 CrossRef CAS.
- L. S. Cederbaum and W. Domcke, in Advances in Chemical Physics, John Wiley & Sons, Inc., 2007, pp. 205–344 Search PubMed.
- M. J. Frisch, G. W. Trucks, H. B. Schlegel, G. E. Scuseria, M. A. Robb, J. R. Cheeseman, J. A. Montgomery, T. Vreven, K. N. Kudin, J. C. Burant, J. M. Millam, S. S. Iyengar, J. Tomasi, V. Barone, B. Mennucci, M. Cossi, G. Scalmani, N. Rega, G. A. Petersson, H. Nakatsuji, M. Hada, M. Ehara, K. Toyota, R. Fukuda, J. Hasegawa, M. Ishida, T. Nakajima, Y. Honda, O. Kitao, H. Nakai, M. Klene, X. Li, J. E. Knox, H. P. Hratchian, J. B. Cross, V. Bakken, C. Adamo, J. Jaramillo, R. Gomperts, R. E. Stratmann, O. Yazyev, A. J. Austin, R. Cammi, C. Pomelli, J. W. Ochterski, P. Y. Ayala, K. Morokuma, G. A. Voth, P. Salvador, J. J. Dannenberg, V. G. Zakrzewski, S. Dapprich, A. D. Daniels, M. C. Strain, O. Farkas, D. K. Malick, A. D. Rabuck, K. Raghavachari, J. B. Foresman, J. V. Ortiz, Q. Cui, A. G. Baboul, S. Clifford, J. Cioslowski, B. B. Stefanov, G. Liu, A. Liashenko, P. Piskorz, I. Komaromi, R. L. Martin, D. J. Fox, T. Keith, A. Laham, C. Y. Peng, A. Nanayakkara, M. Challacombe, P. M. W. Gill, B. Johnson, W. Chen, M. W. Wong, C. Gonzalez and J. A. Pople, Gaussian 03, Revision C.02, Gaussian, Inc., Wallingford, CT, 2004 Search PubMed.
- M. J. Frisch, G. W. Trucks, H. B. Schlegel, G. E. Scuseria, M. A. Robb, J. R. Cheeseman, G. Scalmani, V. Barone, B. Mennucci, G. A. Petersson, H. Nakatsuji, M. Caricato, X. Li, H. P. Hratchian, A. F. Izmaylov, J. Bloino, G. Zheng, J. L. Sonnenberg, M. Hada, M. Ehara, K. Toyota, R. Fukuda, J. Hasegawa, M. Ishida, T. Nakajima, Y. Honda, O. Kitao, H. Nakai, T. Vreven, J. A. Montgomery, J. E. Peralta, F. Ogliaro, M. Bearpark, J. J. Heyd, E. Brothers, K. N. Kudin, V. N. Staroverov, R. Kobayashi, J. Normand, K. Raghavachari, A. Rendell, J. C. Burant, S. S. Iyengar, J. Tomasi, M. Cossi, N. Rega, J. M. Millam, M. Klene, J. E. Knox, J. B. Cross, V. Bakken, C. Adamo, J. Jaramillo, R. Gomperts, R. E. Stratmann, O. Yazyev, A. J. Austin, R. Cammi, C. Pomelli, J. W. Ochterski, R. L. Martin, K. Morokuma, V. G. Zakrzewski, G. A. Voth, P. Salvador, J. J. Dannenberg, S. Dapprich, A. D. Daniels, Ö. Farkas, J. B. Foresman, J. V. Ortiz, J. Cioslowski and D. J. Fox, Gaussian 09, Revision D.01, Gaussian, Inc., Wallingford CT, 2009 Search PubMed.
- G. te Velde, F. M. Bickelhaupt, E. J. Baerends, C. Fonseca Guerra, S. J. A. van Gisbergen, J. G. Snijders and T. Ziegler, J. Comput. Chem., 2001, 22, 931–967 CrossRef CAS.
- A. Ganesan, F. Wang, M. Brunger and K. Prince, J. Synchrotron Radiat., 2011, 18, 733–742 CAS.
- Q. Zhu, F. Wang and E. P. Ivanova, J. Synchrotron Radiat., 2009, 16, 545–552 CrossRef CAS PubMed.
- S. Saha, F. Wang, J. B. MacNaughton, A. Moewes and D. P. Chong, J. Synchrotron Radiat., 2008, 15, 151–157 CrossRef CAS PubMed.
- M. Stener, G. Fronzoni and P. Decleva, J. Chem. Phys., 2005, 122, 234301–234311 CrossRef CAS PubMed.
- A. J. Yencha, R. I. Hall, L. Avaldi, G. Dawber, A. G. McConkey, M. A. MacDonald and G. C. King, Can. J. Chem., 2004, 82, 1061–1066 CrossRef CAS.
- L. J. Medhurst, T. A. Ferrett, P. A. Heimann, D. W. Lindle, S. H. Liu and D. A. Shirley, J. Chem. Phys., 1988, 89, 6096–6102 CrossRef CAS PubMed.
- S. A. Holmes and T. D. Thomas, J. Am. Chem. Soc., 1975, 97, 2337–2341 CrossRef CAS.
- W. L. Jolly, K. D. Bomben and C. J. Eyermann, At. Data Nucl. Data Tables, 1984, 31, 433–493 CrossRef CAS.
- F. Wang, J. Phys. Chem. B, 2007, 111, 9628–9633 CrossRef CAS PubMed.
- O. Samardzic, M. J. Brunger, A. M. Grisogono and E. Weigold, J. Phys. B: At., Mol. Opt. Phys., 1993, 26, 3921 CrossRef CAS.
- I. Fuss, I. E. McCarthy, A. Minchinton, E. Weigold and F. P. Larkins, Chem. Phys., 1981, 63, 19–30 CrossRef CAS.
- L. Klasinc, B. Kovac and H. Gusten, Pure Appl. Chem., 1983, 55, 289–298 CrossRef CAS.
- O. Plekan, V. Feyer, R. Richter, M. Coreno, M. de Simone, K. C. Prince and V. Carravetta, J. Phys. Chem. A, 2007, 111, 10998–11005 CrossRef CAS PubMed.
Footnotes |
| † Electronic supplementary information (ESI) available. See DOI: 10.1039/c4ra09146a |
| ‡ Present address: Computer Aided Chemical Design, Research School of Chemistry, Australian National University, Canberra, Australian Capital Territory 0200, Australia. |
| This journal is © The Royal Society of Chemistry 2014 |