Fabrication, gradient extraction and surface polarity-dependent photoluminescence of cow milk-derived carbon dots†
Shuai Hana,
He Zhangb,
Jian Zhangc,
Yujie Xiea,
Liangliang Liua,
Hangxing Wanga,
Xiangkai Lia,
Weisheng Liua and
Yu Tang*a
aKey Laboratory of Nonferrous Metal Chemistry and Resources Utilization of Gansu Province, State Key Laboratory of Applied Organic Chemistry, College of Chemistry and Chemical Engineering, Lanzhou University, Lanzhou 730000, P. R. China. E-mail: tangyu@lzu.edu.cn; Fax: +86-931-891-2582
bSchool of Life Sciences, Lanzhou University, Lanzhou 730000, P. R. China
cDepartment of Chemistry, University of Nebraska-Lincoln, Lincoln, NE 68588-0304, USA
First published on 29th October 2014
Abstract
Cow milk-derived carbon dots (CMCD) were separated using a simple and cheap “gradient extraction” method, which was applied for the first time in nanomaterials' separation. The surface polarity of the extracted CMCD correlates well with the polarity of the extraction solvent. Interestingly, the surface polarity also affects the photoluminescence (PL) of CMCD: a red-shift of PL was observed as the surface polarity increased, which was attributed to the increasing amount of polar functional groups on the surface as auxochromes which are bound to graphitic sp2 clusters and reduce their energy gaps. Furthermore, as the surface polarity of CMCD increases, their PL exhibits longer lifetimes and a stronger excitation-dependency, which are attributed to the more efficient “internal” energy transfer from the auxochrome-poor sp2 clusters to the auxochrome-rich sp2 clusters of the CMCD.
Introduction
As an emerging class of photoluminescent nanomaterials, carbon dots (CD) have drawn much attention due to their outstanding photostability,1 low cytotoxicity,2 high biocompatibility, and interesting electron transfer behavior.3,4 As this research field evolves, it becomes clear that the surface chemistry of CD significantly affects their optical properties5 and, consequently, their applicability in light emitting nanocomposites,6 bioimaging,7 fluorescent inks,8 and so on. Therefore, it is of great importance to accurately control the surface functionality of CD. Toward this goal, several strategies have been developed to tune the surface chemistry of the as-prepared CD, such as reduction with NaBH4,9 electrochemical method,10 modifying with different alkylamines,11 and so on. However, obtaining CD with various chemical groups by separation technology has seldom been done in the literature. Accordingly, there is of particular significance to develop simple separation methods suitable for controlling the surface chemistry of CD.Recently, bio-precursors such as banana juice,12 orange juice,13 grass14 have been frequently used to fabricate CD via hydrothermal carbonization due to their low cost, easy availability, and nearly unlimited resource. On the other hand, as prepared CD, particularly those fabricated from bio-precursors, are usually a mixture of carbon nanoparticles that have proven to be of great challenge to separate. Preparation of CD with uniform particle sizes and surface properties are therefor important to understand the formation mechanism and the structure–activity relationship of CD,13 which is also of great benefit to their subsequent industrial applications. Several methods, including polyacrylamide gel electrophoresis,15 molecular weight cutoff membranes dialysis,16,17 and differential centrifugation,10 have been recently utilized based on the difference of CD's size or surface charge. However, surface polarity of CD has rarely been studied or utilized in their purification or separation.18
Herein, we describe a simple “gradient extraction” method to separate cow milk-derived CD (CMCD) based on surface polarity, which is used for the first time to separate nanomaterials. We found an interesting correlation between surface polarity and photoluminescence (PL) properties of CMCD: as surface polarity of CD increases, their PL peak progressively red-shifts and exhibits longer lifetime and greater excitation-dependency. The corresponding PL mechanism was discussed in detail. Our work provides a new method to investigate the surface chemistry of carbon nanomaterials and additional insights of the luminescence mechanism of CD. A schematic illustration of the fabrication, gradient extraction, and surface polarity-dependent PL of the CMCD is shown in Scheme 1.
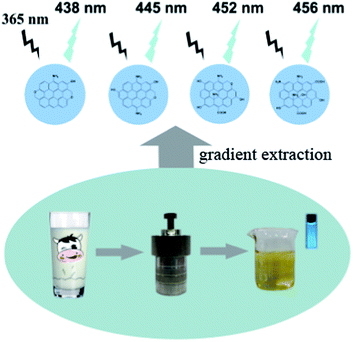 | ||
| Scheme 1 Schematic illustration of the fabrication, gradient extraction, and surface polarity-dependent PL of CMCD. PL photo was taken under irradiation at 365 nm. | ||
Experimental details
Materials
The cow milk was obtained from the Inner Mongolia Yili Industrial Group Co., LTD. Hexane, carbon tetrachloride, dichloromethane and other chemicals were obtained from commercial sources and used as received. Distilled water was used throughout the experiments.Characterization
Transmission electron microscopy (TEM) was performed on a JEOL-2010 TEM at 200 kV. Fourier transform infrared (FTIR) spectra were collected within the 4000–400 cm−1 wavenumber range using a Nicolet 360 FTIR spectrometer with the KBr pellet technique. X-ray photoelectron spectroscopy (XPS) measurements were conducted using an ESCALAB 250 spectrometer with mono Al Kα radiation (hν = 1486.6 eV), and the binding energy calibration was based on C1s at 284.6 eV. The UV-vis absorption spectra were recorded on a Perkin-Elmer Lambda 950 spectrophotometer. Elemental analysis was performed on Elementar Vario MICRO CUBE, and the average values were obtained by measuring three batches of sample. Excitation and emission spectra were collected using a Hitachi F-4500 Fluorescence spectrophotometer. The PL lifetime and quantum yield (QY) were measured on an Edinburgh Instruments FSL920 fluorescence spectrometer, with a 450 W Xe arc lamp as the steady-state excitation source. Nanosecond fluorescence lifetimes were measured by the time correlated single-photon counting (TCSPC) system under right-angle sample geometry using a white light laser as the excitation source. The quantum yield (QY) of CD was measured according to previously established procedure by comparing their integrated PL intensities, and quinine sulfate in 0.1 M H2SO4 (literature quantum yield 0.54 at 360 nm) was used as a standard.19Results and discussions
Fabrication and characterization of CMCD
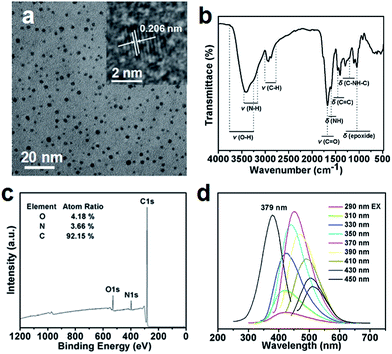
CMCD were prepared using hydrothermal treatment of cow milk at 180 °C for the first time as an abundant, natural, and renewable carbon source (see details in ESI,† yield: ca. 34.5%). The structural characterization of the CMCD was described in detail in ESI (Table S1 and Fig. S1 and 2†). The formation of CMCD is believed to involve denaturing, breakage, and carbonization of the constituents of cow milk, such as sugar, proteins, and lipids, similar to that in the formation of egg-derived CD.20 The TEM image (Fig. 1a) and particle size distribution of CMCD (Fig. S3†) indicate a uniform size (diameter: 2–5 nm) without apparent aggregation. High resolution TEM (HRTEM) image reveals the lattice fringes of CMCD to be 0.206 nm (Fig. 1a), which agrees well with the 〈102〉 spacing of graphitic (sp2) carbon. The FTIR spectrum (Fig. 1b) shows the stretching of O–H and N–H at 3200–3700 cm−1, stretching of C–H at 2923 and 2850 cm−1, stretching of C![[double bond, length as m-dash]](https://www.rsc.org/images/entities/char_e001.gif) C at 1420 cm−1, bending of N–H at 1570 cm−1, and stretching of C
C at 1420 cm−1, bending of N–H at 1570 cm−1, and stretching of C![[double bond, length as m-dash]](https://www.rsc.org/images/entities/char_e001.gif) O at 1635 cm−1.21 X-ray photoelectron spectroscopy (XPS) analysis of C1s indicates three types of carbon atoms: graphitic or aliphatic (C
O at 1635 cm−1.21 X-ray photoelectron spectroscopy (XPS) analysis of C1s indicates three types of carbon atoms: graphitic or aliphatic (C![[double bond, length as m-dash]](https://www.rsc.org/images/entities/char_e001.gif) C and C–C), oxygenated, and nitrous (Fig. 1c and S4†).14 The UV-vis spectrum of the obtained CMCD (Fig. S5†) reveals a broad absorption band centered at 274 nm, which can be attributed to π–π* transition of C
C and C–C), oxygenated, and nitrous (Fig. 1c and S4†).14 The UV-vis spectrum of the obtained CMCD (Fig. S5†) reveals a broad absorption band centered at 274 nm, which can be attributed to π–π* transition of C![[double bond, length as m-dash]](https://www.rsc.org/images/entities/char_e001.gif) C bonds and n–π* transition of C
C bonds and n–π* transition of C![[double bond, length as m-dash]](https://www.rsc.org/images/entities/char_e001.gif) O bonds.22 Similar to previous reports,23 excitation-dependent PL behavior was also observed (Fig. 1d). PL quantum yield and average lifetime was measured to be 9.6% and 8.90 ns, respectively (Fig. S6†). The short lifetime indicates that the luminescence mechanism is radiative recombination of excitons.24 Additionally, the CMCD showed excellent photostability, their PL intensity did not change under continuous excitation (365 nm) with a Xe lamp for 5 h (Fig. S7†). The results reveal that the CMCD might be of great potential for labeling and imaging.23 It is noted that CMCD in aqueous solution exhibit pH-dependent PL properties (Fig. S8 and 9†): the PL intensity reaches the highest at pH = 7 and significantly decreases under both strong acidic and basic conditions. The detailed mechanism for the phenomenon is however not fully understood, this pH-dependent emission feature might be dependent on the protonation and deprotonation of surface functional groups of CMCD.17 The change of zeta potential from 5.07 mV to −30.1 mV with the pH increasing from 2.0 to 11.78 (Fig. S10†), helped to prove the protonation–deprotonation mechanism for the pH-dependent PL properties.25 The isoelectric point of the CMCD was found to be around 2.58, which indicated that the as-prepared CMCD are amphoteric, similar to previous reports.25
O bonds.22 Similar to previous reports,23 excitation-dependent PL behavior was also observed (Fig. 1d). PL quantum yield and average lifetime was measured to be 9.6% and 8.90 ns, respectively (Fig. S6†). The short lifetime indicates that the luminescence mechanism is radiative recombination of excitons.24 Additionally, the CMCD showed excellent photostability, their PL intensity did not change under continuous excitation (365 nm) with a Xe lamp for 5 h (Fig. S7†). The results reveal that the CMCD might be of great potential for labeling and imaging.23 It is noted that CMCD in aqueous solution exhibit pH-dependent PL properties (Fig. S8 and 9†): the PL intensity reaches the highest at pH = 7 and significantly decreases under both strong acidic and basic conditions. The detailed mechanism for the phenomenon is however not fully understood, this pH-dependent emission feature might be dependent on the protonation and deprotonation of surface functional groups of CMCD.17 The change of zeta potential from 5.07 mV to −30.1 mV with the pH increasing from 2.0 to 11.78 (Fig. S10†), helped to prove the protonation–deprotonation mechanism for the pH-dependent PL properties.25 The isoelectric point of the CMCD was found to be around 2.58, which indicated that the as-prepared CMCD are amphoteric, similar to previous reports.25
Gradient extraction process
We developed a “gradient extraction” process to separate CMCD based on their surface polarity (see details in ESI†). Four organic solvents: hexane (polarity: 0.06), carbon tetrachloride (polarity: 1.6), mixture of carbon tetrachloride and dichloromethane (v/v = 3![[thin space (1/6-em)]](https://www.rsc.org/images/entities/char_2009.gif) :
:![[thin space (1/6-em)]](https://www.rsc.org/images/entities/char_2009.gif) 2), dichloromethane (polarity: 3.4) were used to extract CMCD with different surface polarity in term. We denote these four fractions of extracted CMCD as E-CMCDa, E-CMCDb, E-CMCDc, and E-CMCDd, respectively. All the four fractions were redispersed in water before optical measurements. For a contract study, the raw CMCD was dispersed in hexane, carbon tetrachloride, carbon tetrachloride and dichloromethane (v/v = 3
2), dichloromethane (polarity: 3.4) were used to extract CMCD with different surface polarity in term. We denote these four fractions of extracted CMCD as E-CMCDa, E-CMCDb, E-CMCDc, and E-CMCDd, respectively. All the four fractions were redispersed in water before optical measurements. For a contract study, the raw CMCD was dispersed in hexane, carbon tetrachloride, carbon tetrachloride and dichloromethane (v/v = 3![[thin space (1/6-em)]](https://www.rsc.org/images/entities/char_2009.gif) :
:![[thin space (1/6-em)]](https://www.rsc.org/images/entities/char_2009.gif) 2), dichloromethane, separately. After removing the organic solvents, four contract fractions were redispersed in aqueous solution again and the PL properties were measured. It was shown that the organic solution dispersion process have no obvious effect on the PL properties of CMCD, which further indicated that the PL changement in the “gradient extraction” process would be originated from the separated CMCD itself.
2), dichloromethane, separately. After removing the organic solvents, four contract fractions were redispersed in aqueous solution again and the PL properties were measured. It was shown that the organic solution dispersion process have no obvious effect on the PL properties of CMCD, which further indicated that the PL changement in the “gradient extraction” process would be originated from the separated CMCD itself.
Structural analysis of E-CMCD
TEM images (Fig. 2) show that four fractions have similar narrow size distributions and morphologies (average diameters: 3.0, 3.3, 3.3, and 3.3 nm, respectively) (Fig. S11†), which indicates that the gradient separation had no significant effect on the morphology of CMCD. FTIR spectra (Fig. 3) show the intensity of the polar functional groups such as O–H/N–H (stretching, 3200–3700 cm−1) and C![[double bond, length as m-dash]](https://www.rsc.org/images/entities/char_e001.gif) O (stretching, 1630 cm−1)21 gradually increases as the polarity of extraction solvent increases. Conversely, the intensity of less polar functional groups such as C–H (stretching, 2923 and 2850 cm−1), C
O (stretching, 1630 cm−1)21 gradually increases as the polarity of extraction solvent increases. Conversely, the intensity of less polar functional groups such as C–H (stretching, 2923 and 2850 cm−1), C![[double bond, length as m-dash]](https://www.rsc.org/images/entities/char_e001.gif) C (1420 cm−1), and C–O–C (1100 cm−1)23 decreases. XPS survey spectra also indicate that the number of surface heteroatoms of the CMCD fractions increases as polar functional groups increase (Fig. 4a–d). High-resolution XPS spectra of C1s (Fig. S12† and Table 1) provide a consistent result: as the polarity of extraction solvent increases, the number of sp2-carbons functionalized with carbonyl and amine moieties on the surface increases. Therefore, a possible mechanism of separating CMCD using “gradient extraction” was proposed (Fig. S13†): as the polarity of extraction solvent increases, the CMCD fractions with gradient surface polarities were separated from the as prepared CMCD. In other words, the surface-polarity of the extracted CMCD correlates with the polarity of the extraction solvent and increases as the order of E-CMCDa < E-CMCDb < E-CMCDc < E-CMCDd.
C (1420 cm−1), and C–O–C (1100 cm−1)23 decreases. XPS survey spectra also indicate that the number of surface heteroatoms of the CMCD fractions increases as polar functional groups increase (Fig. 4a–d). High-resolution XPS spectra of C1s (Fig. S12† and Table 1) provide a consistent result: as the polarity of extraction solvent increases, the number of sp2-carbons functionalized with carbonyl and amine moieties on the surface increases. Therefore, a possible mechanism of separating CMCD using “gradient extraction” was proposed (Fig. S13†): as the polarity of extraction solvent increases, the CMCD fractions with gradient surface polarities were separated from the as prepared CMCD. In other words, the surface-polarity of the extracted CMCD correlates with the polarity of the extraction solvent and increases as the order of E-CMCDa < E-CMCDb < E-CMCDc < E-CMCDd.
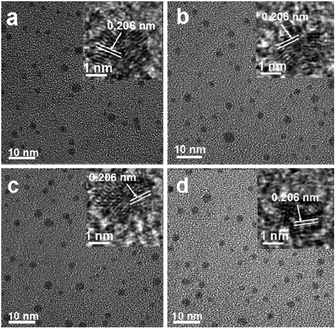 | ||
| Fig. 2 TEM images (inset: HRTEM images) of four E-CMCD fractions. (a), E-CMCDa. (b), E-CMCDb. (c), E-CMCDc. (d), E-CMCDd. | ||
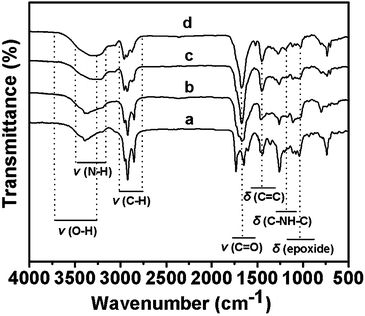 | ||
| Fig. 3 FTIR spectra of four E-CMCD fractions. (a), E-CMCDa. (b), E-CMCDb. (c), E-CMCDc. (d), E-CMCDd. | ||
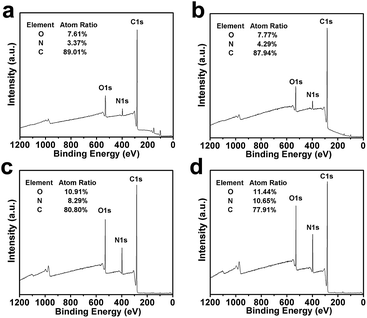 | ||
| Fig. 4 XPS spectra of the four E-CMCD fractions. (a), E-CMCDa. (b), E-CMCDb. (c), E-CMCDc. (d), E-CMCDd. | ||
| Peak | Position | E-CMCDa | E-CMCDb | E-CMCDc | E-CMCDd |
|---|---|---|---|---|---|
C–C/C![[double bond, length as m-dash]](https://www.rsc.org/images/entities/char_e001.gif) C C |
284.6 ev | 81.1% | 77.8% | 75.4% | 70.5% |
| C–N | 285.7 ev | — | 14.6% | 11.3% | 8.0% |
| C–O | 286.1 ev | 15.9% | 3.9% | 4.0% | 10.9% |
C=O/C![[double bond, length as m-dash]](https://www.rsc.org/images/entities/char_e001.gif) N N |
278.8 ev | 3.0% | 3.6% | 9.4% | 12.0% |
Surface polarity-dependent photoluminescence of E-CMCD
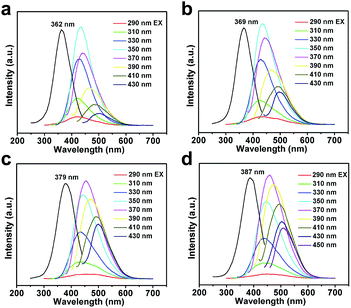
The PL of E-CMCD red-shifts as their surface polarity increases. For example, the emission maximum red-shifts from 438 nm (E-CMCDa) to 456 nm (E-CMCDd) (λex = 365 nm, see details in Table S2†). Correspondingly, the excitation maximum also exhibits red-shift from 362 nm to 387 nm (monitored at the corresponding emission maximum) (Fig. 5a–d). Clearly, new emission centers are generated as the surface polarity increases.10 We hypothesize that the polar groups are auxochromes that donate their lone pair electrons to the antibonding orbitals of the sp2 carbon clusters, which increases the liquidity of the electron cloud in the conjugation system and thus decreases their energy gap, and consequently, the optical spectrum red-shifts.26 Auxochrome-rich sp2 clusters also affect the absorption behavior. As shown in the UV/Vis spectra of the CMCD (Fig. S14†), the π–π* and n–π* transition absorption maximum red-shifts and becomes more pronounced as the surface polarity increases. Furthermore, the energy gaps of four E-CMCD fractions were measured using cyclic voltammetry, which indeed show a gradual decrease as surface polarity increases and is consistent with our hypothesis (see details in Fig. S15†).More interestingly, the surface polarity also affects the excitation-dependency of PL of the extracted CMCD. Excitation-dependent PL of CD is widely studied.27 However, we found that as the surface polarity increases, CMCD exhibit more pronounced excitation-dependent PL (Fig. 5 and S16†). For example, the maximum emission intensity of the least auxochrome-rich E-CMCDa decreases rapidly as λex shifts away from the maximum excitation: 87% decrease of the emission intensity when monitored at 430 nm (∼70 nm longer than the maximum excitation, Fig. S16a†). In contrast, the maximum emission intensity of the most auxochrome-rich E-CMCDd decreases much slowly: only 50% decrease of the emission intensity when monitored at 450 nm (∼70 nm longer than the maximum excitation, Fig. S16d†). Previous reports have attributed the excitation-dependent PL of CD to quantum effect, surface states, zigzag sites, and so on.9 Our study, however, provides new evidence that the surface polar groups (auxochromes) are related to the excitation-dependent PL. CMCD contain a significant amount of graphitic (sp2) clusters, and the energy gaps of which decrease in the presence of auxochromes. For the E-CMCD with less surface polarity, fewer auxochromes leads to a small change of the energy gap, so the excitation-dependent emission of the CMCD is not obvious.28 As the surface polarity increases, more surface sp2 clusters are attached with auxochromes. As a result, the energy gaps of the surface sp2 clusters become increasingly complicated, and resulting in a much pronounced excitation-dependent PL.
Time-resolved PL spectra of four E-CMCD fractions were recorded (λex = 365 nm) (Fig. S17† and Table 2) and fitted as three-component exponential decay functions, which all contain one fast and two slow components. The average of these three components can be correlated to the energy transfer process among the sp2 clusters with different energy gaps.29 As shown in Table 2, the average lifetime of the E-CMCD fractions each increases as its surface polarity increases. We propose a plausible explanation using the “internal” energy transfer theory. CMCD contain a significant amount of graphitic (sp2) clusters, which can be classified as auxochrome-rich (with electron donation from the auxochromes) or auxochrome-poor (less or no electron donation from the auxochromes). Auxochrome-poor sp2 clusters have wider energy gaps than auxochrome-rich ones, accordingly, the excitons generated by auxochrome-poor sp2 clusters have higher energy that can be readily transferred to auxochrome-rich ones. In the gradient extraction of CMCD, the amount of auxochrome-rich sp2 clusters increases as the surface polarity increases, which facilitates the “internal” energy transfer process (Fig. 6). Direct e−–h+ radiative recombination results in a shorter lifetime in the case of the auxochrome-poor sp2 clusters and slower e−–h+ pair localization at a surface state followed by a photon emission correlates with a longer lifetime for the auxochrome-rich sp2 clusters.30 Therefore, the lifetime increases as more auxochromes attach on the CMCD surface. Additionally, the emission maximum redshifts as their surface polarity increases, which is also consistent with the internal relaxation to lower-lying energy levels (Fig. 6).
| E-CMCDa | E-CMCDb | E-CMCDc | E-CMCDd | |
|---|---|---|---|---|
a Notes: The fluorescence decay curves which was determined at the excitation of 365 nm fitted to a three-exponential function and the average lifetime was calculated according to  . . |
||||
| τ1 (ns) | 0.51 (19.81%) | 0.59 (22.79%) | 0.81 (21.66%) | 0.90 (22.44%) |
| τ2 (ns) | 3.03 (36.37%) | 3.21 (41.12%) | 3.47 (51.17%) | 3.61 (51.77%) |
| τ3 (ns) | 8.83 (43.83%) | 9.41 (36.09%) | 11.03 (27.17%) | 12.18 (25.79%) |
| 〈τ〉 (ns) | 7.28 | 7.47 | 7.96 | 8.67 |
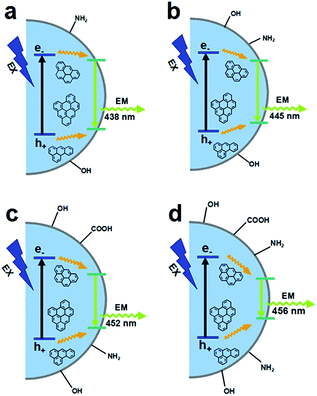 | ||
| Fig. 6 Schematic representation of PL mechanism for four E-CMCD fractions (λex = 365 nm). (a), E-CMCDa. (b), E-CMCDb. (c), E-CMCDc. (d), E-CMCDd. | ||
Further detailed mechanistic study is needed to fully understand the effects of photophysics of CD. Nevertheless, the gradient extraction provides a new and simple method to investigate the surface chemistry of CD. Furthermore, considering the surface functional groups play a crucial role in many fields such as adsorption,31 catalysis,32,33 and surface modifications34 of nanomaterials, it is reasonable to expect that the gradient extraction method can be used as a new approach for studying surface chemistry of other types of nanomaterials.
The PL behaviors of the four CMCD fractions were further investigated in different pH conditions. For an insight of the pH-dependent PL of the E-CMCD, it is worth to mention that cow milk is a natural weakly acidic mixture (pH = 6.5), which made the CMCD obtained to be a weakly acidic nanomaterials in aqueous solution (pH = 6.5). So, the “gradient extraction” is a separation process in weakly acidic condition, which might make the acidic type polar functional groups increase more obviously than the basic ones.35 For the E-CMCDa, it is observed that the PL intensity decreased as the pH increased (Fig. S18a†), and the phenomenon might be attributed to the protonation and deprotonation of the surface basic groups.25 However, as the surface polarity increased, more and more acidic functional groups appeared on the E-CMCD surface, which made the PL intensity of the E-CMCD fractions gradually decreased in acidic conditions. For the E-CMCDd, the PL intensity reaches the highest at pH = 7 in neutral condition and decreases remarkably under both acidic and basic conditions (Fig. S18d†), which might be originated from the coexisting of the surface basic and acidic functional groups.
Conclusions
In conclusion, we have developed a simple and cheap “gradient extraction” method for the separation of CMCD based on surface polarity. As the surface polarity increases, the photoluminescence of E-CMCD exhibits emission wavelength red-shift, longer lifetime, and increasingly excitation-dependency. An “internal” energy transfer process was proposed to explain these properties based on the increasing amount of auxochromes caused by the polar functional groups on the CD surfaces as the polarity increases. Our work provides a new insight into the luminescence mechanism of CD and is expected to pave a new way to study the surface chemistry and applications (such as PL pH sensors, doping in polymer thin films, modifying with functional molecules) of CD and other carbon nanomaterials.Acknowledgements
This work is supported by the National Natural Science Foundation of China (Project 21071068, 20931003). The authors are indebted to Wenbing Zhang (Feifan photography shop, Lanzhou) for taking photos. We thank Juan Feng, and Xia Deng for carrying out the XPS measurements, Prof. Haoli Zhang, Xue Wang and Nana Chai for their suggestions and assistance of cyclic voltammetry experiments, Dr Jiang Wu and Peng Wang for the use of lyophilizer and Dr Xinghua Li (Northwest University, Xi'an) for carrying out the TEM measurements.References
- K. Sanderson, Nature, 2009, 459, 760 CrossRef PubMed.
- P. Li, L. Huan, Y. Lin, L. Shen, Q. Chen and W. Shi, Nanotechnology, 2014, 25, 055603 CrossRef PubMed.
- M. K. Barman, B. Jana, S. Bhattacharyya and A. Patra, J. Phys. Chem. C, 2014, 118, 20034 CAS.
- D. Chowdhury, N. Gogoi and G. Majumdar, RSC Adv., 2012, 2, 12156 RSC.
- Q. H. Liang, W. J. Ma, Y. Shi, Z. Li and X. M. Yang, Carbon, 2013, 60, 421 CrossRef CAS PubMed.
- Y. P. Sun, X. Wang, F. Lu, L. Cao, M. J. Meziani, P. G. Luo, L. Gu and L. M. Veca, J. Phys. Chem. C, 2008, 112, 18295 CAS.
- H. Ding, P. Zhang, T. Y. Wang, J. L. Kong and H. M. Xiong, Nanotechnology, 2014, 25, 205604 CrossRef PubMed.
- S. Qu, X. Wang, Q. Lu, X. Liu and L. Wang, Angew. Chem., Int. Ed., 2012, 51, 12215 CrossRef CAS PubMed.
- H. Nie, M. Li, Q. Li, S. Liang, Y. Tan, L. Sheng, W. Shi and S. X. A. Zhang, Chem. Mater., 2014, 26, 3104 CrossRef CAS.
- L. Bao, Z. L. Zhang, Z. Q. Tian, L. Zhang, C. Liu, Y. Lin, B. Qi and D. W. Pang, Adv. Mater., 2011, 23, 5801 CrossRef CAS PubMed.
- Q. Mei, K. Zhang, G. Guan, B. Liu, S. Wang and Z. Zhang, Chem. Commun., 2010, 46, 7319 RSC.
- B. Dea and N. Karak, RSC Adv., 2013, 3, 8286 RSC.
- S. Sahu, B. Behera, T. K. Maiti and S. Mohapatra, Chem. Commun., 2012, 48, 8835 RSC.
- S. Liu, J. Tian, L. Wang, Y. Zhang, X. Qin, Y. Luo, A. M. Asiri, A. O. Al-Youbi and X. Sun, Adv. Mater., 2012, 24, 2037 CrossRef CAS PubMed.
- H. Liu, T. Ye and C. Mao, Angew. Chem., Int. Ed., 2007, 46, 6473 CrossRef CAS PubMed.
- Z. Zhang, J. Hao, J. Zhang, B. Zhang and J. Tang, RSC Adv., 2012, 2, 8599 RSC.
- Q. L. Zhao, Z. L. Zhang, B. H. Huang, J. Peng, M. Zhang and D. W. Pang, Chem. Commun., 2008, 5116 RSC.
- X. Jia, J. Li and E. Wang, Nanoscale, 2012, 4, 5572 RSC.
- F. Li, C. J. Liu, J. Yang, Z. Wang, W. G. Liu and F. Tian, RSC Adv., 2014, 4, 3201 RSC.
- J. Wang, C. F. Wang and S. Chen, Angew. Chem., Int. Ed., 2012, 51, 9297 CrossRef CAS PubMed.
- X. Lim, Y. Zhu, F. C. Cheong, N. M. Hanafiah, S. Valiyaveettil and C. H. Sow, ACS Nano, 2008, 2, 1389 CrossRef CAS PubMed.
- S. Mitra, S. Chandra, D. Laha, P. Patra, N. Debnath, A. Pramanik, P. Pramanik and A. Goswami, Mater. Res. Bull., 2012, 47, 586 CrossRef CAS PubMed.
- H. Li, X. He, Y. Liu, H. Huang, S. Lian, S. T. Lee and Z. Kang, Carbon, 2011, 49, 605 CrossRef CAS PubMed.
- J. Zhou, Z. Sheng, H. Han, M. Zou and C. Li, Mater. Lett., 2012, 66, 222 CrossRef CAS PubMed.
- Z. L. Wu, P. Zhang, M. X. Gao, C. F. Liu, W. Wang, F. Leng and C. Z. Huang, J. Mater. Chem. B, 2013, 1, 2868 RSC.
- S. H. Jin, D. H. Kim, G. H. Jun, S. H. Hong and S. Jeon, ACS Nano, 2013, 7, 1239 CrossRef CAS PubMed.
- P. C. Hsu, Z. Y. Shih, C. H. Lee and H. T. Chang, Green Chem., 2012, 14, 917 RSC.
- Y. Q. Dong, J. W. Shao, C. Q. Chen, H. Li, R. X. Wang, Y. W. Chi, X. M. Lin and G. N. Chen, Carbon, 2012, 50, 4738 CrossRef CAS PubMed.
- W. Kwon, G. Lee, S. Do, T. Joo and S. W. Rhee, Small, 2014, 10, 506 CrossRef CAS PubMed.
- K. Hola, A. B. Bourlinos, O. Kozak, K. Berka, K. M. Siskova, M. Havrdova, J. Tucek, K. Safarova, M. Otyepka, E. P. Giannelis and R. Zboril, Carbon, 2014, 70, 279 CrossRef CAS PubMed.
- A. N. Khlobystov, ACS Nano, 2011, 5, 9306 CrossRef CAS PubMed.
- Y. H. Ng, J. Wang and G. W. Ho, RSC Adv., 2014, 4, 44117 RSC.
- A. Bachmatiuk, R. G. Mendes, C. Hirsch, C. Jähne, M. R. Lohe, J. Grothe, S. Kaskel, L. Fu, R. Klingeler, J. Eckert, P. Wick and M. H. Rümmeli, ACS Nano, 2013, 7, 10552 CrossRef CAS PubMed.
- D. S. Tu, T. Kuila, N. H. Kim, P. Khanra and J. H. Lee, Carbon, 2013, 54, 310 CrossRef PubMed.
- C. A. Zittle, E. S. DellaMonic, J. H. Custer and R. Krikorian, Arch. Biochem. Biophys., 1955, 56, 469 CrossRef CAS.
Footnote |
| † Electronic supplementary information (ESI) available: The experimental section, the discussion of the formation process of CMCD, TEM image, UV/Vis absorption, PL decay curve, effects of pH on the PL intensities of CMCD, particle size distributions, the calculation of energy gaps of the four E-CMCD fractions by cyclic voltammogram, and the excitation-dependent PL intensities and PL decay curve of the four E-CMCD fractions. See DOI: 10.1039/c4ra09520k |
| This journal is © The Royal Society of Chemistry 2014 |

