Enhanced ethanol sensing properties based on Sm2O3-doped ZnO nanocomposites
Cheng Peng*,
Jiaojiao Guo,
Mingrui Liu,
Yixiong Zheng,
Tingting Huang and
Dajun Wu
College of Materials Science and Engineering, Huaqiao University, Xiamen 361021, PR China. E-mail: chengpeng@hqu.edu.cn; Fax: +86 592 6162225; Tel: +86 592 6162225
First published on 19th November 2014
Abstract
ZnO nanocomposites doped with 2, 4, 6 and 8 wt% samaria (Sm2O3) were prepared by a novel sol spray combustion method. The samples were characterized by XRD, FESEM, EDX, UV-vis DRS and Raman techniques. The XRD results show that all samples containing various amounts of Sm2O3 have a hexagonal wurtzite structure. UV-vis spectra show that the addition of Sm2O3 did not affect the band gap of ZnO. Raman spectra exhibit that the Sm2O3-doped ZnO nanocomposite keeps the crystal structure of the bulk ZnO and possesses more surface defects. The influence of Sm2O3 dopant on the response and selectivity for ethanol detecting of the sensor based on ZnO nanoparticles was investigated. The sensors' responses were measured in the presence of 100 ppm of ethanol, formaldehyde, methanol and toluene. As 4 wt% Sm2O3 was added to ZnO, the response to ethanol at various temperatures was significantly enhanced. The results reveal that doping with Sm2O3 may be a promising route for the production of ZnO-based gas sensors with good ethanol sensing properties.
1. Introduction
Recent years have witnessed great interest in semiconducting metal oxide based gas monitoring devices for the detection of toxic pollutant gases, poisonous and hazardous gases.1 As a wide band gap semiconductor, ZnO has been studied extensively owing to its outstanding physical properties, chemical stability, low cost, and good flexibility in fabrication.2 However, the gas sensing properties of ZnO hardly meet the all requirements of gas sensors with high sensitivity, short response and recovery time, good selectivity and long-term stability. For this reason, more recent researches have been focused on improving the gas sensing performance of ZnO.Doping with suitable elements is an effective way to modify the electronic, optical and magnetic properties of metal oxide semiconductor materials.3 Owing to their superior optical, electronic and magnetic properties, rare earth compounds have been widely used in various applications, such as high-performance luminescent devices,4 varistor ceramics,5 catalysts6 and so on. Besides, previous studies have shown that rare earth elements introduced into the metal oxide structure can overcome their disadvantages such as poor sensitivity and selectivity.7 Samarium ion with 4f5 electronic configuration usually exists in the form of triply ionized ion (Sm3+), which shows fast oxygen ion mobility and predominant catalytic properties.8
It's well known that ethanol plays an important role in many applications such as wine industry, food industry, pigment and medical industries. However, people exposed to ethanol may lead to some negative effects, nausea and vomiting, skin and eyes irritation, and even central nervous system depression and acidosis.9 Furthermore, ethanol is commonly used as fuel in our daily life, which may pose threat to the security of our environment. Thus, controlling and monitoring ethanol is of great importance. It's urgent for us to develop a sensor with high selectivity and stability, fast response and quick recovery in the detection of ethanol.10
It is widely accepted that the morphology, grain size and crystal structure of ZnO-based materials, which are strongly depend on the method of preparation, play an important role in its gas-sensing properties. So far, a variety of techniques have been used to synthesize ZnO-based nanostructure, such as sol–gel,11 hydrothermal,12 microwave-assisted combustion,13 ionothermal,14 electrospining,15 magnetron sputtering,16 laser ablation,17 MOCVD18 and etc. However, most of the reported experimental techniques are still limited to the laboratory scale due to some unresolved problems, such as special conditions, tedious procedures or complex apparatus, low yield and high cost.
In this paper, we report on the structural, optical and gas sensing properties of Sm2O3-doped ZnO nanocomposite prepared by a novel sol spray combustion technology. This synthesis method has some advantageous attributes, including low costs, simple experimental setups, high yield, no residual impurities, high energy-efficiency and environmental friend. In addition, the responses of Sm2O3-doped ZnO sensors, containing 2–8 wt% samaria, towards formaldehyde, toluene, methanol, ethanol are also investigated in this work.
2. Experimental
2.1. Sample synthesis
All chemicals were of analytical grade and were used as purchased without further purification. Zinc nitrate hexahydrate (Zn(NO3)2·6H2O), samarium nitrate hexahydrate (Sm(NO3)3·6H2O), ammonia, citric acid were all supplied by Shanghai Chemical Reagent Company.All the samples were prepared by a novel sol spray combustion method. In a typical procedure, Zn(NO3)2·6H2O and citric acid were dissolved in deionized water at room temperature under vigorously stirring. Proper amount of samarium nitrate to achieve 0, 2, 4, 6 and 8 wt% samaria was added to the solution under vigorous stirring. Then pH of the solution was maintained around 7 by gradually adding ammonia followed by vigorous stirring. In the process of sol spray combustion synthesis, sol was obtained by mixing the raw materials and then sprayed onto the heating plate (600 °C) through a airbrush (Veda, WD-128P, PR China) connected with mini pump (Veda, AC-18B, PR China). Small droplets were heated up and then got ignited within several seconds. The combustion reaction resulted into light-yellow, final fluffy samples. The samples are denoted as ZS-x, in which “x” specifies the wt% of Sm2O3.
2.2. Characterization
The crystallographic structures of the as-prepared samples were collected by powders X-ray diffraction (XRD, Cu Ka radiation, SmartLab 3 kW, Rigaku, Japan). The powders morphology observations were carried out on Field Emission Scanning Electron Microscopy (FESEM, Su8010, Hitachi). Raman spectra were collected using a Renishaw InVia micro-Raman spectrometer in backscattering geometry with an Ar+ laser (λex = 532 nm). UV-vis spectrum was recorded on Ultraviolet Spectrophotometer (UV-2550, Shimadzu), using BaSO4 as a reference.2.3. Fabrication of sensors
The WS-30A static gas-sensing system (Weisheng Electronics Co. Ltd, Henan, PR China) was determined to test the sensing performance of the sensors. The structure of the gas sensor belongs to the side-heated type. The preparation process is described as follows: ZS-x and ZnO-NPs was mixed with a suitable amount of terpineol to form a paste and then coated onto the surface of a ceramic tube where a pair of Au electrodes had been installed at each end, and a Ni–Cr heating wire going through the tube was employed as a heating filament to control the operating temperature by tuning the heating voltage. Then the sensors were dried and aged for testing. The operating temperature was regulated automatically by the gas-sensing system and accurately controlled by adjusting the heating voltage. In the process of test, a given amount of target gas were injected into a test chamber and uniformly dispersed by a fan. The gas response was defined as the ratio of the electric resistance, namely S = Ra/Rg, where Ra and Rg is the resistance of metal oxide semiconductors in air and the target gas, respectively. The response or recovery time was estimated as the time taken for the sensor output to reach 90% of its saturation after applying or switching off the target gas in a step function.3. Results and discussion
3.1. Structural and compositional analyses
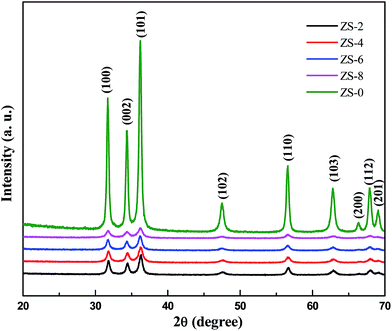
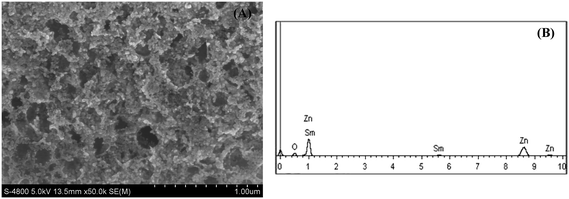
To identify chemically the as-prepared samples, XRD analysis was used to find phase and crystal structure of the Sm2O3-doped ZnO samples prepared under the same conditions. The X-ray patterns of the Sm2O3-doped ZnO with different Sm2O3 content are shown in Fig. 1. It is indicated in the crystal planes (100), (002), (101), (102), (110) and (103) in the patterns, which ban be perfectly indexed to the hexagonal wurtzite structure of ZnO according to the standard JCPDS card (no. 36-1451). Also no diffraction peaks corresponding to samaria and other impurities are observed in these patterns, even when the Sm2O3 content is 8 wt%. This suggests that samaria may exists in amorphous phase or its crystallites are too small to be detected. Furthermore, no shifts were observed for (101) diffraction peak of ZnO doped with different Sm2O3 content. Consequently, Sm2O3 has possibly deposited on the surface of ZnO nanoparticle through the formation of Sm2O3–ZnO nanocomposites rather than Sm3+ substituted for Zn2+ or as an interstitial atom. This could also be supported by UV-vis DRS measurement described below. It is also worth noting that the full width at half maximum (FWHM) of the Sm2O3-loaded ZnO samples is broader than that of pure ZnO and the peak intensity is weaker. Using Scherrer's equation for (101) diffraction peak, the average crystallite size of pure ZnO and ZS-x (x ≠ 0) are estimated to be about 60 nm and 20 nm, respectively. This suggests that the crystallite growth of ZnO could be suppressed when Sm2O3 is present in the samples, which may be attributed to the preventing effect of samarium oxide in the formation of necks and the process of coalescence between particles. This result is in accordance with other reports on Sm2O3-doped metal oxides.19,20Fig. 2A shows the FESEM images of ZS-8 sample. As is shown, the product is foamy porous in nature. The average particle size of ZS-8 samples is about 20 nm, which agrees well with the results calculated by the Scherrer's equation. It is noteworthy that some honey holes appeared in the sample, which is attributed to the gases released from the combustion reaction. In the process of sol-spray combustion a lot of gases can be formed, which will be very helpful for the dispersion of final product. In addition, the EDX spectrum (Fig. 2B) confirms that the as-prepared ZS-8 is composed of zinc, samarium and oxygen elements.
3.2. Optical properties
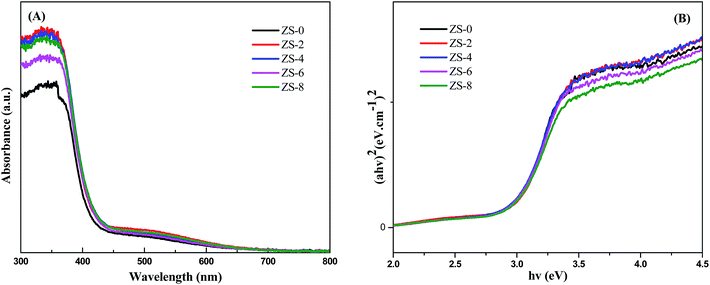
UV-vis spectrum was carried out to investigate the effect of incorporation of Sm2O3 on optical property of ZnO. The UV-vis reflectance spectra of as-prepared samples are shown in Fig. 3A. All samples display fundamental absorption edges rising around 390 nm, which can be attributed to the band–band transition of ZnO nanocrystals. It's obvious that there is almost no significant difference in the absorption edge of ZS-x samples. ZnO has a direct bandgap, we can apply Tauc relation according to the following equation:| (αhν)2 = C(hν − Eg)n | (1) |
3.3. Raman spectra
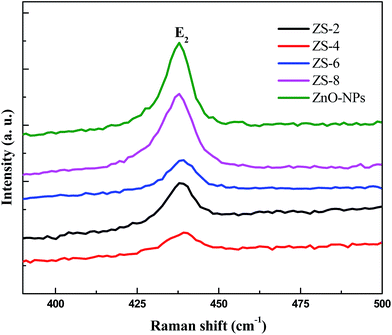
Raman scattering is very sensitive to the microstructure of nanocrystalline materials and used here for the structure elucidation of the Sm2O3-doped ZnO samples. Fig. 4 shows the Raman spectra of ZS-x samples. Hexagonal wurzite ZnO belongs to the C6V4 space group according to the group theory. There are two A1, two E1, two E2 and two B1 modes in the ZnO Raman spectrum. The presence of a sharp peak at 437 cm−1 in the Raman spectra of ZS-x samples can be attributed to the E2 (high) mode of non-polar optical phonons, which is the characteristic peak of the hexagonal wurtzite phase.23 As shown in Fig. 4, E2 (high) shows a shift toward a high frequency (from 437 to ∼439 cm−1) in the following order: ZS-0 < ZS-8 < ZS-6 < ZS-2 < ZS-4. Due to its high sensitivity to stress, the E2 mode (high) is usually applied to investigate the stress state in films.24 This frequency shift of the E2 mode (high) may be ascribed to the stress variation. Since the E2 mode (high) of sample ZS-0 is similar to that (437 cm−1 of bulk ZnO),25 the stress within the sample ZS-0 can be neglected. It was reported that under pressure the E2 (high) frequency of the wurzite ZnO crystal blue-shifted from that of free pressure and increased with the increase of biaxial compressive stress within the c-axis oriented ZnO epilayers.26 In our study, the E2 (high) frequencies of ZS-x (x ≠ 0) samples are all higher than that of pure ZnO, which indicates that addition of Sm2O3 can imposed compressive stress to ZnO. The more compressive stress could bring more defects (such as oxygen vacancy, V0).27 Furthermore, ZS-4 possesses the largest frequency of E2 mode (high) and undergoes the largest compressive stress, which indicates that the density of V0 in ZS-4 is the highest in all samples. This argument could also be supported by the observation that FWHM of E2 (high) increases after doping Sm2O3, especially for ZS-4, because the increase of FWHM of E2 (high) means the increase of defects.283.4. Gas sensing behaviors
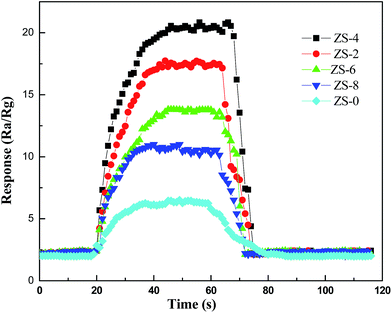
The response curves of the as-prepared samples to 100 ppm ethanol at various operating temperatures are shown in Fig. 5. All samples exhibit different gas sensing performance at different operating temperatures. As can be seen in Fig. 5, the optimal operating temperature of ZS-x for achieving the maximum ethanol response are obtained at about 340 °C, which is much lower than that of pure ZnO, 370 °C. In addition, gas response is saturated to a maximum value of 20.4 when the Sm2O3 concentration reaches 4 wt% at its optimal operating temperature, 340 °C. Apparently, loading Sm2O3 can not only effectively decrease the optimal operating temperature of ZnO-based gas sensor, but also improve its gas sensing response. The gas sensing response would decline above the optimal operating temperature, which might be ascribed to the competing desorption of oxygen.29 Performance of the ZnO-based sensors is known to be dependent on the grain size of ZnO.15 The results of XRD and FESEM confirmed that the grain size of ZnO decreased when being loaded with Sm2O3, which could lead to an increase in the adsorption sites and further an increase in the response. Fig. 6 gives the transient response of ZS-x-based sensors to 100 ppm ethanol at 340 °C. As shown in Fig. 6, the response increases gradually when the contents of Sm2O3 increase from 0 to 4 wt%. However, the response decreases gradually when the contents of Sm2O3 further increase from 4 to 8 wt%. The sensor based on ZS-4 exhibits the best gas sensing performance.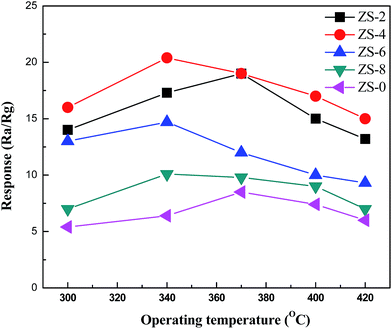 | ||
| Fig. 5 The responses of the ZS-x-based sensors to 100 ppm ethanol at various operating temperatures. | ||
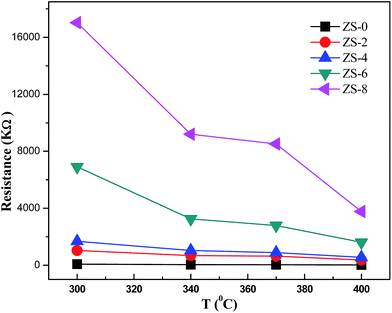
Fig. 7 shows the electrical resistance of ZS-x samples in air (Ra) as a function of temperature. It can be seen that the addition of Sm2O3 increases the resistance of ZnO sample in the temperature range from 300 °C to 400 °C. The electrical resistances of the ZS-6 and ZS-8 samples are obviously much higher than those of ZS-2, ZS-4, and ZS-0 at 300 °C. At 400 °C the electrical resistances of the ZS-0, ZS-2, ZS-4 and ZS-6 samples are very close, but still much lower than that of ZS-8. Sm2O3 loaded on the surface of ZnO can prevent direct contact of ZnO nanoparticles, which results into an increase in the height of Schottky barrier.30 These results are also confirmed by UV-vis results discussed above.
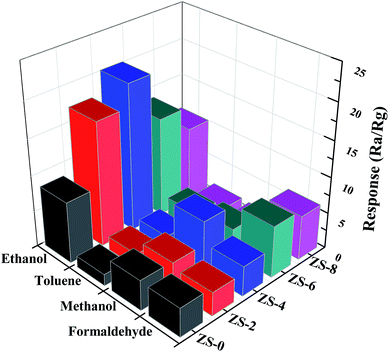
In order to elucidate the sensors selectivity, the responses of the sensors doping with various amount of Sm2O3 towards different kinds of target gases at 340 °C are summarized in Fig. 8. As shown in Fig. 8, the sensors responses to ethanol are greatly enhanced with the addition of Sm2O3. Furthermore, the responses of ZS-x sensor to ethanol are much larger than that of the sensor to other target gases, which can be attributed to the number of electrons released upon exposure to ethanol is more than those of other target gases.31 The response values of ZS-4 samples to 100 ppm ethanol in the presence of all target gases reaches 20.4, which shows ZS-4 is highly selective to ethanol.
3.5. Ethanol sensing mechanism
It's well-known that the sensing mechanism of ZnO is the surface-controlled type. There are some key factors influencing the gas sensing properties, such as surface state, the grain size, oxygen adsorption, lattice defects and so on. When n-type metal oxide semiconductors are exposed in the air, various reactive oxygen species (such as O2−, O2− and O−) are formed on the surface of metal oxide by capturing an electron from the conductance band. The electron concentration on the surface of metal oxide decreases and forms a deplete layer, which caused the potential barrier at the grain boundaries to increase and the carrier concentration to decrease.32 Consequently, the resistance of the ZS-x sensor increased. The target gas reacts with the surface oxygen species, resulting into the concentration of surface oxygen ions decrease and electron concentration increase. Thus the conductivity of the ZS-x increases.ZnO is an n-type semiconductor in which oxygen vacancy acts as an electron donor to provide electrons to the conduction band.33 A larger quantity of V0 can induce more adsorptions of oxygen without reducing the expansion level of depletion layer.20 As a result, ZX-4 has the best sensing performance among the ZS-x samples due to larger quantity of V0.
According to the literature,34 ethanol could be activated via dehydrogenation and dehydration process, which can be described as follows:
| C2H5OH(g) → C2H4(g) + H2O(g) (acidic oxide) | (2) |
| C2H5OH(g) → CH3CHO(g) + H2(g) (basic oxide) | (3) |
Samaria loaded on ZnO plays as an additive to create more basic sites on the surface of ZS-x samples. The products of dehydrogenation and dehydration process would oxidize to COx and H2O. As the dehydrogenation product on samaria basic sites, the number of electrons produced from oxidation of acetaldehyde is much higher that of ethylene according to the following reactions:
| C2H4 + 3O22−(ad) → 2CO2 + 2H2O + 6e− | (4) |
| 2CH3CHO + 5O22−(ad) → 4CO2 + 4H2O + 10e− | (5) |
In this way, the ethanol sensing performance of ZS-x samples is much higher than that of pure ZnO. In addition, smaller grain size, namely, a larger effective surface area of ZS-x samples is also helpful for its better sensing performance than that of pure ZnO.
4. Conclusions
Sm2O3-doped ZnO nanocomposite has been successfully synthesized with a novel sol spray combustion method. The XRD results show that all samples containing various amount of Sm2O3 have hexagonal wurtzite structure. UV-vis spectra show that the addition of Sm2O3 does not affect the ZnO band gap and samaria may be dispersed on the surface of ZnO. Raman spectra show that the ZS-4 possesses the largest frequency of E2 mode (high) and undergoes the largest compressive stress, which indicates that the density of V0 in ZS-4 is the highest in all samples. The gas sensing measurement indicates that the sensor fabricated by Sm2O3–ZnO nanocomposite exhibits better gas sensing performance than that of pure ZnO nanoparticles. In addition, only a proper amount of loading Sm2O3 can result into superior gas sensing performance. When exceeding the optimal amount, further increase in the Sm2O3 concentration results in an adverse effect. Results illustrates that Sm2O3 is a very promising additive for ZnO sensor. The facile synthesis of Sm2O3-doped ZnO nanocomposite together with their superior sensing performance provides a potentially new approach for the design and construction of ZnO-based sensor.Acknowledgements
This work was supported by Scientific Research Fund of Huaqiao University (no. 10Y0195*), Fundamental Research Funds for the Central Universities (no. JB-ZR1138) and The Project Sponsored by the Scientific Research Foundation for the Returned Overseas Chinese Scholars, State Education Ministry.References
- S. L. Bai, L. Y. Chen, J. W. Hu, D. Q. Li, R. X. Luo, A. F. Chen and C. L. Chung, Sens. Actuators, B, 2011, 159, 97–102 CrossRef CAS PubMed.
- P. Rai and Y. T. Yu, Anal. Methods, 2013, 5, 4081–4087 RSC.
- R. Deng, X. T. Zhang, E. Zhang, Y. Liang, Z. Liu, H. Xu and S. K. Hark, J. Phys. Chem. C, 2007, 111, 13013–13015 CAS.
- A. C. F. M. Costa, R. H. G. A. Kiminami, P. T. A. Santos and J. F. Silva, J. Mater. Sci., 2013, 48, 172–177 CrossRef CAS PubMed.
- D. Xu, B. Jiang, L. Jiao, F. D. Cui, H. X. Xu, Y. T. Yang, R. H. Yu and X. N. Cheng, Trans. Nonferrous Met. Soc. China, 2012, 22, S110–S114 CrossRef.
- B. Li and H. Metiu, J. Phys. Chem. C, 2010, 114, 12234–12244 CAS.
- S. Ahmadnia-Feyzabad, Y. Mortazavi, A. A. Khodadadi and S. Hemmati, Sens. Actuators, B, 2013, 181, 910–918 CrossRef CAS PubMed.
- J. C. Boivin and G. Mairesse, Chem. Mater., 1998, 10, 2870–2888 CrossRef CAS.
- A. C. King, J. R. Volpicelli, A. Frazer and C. O'Brien, Psychopharmacology, 1997, 129, 15–22 CrossRef CAS.
- S. C. Tsang and C. Bulpitt, Sens. Actuators, B, 1998, 52, 226–235 CrossRef CAS.
- J. Lee, J. S. Choi and M. Yoon, J. Mater. Chem. B, 2014, 2, 2311–2317 RSC.
- J. Y. Kim, S. Y. Jo, G. J. Sun, A. Katoch, S. W. Choi and S. S. Kim, Sens. Actuators, B, 2014, 192, 216–220 CrossRef CAS PubMed.
- L. C. Nehru, V. Swaminathan and C. Sanjeeviraja, Powder Technol., 2012, 226, 29–33 CrossRef CAS PubMed.
- H. Zhu, J. Hang, Z. Pan and D. Sheng, Chem. Mater., 2006, 18, 4473–4477 CrossRef CAS.
- A. Katoch, G. Sun, S. Choi, J. Byun and S. Kim, Sens. Actuators, B, 2013, 185, 411–416 CrossRef CAS PubMed.
- Y. Jounane, S. Colis, G. Schemerber, P. Kern, A. Dinia and T. Heiser, J. Mater. Chem., 2011, 21, 1952–1958 Search PubMed.
- S. J. Henley, M. N. R. Ashfold and D. Cherns, Surf. Coat. Technol., 2004, 177–178, 271–276 CrossRef CAS PubMed.
- A. Gulino, F. Castelli, P. Dapporto, P. Rossi and I. Fragala, Chem. Mater., 2000, 12, 548–554 CrossRef CAS.
- Q. Qi, T. Zhang, X. Zheng, H. Fan, L. Liu, R. Wang and Y. Zeng, Sens. Actuators, B, 2008, 134, 36–42 CrossRef CAS PubMed.
- S. G. Chen, Y. S. Yin, D. P. Wang and X. Wang, J. Mol. Struct., 2004, 703, 19–23 CrossRef CAS PubMed.
- J. Lee and M. Yoon, J. Phys. Chem. C, 2009, 113, 11952–11958 CAS.
- G. H. Chen, J. L. Li, C. L. Yuan and Y. Yang, J. Mater. Sci.: Mater. Electron., 2013, 24, 3675–3679 CrossRef CAS PubMed.
- A. Umar, B. K. Kim, J. J. Kim and Y. B. Hahn, Nanotechnology, 2007, 18, 175606 CrossRef.
- S. Tripathy, S. J. Chua, P. Chen and Z. L. Miao, J. Appl. Phys., 2002, 92, 3503–3510 CrossRef CAS PubMed.
- J. M. Calleja and M. Cardona, Phys. Rev. B: Solid State, 1977, 16, 3753–3761 CrossRef CAS.
- F. Decremps, J. Pellicer-Porres, A. M. Saitta and C. J. C. Polian, Phys. Rev. B: Condens. Matter Mater. Phys., 2002, 65, 092101 CrossRef.
- L. Liao, H. B. Lu, J. C. Li, H. He, D. Wang, D. J. Fu and C. Liu, J. Phys. Chem. C, 2007, 111, 1900–1903 CAS.
- K. Santhakumar, K. G. N. Nair, R. Kesavamoorthy and V. Ravichandran, Nucl. Instrum. Methods Phys. Res., Sect. B, 2003, 212, 381–385 CrossRef CAS.
- J. Zhang, X. H. Liu, S. H. Wu, B. Q. Cao and S. H. Zheng, Sens. Actuators, B, 2012, 169, 61–66 CrossRef CAS PubMed.
- M. Bagheri, N. F. Hamedani, A. R. Mahjoub, A. A. Khodadadi and Y. Mortazavi, Sens. Actuators, B, 2014, 191, 283–290 CrossRef CAS PubMed.
- T. T. Trinh, N. H. Tu, H. H. Le, K. Y. Ryu, K. B. Le and K. Pillai, Sens. Actuators, B, 2011, 152, 73–81 CrossRef CAS PubMed.
- N. Hongsith, C. Viriyaworasakul, P. Mangkorntong, N. Mangkorntong and S. Choopun, Ceram. Int., 2008, 34, 823–826 CrossRef CAS PubMed.
- C. C. Lin, S. Y. Chen, S. Y. Cheng and H. Y. Lee, Appl. Phys. Lett., 2004, 84, 5040–5042 CrossRef CAS PubMed.
- T. Jinkawa, G. Sakai, J. Tamaki, N. Miura and N. Yamazoe, J. Mol. Catal. A: Chem., 2000, 155, 193–200 CrossRef CAS.
| This journal is © The Royal Society of Chemistry 2014 |

